

Abstract
The active layer thickness (ALT) in permafrost regions regulates hydrological cycles, water sustainability, and ecosystem functions in the cryosphere and is extremely sensitive to climate change. Previous studies often focused on the impacts of rising temperature on the ALT, while the roles of soil water content and soil granularity have rarely been investigated. Here, we incorporate alterations of soil water contents in soil thermal properties across various soil granularities and assess spatiotemporal ALT dynamics on the Qinghai-Tibet Plateau (QTP). The regional average ALT on the QTP is projected to be nearly 4 m by 2100. Our results indicate that soil wetting decelerates the active layer thickening in response to warming, while latent heat exerts stronger control on ALTs than thermal conductivity does. Under similar warming conditions, active layers thicken faster in coarse soils than in fine soils. An important ramification of this study is that neglecting soil wetting may cause overestimations of active layer thickening on the QTP.
Export citation and abstract BibTeX RIS

Original content from this work may be used under the terms of the Creative Commons Attribution 4.0 license. Any further distribution of this work must maintain attribution to the author(s) and the title of the work, journal citation and DOI.
1. Introduction
Permafrost is a key component of the cryosphere and is extremely sensitive to climatic changes (Cheng 2004, Dobinski 2011, Koven et al 2011, Zhao and Wu 2019). Permafrost impacts regional hydrological cycles and ecosystems via the exchanges of water, material and energy between the atmosphere and the Earth (Yang et al 2002, Hansson et al 2004, Vonk et al 2015, Guo and Wang 2016), as it blocks or significantly weakens the hydraulic connection between the surface water and groundwater systems due to poor permeability (Cheng and Jin 2013, Yang et al 2019, Yao et al 2021). On the Qinghai-Tibet Plateau (QTP), which is also known as the 'Asian Water Tower' and the 'Third Pole' of the Earth (Immerzeel et al 2010, Zou et al 2017, Yao et al 2019, Ji et al 2020), permafrost occupies over 40% of the total area. However, with global warming, permafrost on the QTP is rapidly degrading (Kuang and Jiao 2016, Ran et al 2018, Cheng et al 2019). A direct indicator of permafrost degradation is the thickening of the active layer, i.e. the supra-permafrost zone near the ground surface that undergoes seasonal freezing in winter and thawing in summer (Ge et al 2011). Active layer thickening can enhance rainwater infiltration, cause the lengthening and deepening of the flow paths, and may even form 'taliks' that facilitate rapid groundwater recharge (Lawrence and Slater 2005, Immerzeel et al 2010, Cheng and Jin 2013, Evans et al 2015), and thus affects Asia's future water resources and sustainability. Hence, it is vital to assess the dynamics of the active layer thickness (ALT) under climate change on the QTP.
Previous studies on ALT dynamics on the QTP often focused on ALT response to rising air and/or ground temperatures (Xu et al 2017, Zhao and Wu 2019, Wang et al 2020). An important omission is the impacts of climate wetting and/or drying on ALT dynamics. It has been demonstrated that the QTP has become wetter as a whole since the 1980s with increasing precipitation (Zhong et al 2011, Yang et al 2014, Gao et al 2015, Zhang et al 2017, Zhou et al 2019). The Community Climate System Model also projected a general increase in precipitation (e.g. the annual total precipitation in 2081–2100 is projected to be 16.4% higher than that in 1986–2005 under the RCP8.5 scenario in the 5th phase of the Coupled Model Intercomparison Project, CMIP5) over the entire QTP in the future (Gao et al 2018). The increase in precipitation will be likely to cause soil wetting. Indeed, a general soil wetting trend has been observed (Zhao et al 2019) and also projected for the future based on the CMIP6 project (the 6th phase of the Coupled Model Intercomparison Project, Eyring et al 2016). Because the direct assessment of the ALT response to climate wetting (with regard to increasing precipitation) involves additional process complexity (e.g. energy consumption by potentially increased evaporation), here we narrow down the scope of this study to investigate how soil wetting affects future ALT dynamics on the QTP.
Traditional ALT estimates utilizing simplified solutions such as the widely-used Stefan's method (Stefan 1891, as will be detailed later in section 2.2) focuses primarily on the impacts of soil water content on the latent heat of fusion for thaw, i.e. due to the high heat capacity of water and the latent heat of fusion, frozen soils with higher ice contents (corresponding to high water contents after thaw) requires more energy to thaw, leading to thinner active layers. These approaches neglect the control of soil water content on the sensible heat component—higher water contents increase soil thermal conductivity and promote sensible heat transport, resulting in thicker active layers (Clayton et al 2021). It remains to be clarified which mechanism exerts greater control. Furthermore, soil thermal conductivity is also modulated by soil granularity (e.g. soils with more minerals having larger thermal conductivities (Lu et al 2014), which exhibits high spatial variability on the QTP. It is therefore also critical to incorporate the impacts of soil granularity when assessing the ALT dynamics on the QTP under climate change.
Here we develop an ALT model that directly combines the spatiotemporal patterns of the soil water content and soil granularity to assess the ALT dynamics on the QTP. Firstly, we calibrate this model using ALT measurements collected at local sites that are sparsely distributed over the QTP. Then, we apply the calibrated model in the permafrost regions on the QTP to assess the regional ALT dynamics over the historical period (1981–2014) and in future projections (2015–2100). Finally, we explore the roles of the soil water content and granularity on active layer thickening by comparing the simulated ALTs among hypothetical scenarios with different soil water content and soil granularity patterns.
2. Materials and methods
2.1. Study area
The study area, the QTP (figure 1(a)), covers an area of ∼2.5 × 10⁶ km2 with elevations ranging from ∼0 m to ∼8700 m (Yao et al
2012, Kuang and Jiao 2016, Zou et al
2017). Meadow, grassland, and steppe are the dominant vegetation types in the permafrost region on the QTP. Loam and sandy loam are the dominant soil textures for most permafrost areas on the QTP (Wieder 2014). The mean annual ground surface temperature (GST) during 1981–2020 ranged between −12 °C and 10 °C over the QTP with an overall warming rate ranging from 0.16 °C to 0.67 °C decade−1 (Kuang and Jiao 2016). Detailed maps of the elevation, vegetation, soil granularity (represented by the sum of gravel and sand contents, GS), soil texture, thawing index (i.e. the temporal integral of the positive GST during a continuous thawing season), and soil water content of the study region are provided in the supporting information S1 (available online at stacks.iop.org/ERL/17/064012/mmedia).

Figure 1. (a) Spatial distributions of permafrost and seasonally frozen ground (SFG) and the geographical locations of ALT sites and meteorological stations on the Qinghai-Tibet Plateau (QTP) (Zou et al
2017). The map in the lower-left corner shows the location of the QTP in China. (b) Comparison of the simulated ALTs based on the calibrated model to the observations recorded at ALT sites. (c) Three examples of observed (black) and simulated (red) time series of ALTs at sites CN06, QT04 and WD02. (d) Calibrated soil thermal conductivity (λ) against soil water content (SWC) at the ALT sites. The hollow disks represent sites with only one-year observations, and the bars represent those with multiple-year observations. The bold lines in different colors represent the maximum and minimum values for different soil granularities. (e) The relationship between the (fitted) parameter β and the gravel sand content (GS). The bars show the range of β for the corresponding gravel sand content (the bottom and top lines show the minimum and maximum values, and the bottom and top edges on each box indicate the 25th and 75th percentiles, respectively), while the dots depict the mean values. The solid line shows the fitted relationship between the mean  and GS (
 , R2 = 0.83). The purple shaded area in (e) is the 95% confidence interval (lower bound:
  ; upper bound:
  ). The colors in (b), (d) and (e) denote different gravel sand contents (GS).
Download figure:
Standard image High-resolution imageBased on the climate, terrain, and vegetation type, the QTP is divided into 11 ecogeographical subregions (Zheng 1996, Zhao and Wu 2019): North Kunlun mountain desert region (HIID2); Kunlun high mountain and plateau alpine desert region (HID1); Qaidam Basin desert basin (HIID1); Qilian mountains of eastern Qinghai high mountain and basin coniferous forest and steppe region (HIIC1); Ngali mountain desert region (HIID3); Qiangtang Plateau lake basin alpine steppe region (HIC2); Southern Qinghai Plateau and wide valley alpine meadow-steppe region (HIC1); Guolu-Naqu Plateau mountain alpine shrub-meadow region (HIB1); Southern Tibet high mountain and valley shrub-steppe region (HIIC2); Western Sichuan and Eastern Tibet high mountain and deep valley coniferous forest region (HIIA/B1); Southern East Himalayas seasonal rainforest and evergreen broad-leaved forest region (VA6). In the following, we use the ecogeographical subregions to refer to the spatial locations of the QTP.
2.2. The ALT model
The detailed simulation of the ALT requires sophisticated modeling of the heat transport in the soil–water–ice–air continuum, hindering the assessment of long-term ALT dynamics at regional scales. Hence, this study utilized the simple yet robust approach proposed by Stefan (1891) to compute the ALT with additional considerations of the impacts of the soil water content and soil granularity on soil thermal properties. The Stefan's method assumes that (a) heat gains or losses occur through conduction in only the vertical direction in the active layer of the permafrost zone; (b) all surface heat absorption is used to melt the ice in the soil; and (c) the vertical soil temperature profile is linear (Woo 2012, Walvoord and Kurylyk 2016). With these assumptions, the Stefan's method is an estimate of the equilibrium state and the energy balance can be expressed as follows:
where  is the soil thermal conductivity [W m−1 °C−1],
  is the temperature difference between the top and the bottom of the active layer [°C],
  is the thickness of the active layer [m],
  is the latent heat of water (3.34 × 10⁵ J kg−1),
  is the liquid water density (1.00 × 10³ kg m−3), SWC is the volumetric liquid water content of unfrozen soil [m3 m−3], z is the transfer length below the ground surface [m], and t is the transfer time [s].
Integrating equation (1) in the thawing season of each year with the boundary conditions of the temperature equal to the GST at the top of the active layer and equal to the freezing point (often defined as 0 °C) at the bottom of the active layer, Stefan's method computes the ALT according to equation (2) (Stefan 1891, Li and Koike 2003):
where  is the ground surface thawing index [°C day] and
  is the time step factor (8.64 × 10⁴ s day−1).
The Stefan's method is widely used for ALT simulation and is found to be suitable at a large scale because it requires less parameters with lower computational cost compared with land surface models, in which the permafrost physics are often poorly represented (Zhang et al
2013, Walvoord and Kurylyk 2016). It has been shown to provide accurate representations of ALT dynamics across various permafrost regions worldwide and achieves good agreements with observations (Woo et al
2007, Xie and Gough 2013, Peng et al
2018, Hrbáček and Uxa 2019). However, the Stefan's original solution uses a constant soil thermal conductivity  , thereby neglecting the alteration of the soil water content and soil granularity to the thermal properties of soil (Wu et al
2015). Despite the fact that a few studies considered the effects of the soil water content on the latent heat of fusion for thaw via the E-factor (Peng et al
2018, Wang et al
2020), the impacts of the soil water content (and soil granularity) on the sensible heat component have not been directly incorporated. To fill the gap, we integrated a model (equation (3)) that is capable of describing alterations of the soil water content on soil thermal conductivity for different soil granularities (represented by the empirical constant
, thereby neglecting the alteration of the soil water content and soil granularity to the thermal properties of soil (Wu et al
2015). Despite the fact that a few studies considered the effects of the soil water content on the latent heat of fusion for thaw via the E-factor (Peng et al
2018, Wang et al
2020), the impacts of the soil water content (and soil granularity) on the sensible heat component have not been directly incorporated. To fill the gap, we integrated a model (equation (3)) that is capable of describing alterations of the soil water content on soil thermal conductivity for different soil granularities (represented by the empirical constant  ) into Stefan's original solution (Lu et al
2014):
) into Stefan's original solution (Lu et al
2014):

where  is the thermal conductivity of the dry soil [W m−1 °C−1], and
  [-] and
  [-] are empirical constants.
This model is derived from a large dataset of soil thermal conductivities across a wide range of soil water contents for various soil textures (Lu et al
2014). It indicates that the water content exerts highly nonlinear impacts on the soil thermal conductivity, which are controlled by the parameters  and
and  . The thermal conductivity of dry soils
  and the parameters
  and
and  are closely related to soil granularities. The parameters
  and
and  have been demonstrated to remain relatively constant for a spectrum of soil granularities; thus, for simplicity, we used typical values of 0.2 W m−1 °C−1 for
  and 0.3 for
  (Lu et al
2014), while the optimal values of parameter
(Lu et al
2014), while the optimal values of parameter  were obtained by model calibration. Considering the dominant role of soil granularities in determining the thermal conductivities of soils (under similar wetness conditions), we simplified the analysis by representing granularities using the sum of gravel and sand content (termed 'GS'). We divided the mass percentage of the GS in the study area into four categories: 0.2–0.4, 0.4–0.6, 0.6–0.7, and >0.7 (Since the points with GS content between 0.6 and 0.8 account for more than 80%, it is divided into two categories: 0.6–0.7 and >0.7). The detailed calibration procedures are described as follows.
- For each site, we calibrated the soil thermal conductivity
 by fitting the observed ALT data based on equation (2) (using local ground temperatures and soil water contents (SWC) data).
 - Next, we compared the fitted against the SWC and aggregated the results according to soil granularities (represented by the sum of the mass content of the gravel and sand, hereafter gravel sand content, GS).
- For each soil granularity category, we fitted the -SWC curves based on (equation (3)) to obtain the optimal parameter for each soil granularity (GS) category.
- Last, we plotted the optimal against the GS and derived the parameter as a function of GS (equation (4))


Hence, by combining equations (2)–(4), we established the relationships among the soil thermal conductivity, soil water content and soil granularity, thus facilitating the incorporation of the impacts of the soil water content and soil granularity on soil thermal properties into Stefan's original method. This adapted model uses the annual ground surface thawing index and mean soil water content in the thawing season (daily average temperature > 0 °C) as inputs to calculate the ALT for each year. The sensitivity of this model to soil water content and soil granularity is discussed in the supporting information S2.
2.3. Model input data
A total of 329 ALT measurements from 181 sites on the QTP from 1995 to 2018 were collected for analysis (Wu et al 2012, Chen et al 2015, Chen et al 2016b, Cao et al 2018, Zhao et al 2019, Zhao and Sheng 2019; details in supporting information S3), as shown in figure 1(a). For the model calibration based on site observations, we derived the local skin temperatures (i.e. the temperatures of the land surface) and soil water contents at the ALT observation sites from the global dataset for the land component of the fifth generation of European ReAnalysis, termed ERA5-Land (hereafter referred to ERA5L, European Centre for Medium-Range Weather Forecasts, ECMWF, Muñoz Sabater 2019a, 2019b) as model inputs. The ERA5L dataset (spatial resolution of 0.1° × 0.1°) was selected because of its good performance in evaluating the impact of climate change on regional hydrometeorology on the QTP (Orsolini et al 2019, Xiang et al 2021, Xing et al 2021, Zhang et al 2021), in spite of the underestimation of the soil temperature (Cao et al 2020). We calculated the thawing index using ERA5L skin temperature and then adjusted the calculated thawing index for seven different vegetation types based on GST measurements recorded at 74 meteorological stations because the ERA5L dataset underestimates the rates of the climate warming on the QTP (figure 1(a); details of preprocessing can be found in the supporting information S4). Here we adjusted the annual thawing index rather than the daily GST because the thawing index is the direct input of our ALT model. Since the available depth of the ERA5L is up to 2.89 m and the average ALT on the QTP is typically less than this value, e.g. 2.32 m estimated by Wu et al (2015) and 2.50 m according to Zhao and Wu (2019), we opted to use the average soil water content from the ground surface to the soil depth of 2.89 m (the 1st to the 4th soil layers in the ERA5L data format) as model inputs. The applicability of the ERA5L soil water content data is validated by Zhang et al (2021), suggesting that the ERA5L soil water content data performed well during the thawing period compared with site observations on the QTP.
To assess the historical regional ALT dynamics over the QTP, we used the (adjusted) ERA5L dataset (1981–2020) and the Historical scenario (1981–2014) dataset generated by the General Circulation Models (GCMs) in the CMIP6 project as inputs to the calibrated ALT model. For the future projections from 2015 (beginning year of the projection in CMIP6) to 2100, we focused on three climate scenarios, SSP1-2.6, SSP2-4.5 and SSP5-8.5 (representing low, intermediate and high forcing pathways, respectively), considered in the CMIP6 project. Specifically, the daily data of 'temperature of soil' and the monthly soil water content data of the first soil layer (0–2 m) simulated by five GCMs were used (for details, see supporting information S5). The same calibration method with ERA5L data is used for CMIP6 datasets. Because both dynamical and statistical downscaling approaches introduce uncertainties of similar magnitude to GCMs (Chen et al 2011, 2016a), we opt to use the original CMIP6 outputs for the ALT estimates on the QTP. The CESM2 model was chosen as our main analysis in the main text because the Historical scenario in CESM2 model generated the closest temperatures to the observational values among the five utilized models (Hu et al 2022) and produced similar ALT dynamics over the historical period (1981–2014) compared to the simulations using the ERA5L dataset. We refer readers to O'Neill et al (2016) and the supporting information S5 for details regarding the climate scenarios and the GCMs in the CMIP6 project. The scope of the permafrost region over the QTP during the historical period (1981–2020) was produced by Zou et al (2017) and the future projections were from Yin et al (2021).
2.4. Assessing the impacts of soil water content and soil granularity on ALT
To quantify the impacts of the soil water content and soil granularity on the spatiotemporal patterns of the ALT on the QTP, we set up two hypothetical scenarios: (a) the 'constant soil water content' scenario, in which the water content of each grid for the entire simulation period of 1980–2100 was fixed as the decadal average of the 1980s, while the soil granularity was represented by the inventory gravel sand content; and (b) the 'constant soil granularity' scenario, in which the gravel sand content was set as 0.68 (equal to the mode of the inventory gravel sand contents, i.e. the value appears most often of the inventory gravel sand contents) for the entire study area, while the input water content data were derived from the ERA5L and CMIP6 datasets. We then compare the simulated ALTs in these two hypothetical scenarios to the 'real-world' case (denoted as the 'control' scenario), where the ALTs are simulated with spatiotemporally dynamic water contents (derived from ERA5L and CMIP6 datasets) and spatially variable inventory gravel sand contents. Since all the other variables in the 'control' and the hypothetical scenarios are identical, the differences in the simulated ALTs between the 'control' and the hypothetical scenarios reveal the impacts of soil water content and soil granularity on the ALT spatiotemporal dynamics.
3. Results and discussion
3.1. ALT model calibration
We calibrated the adapted ALT model using 329 observations recorded at 181 ALT sites in the permafrost zone on the QTP from 1995 to 2018, representing the most extensive ALT calibration on the QTP thus far, accounting for both the spatial variabilities and temporal dynamics of the ALT. Figure 1(b) presents the simulated ALT values at all sites compared to the observations, with three examples of temporal ALT dynamics shown in figure 1(c) (for the other sites, see supporting information S6). Figure 1(d) shows the calibrated soil thermal conductivity  as a function of the soil water content (SWC) for the 181 ALT sites. The optimal values of the parameter
  (calculated by fitting equation (3)) were obtained for each site and were then modeled as a linear function of the gravel sand content (figure 1(e)). The fitted relationship between the mean β and GS is β = 1.43·GS + 1.10, with R2 = 0.83. Our results demonstrated that the simulated ALTs have a good agreement with the observations (R2 = 0.81, RMSE = 0.25 m) and that the adapted Stefan's solution is suitable for ALT simulations in permafrost regions over the QTP.
3.2. ALT dynamics
Figure 2 depicts the dynamics of the simulated regional average ALT and the spatiotemporal evolution of the ALT from 1980 to 2100 under different climate scenarios. It indicates that the regional average ALT increased from 2.08 m in the 1980s to 2.54 m in the 2010s (based on ERA5L datasets), and is projected to continually increase to 2.78 m, 2.95 m and 3.91 m by 2090s under the scenarios of SSP1-2.6, SSP2-4.5 and SSP5-8.5, respectively (solid curves in figure 2(a)). In general, HIID1, HIID3 and western HIC2 areas have the largest ALTs, with values exceeding 2.2 m, while the ALTs in HIC1 and HIB1 are relatively small, with values less than 1.5 m (figure 2(b)). Figures 2(c) and (d) show that climate warming under both SSP2-4.5 and SSP5-8.5 scenarios will lead to widespread active layer thickening in 2100 on the QTP with ΔALT > 0 for 99% of the permafrost regions, and the ALT increments are much larger under SSP5-8.5 scenario (average ΔALT equal to 1.83 m) than under SSP2-4.5 scenario (average ΔALT equal to 0.87 m; figures 2(c) and (d)). The ALTs in parts of the western HID1, northeastern HIID3 and northwestern HIC2 regions under the SSP2-4.5 scenario are projected to decrease even though the thawing index is rising. We found that the soil water contents in these areas are increasing. With all else equal, we attribute the shallower ALTs in these regions to the wetter soil conditions (for the trends of the thawing index and soil water content, see supporting information S7). The spatial distributions of ΔALT and the changing rate under the SSP1-2.6 scenario are shown in supporting information S8. The future ALTs projected based on the climatic outputs of four additional GCMs confirmed the increasing trend of the ALT (supporting information S5).
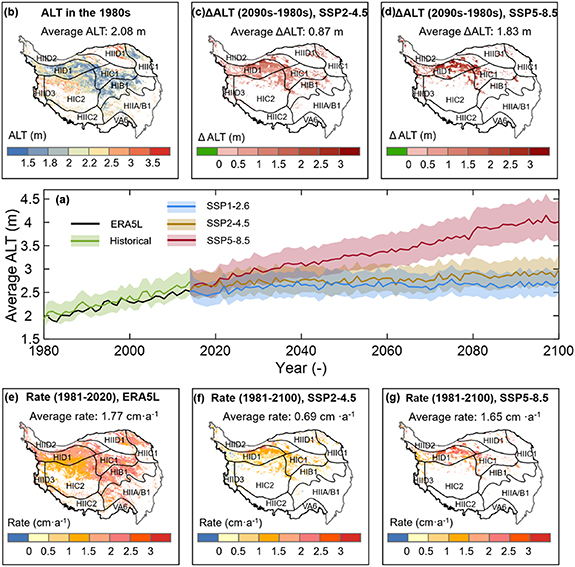
Figure 2. (a) Temporal dynamics of the simulated regional average ALT from 1980 to 2100 for the permafrost region on the QTP. The average ALTs in the historical period were calculated based on the adjusted ERA5L skin temperature data (black line, 1981–2014) and the historical data of CMIP6 (green line, 1980–2014), whereas those from 2015 to 2100 were computed based on projected climate scenarios SSP1-2.6, SSP2-4.5 and SSP5-8.5 (blue, yellow, and red lines). The shaded areas show the ranges of average ALT accounting for the uncertainties of the β parameter (within the 95% confidence interval of the β parameter). (b) Spatial distribution of the ALT in the 1980s calculated from the adjusted ERA5L data. Panels (c) and (d) depict the spatial distributions of the ALT changes between 2090s and 1980s under the SSP2-4.5 and SSP5-8.5 scenarios. Panels (e)–(g) show the spatial distributions of changing rates between different time periods and under different climate scenarios.
Download figure:
Standard image High-resolution imageThe changing rates of the ALTs on the QTP span a wide range and show large spatial variability. For the period of 1981–2020, the ALT averaged over the permafrost areas on the QTP increased at an average rate of 1.77 cm a−1 (range: 0.56–4.23 cm a−1, figure 2(e)). The projected rates for 1981–2100 under the SSP 1-2.6, SSP2-4.5 and SSP5-8.5 scenarios are 0.52 cm a−1 (range: −1.43–3.04 cm a−1, figure S8(b) in supporting information S8), 0.69 cm a−1 (range: −2.06–3.26 cm a−1, figure 2(f)) and 1.65 cm a−1 (range: −1.65–4.31 cm a−1, figure 2(g)), respectively. For the future period from 2021 to 2100, the projected regional average changing rates are 0.10 cm a−1, 0.23 cm a−1 and 1.41 cm a−1 under the SSP 1-2.6, SSP2-4.5 and SSP5-8.5 scenarios, respectively. In general, the simulated ALT changing rates show good agreement with observations (R2 = 0.81, RMSE = 0.25 m) and other studies. For instance, Blue Book on Climate Change in China (2021) shows that the ALTs along the Qinghai-Tibet Highway increased significantly with an average rate of 1.94 cm a−1 during 1981–2020 (CMA, Climate Change Centre 2021). Using the CMIP5 dataset (which is the predecessor of CMIP6 that we used in this study), Wang et al (2020) reported an increasing rate of 0.55 cm a−1 and 1.67 cm a−1 for the regional average ALT on the QTP during the period of 2010–2100 under the RCP4.5 and RCP8.5 scenario, respectively. Our projected ALT changing rates are also within the range (between 1.52 and 6.72 cm a−1) reported by Li et al (2021).
We compare our simulated ALT changing rate on the QTP to other permafrost regions over the globe. Continuous ALT monitoring are conducted in permafrost regions around the Arctic and Antarctic through the CALM network (www2.gwu.edu/~calm/data/webforms/cn_f.html). The regional average ALT increased slightly at a rate of 0.2 cm a−1 (range: −0.1–0.5 cm a−1) and 0.1 cm a−1 (range: −1.5–2.5 cm a−1) in the Alaska North Slope regions and the Antarctica, respectively, while the increasing rate is 0.9 cm a−1 (range: 0.2–0.7 cm a−1) in the Alaska interior regions (Smith et al 2022). The active layers have deepened by 0.82–1.74 cm a−1 in the western northwest territories of Canada during last 25 years (Mamet et al 2017). In western Russia and central Siberia, the active layers are deepening with an average rate of 1.3 cm a−1 (Vasiliev et al 2020, Smith et al 2022). These comparisons suggest that the QTP is experiencing the most drastic permafrost degradation and active layer thickening (1.77 cm a−1) over the globe and thus calls for more attention and protective measures.
3.3. Impacts of soil water content and soil granularity on ALT
To investigate the effects of the soil water content and soil granularity on the ALT over the QTP, we focus on the SSP5-8.5 climate scenario and compare the simulated ALT in the 'control' and hypothetical soil water content and soil granularity scenarios in the 2050s in figure 3 (The results for the 2010s and 2090s under SSP5-8.5 are presented in the supporting information S9. For the SSP1-2.6 and SSP2-4.5 scenarios, see supporting information S10). Despite the negligible small difference in the regional average ALT (−0.182 m) between the 'control' and 'constant soil water content' scenarios, the spatiotemporal soil water content patterns exerted tremendous impacts on the local ALTs. A comparison between figures 3(a) and (b) indicates that the active layers in the HIIC1, HIB1, southern HIC1 and eastern HIC2 areas show distinctive thickening trends with the maximum ΔALT reaching 1.2 m due to soil drying (with the maximum negative ΔSWC of −0.4 m3 m−3), whereas in the western and central HID1 areas, the ALT decreases with soil wetting with the most significant ALT decrease (ΔALT = −2.3 m) corresponding to a positive ΔSWC of 0.2 m3 m−3. The strong negative correlation between ΔALT and ΔSWC implies that active layer thickening is suppressed by soil wetting and promoted by soil drying (figure 3(c)). The comparison of the regional average ALT dynamics between the 'control' scenario and 'constant soil water content' scenario under different forcing pathways also confirm the negative correlation, indicating an over-estimate of ALT without considering the wetting trend in the future (details in supporting information S11). Figures 3(d)–(f) depict the impact of the soil granularity on the response of permafrost to climate change. Changes in the ALT (ΔALT) are positively correlated with differences in the gravel sand content (ΔGS, figure 3(f)), suggesting that permafrost with coarser soils (ΔGS > 0) respond more dramatically (ΔALT > 0) to climate warming than finer soils do (figures 3(d)–(e)).

Figure 3. Comparing the simulated ALTs in the 'control' and hypothetical scenarios. Panels (a) and (b) depict the spatial distributions of the ALT differences (ΔALT) and soil water content differences (ΔSWC) between the 'control' scenario and the hypothetical 'constant soil water content' scenario (the 'control' scenario minus the hypothetical scenario), with the relationship between ΔALT and ΔSWC shown in (c). Panels (d) and (e) depict the spatial distributions of the ALT differences (ΔALT) and gravel sand content differences (ΔGS) between the 'control' scenario and the 'constant soil granularity' scenario with the relationship between ΔALT and ΔGS shown in (f). The data shown in this figure are based on the simulation results for the 2050s under the SSP5-8.5 scenario.
Download figure:
Standard image High-resolution image
The strong negative correlation between ΔALT and ΔSWC implies that the ALT promoting effects caused by the increasing thermal conductivity with soil wetting cannot offset the decrease in ALT due to latent heat fusion, i.e. latent heat dominates over thermal conductivity in determining the ALT response to soil wetting. However, the increase in the thermal conductivity with soil wetting attenuates the decreasing trend of the ALT induced by latent heat of fusion for thaw (supporting information S12). The decreasing trend in ALT with increasing soil water content is also supported by the site observations in the permafrost regions in Alaska (Jafarov et al 2017, Clayton et al 2021; details in supporting information S13).
4. Summary and conclusions
We proposed a modeling framework that incorporates the impacts of the soil water content and soil granularity on the thermal conductivity into the original Stefan's method to investigate the spatiotemporal dynamics of the ALT on the QTP. This model was well calibrated using a large amount of observations covering the most extensive surface conditions on the QTP. We then assessed the spatiotemporal dynamics of the ALT on the QTP, and the results suggest that the regional average ALT on the QTP increased at a rate of 1.77 cm a−1 (range: 0.56–4.23 cm a−1) from 1981 to 2020. Future projections suggest that the ALT on the QTP will continue to increase and may be close to 4 m by 2100 under the SSP5-8.5 climate scenario. By comparing the real-world case to the hypothetical 'constant soil water content' and 'constant soil granularity' scenarios, our results suggest that soil wetting decelerates active layer thickening and that latent heat dominates over thermal conductivity in determining the ALT response to soil wetting. Further, coarse soils respond more drastically than fine soils under similar environmental conditions. As the QTP is experiencing a general wetting trend, our results imply that neglecting the impacts of the soil water content may over-estimate the future ALT under a warming climate. The results of this study lay an important basis for future studies on the impacts of permafrost degradation on hydrological processes in cold regions.
Acknowledgments
This work was supported by the National Natural Science Foundation of China (Grant Nos. 41861124003, 92047202 and 41807288). Additional support was provided by the State Environmental Protection Key Laboratory of Integrated Surface Water-Groundwater Pollution Control of China. We are very grateful to Fujun Niu and Guoan Yin for sharing their latest research results of the projected permafrost distributions with us. We thank Dezhao Yan, Yu Zhou, Yulong Gao, and Yiguang Zou for their technical assistance. We thank four anonymous reviewers for their comprehensive and constructive comments.
Data availability statement
The ALT observations used in this study can be accessed in cited (Wu et al 2012, Chen et al 2015, Chen et al 2016b, Cao et al 2018, Zhao et al 2019, Zhao and Sheng 2019) and the CALM network: www2.gwu.edu/~calm/data/webforms/cn_f.html. The meteorological station data were downloaded from the China Meteorological Data Service Center: http://data.cma.cn/en/?r=data/detail&26dataCode=A.0012.0001; the spatial distribution of the permafrost and seasonally frozen ground on the QTP can be available at the National Tibetan Plateau Data Center: https://poles.tpdc.accn/en/data/0231c972-8460-4691-a187-70e4cc356f60/ (if it is not available, please try the following data sharing website: https://figshare.com/articles/dataset/A_new_map_of_permafrost_distribution_on_the_Tibetan_Plateau_2017_/16566312); the gravel sand content and soil texture data were obtained from the Regridded Harmonized World Soil Database (HWSD): http://dx.doi.org/10.3334/ORNLDAAC/1247; the vegetation type data were obtained from the Resource and Environmental Science Data Center (RESDC), Chinese Academy of Sciences: www.resdc.cn/data.aspx?DATAID=122; the ERA5L and the CMIP6 datasets are openly available at www.ecmwf.int/en/forecasts/datasets/reanalysis-datasets/era5 and https://esgf-node.llnl.gov/projects/esgf-llnl.
All data that support the findings of this study are included within the article (and any supplementary files).