

Abstract
Fire is one of the main anthropogenic drivers that threatens the Amazon. Despite the clear link between rainfall and fire, the spatial and temporal relationship between these variables is still poorly understood in the Amazon. Here, we stratified the Amazon basin according to the dry season onset/end and investigated its relationship with the spatio-temporal variation of fire. We used monthly time series of active fires from 2003 to 2019 to characterize the fire dynamics throughout the year and to identify the fire peak months. More than 50% (32 246) of the annual mean active fires occurred in the peak month. In 52% of the cells, the peaks occurred between August–September and in 48% between October–March, showing well-defined seasonal patterns related to spatio-temporal variation of the dry season. Fire peaks occurred in the last two months of the dry season in 67% of the cells and in 20% in the first month of the rainy season. The shorter the dry season, the more concentrated was the occurrence of active fires in the peak month, with a predominance above 70% in cells with a dry season between one and three months. We defined a Critical Fire Period by identifying the consecutive months that concentrated at least 80% of active fires in the year. This period included two to three months between January and March in the northwest, and in the far north it lasted up to seven months, ending in March–April. In the south, it varied between two and three months, starting in August. In the northeast, it was three to four months, between August and December. By quantifying the role of the dry season in driving fire seasonality across the Amazon basin, we provide recommendations to monitor fire dynamics that can support decision makers in management policies and measures to avoid environmentally or socially harmful fires.
Export citation and abstract BibTeX RIS

Original content from this work may be used under the terms of the Creative Commons Attribution 4.0 license. Any further distribution of this work must maintain attribution to the author(s) and the title of the work, journal citation and DOI.
1. Introduction
Anthropogenic activities and extreme droughts are the main drivers of fire in the Amazon (Aragão et al 2007, Cochrane and Laurance 2008). Amazonian fires are strongly linked to deforestation (Aragão et al 2008) and public land grabbing (Azevedo-Ramos and Moutinho 2018). Fire is also used for pasture maintenance and weed control by cattle ranchers and in family farming by smallholders, indigenous and traditional peoples (Barlow et al 2020). In addition, fires can also accidentally advance to nearby forest areas and in a fire-sensitive system as the Amazon Forest, result in increased tree mortality (Barlow et al 2003, Pontes-Lopes et al 2021), changes in forest structure and composition (Bond and Keeley 2005, Barlow and Peres 2008) and long-term reductions in carbon stocks (Silva et al 2018). The synergy between anthropogenic ignition sources and extreme droughts tends to intensify forest fires, resulting in a 50% increase in carbon emissions compared to non-drought years (Aragão et al 2018). The societal consequences of fires in the Amazon are evidenced by the harming of the health of local populations (Smith et al 2014, Reddington et al 2015) and by the huge economic losses, with regional estimates indicating a loss of 9.07 ± 2.46% of gross domestic product, in southwestern Brazilian Amazon (Campanharo et al 2019).
Understanding of the fire seasonality is critical for a better allocation of resources for socioeconomic and environmental policies, especially when budgets for these proposals are restricted. Indeed, the scarcity of financial resources is a reality faced by several countries in the Amazon basin (Suarez et al 2018, Levis et al 2020, Hope 2021). Thus, actions taken in key months of the fire calendar could help strengthen the tracking of criminal fires and reduce the risk of fires escaping from anthropogenic areas to surrounding forests. Furthermore, knowing the fire seasonality is equally important to define the periods when controlled burning is allowed, an essential practice for people who depend on it to guarantee their livelihoods (Mistry et al 2016, Eloy et al 2018), and can have the right of use ensured by law (Brasil 2012). Clarifying fire seasonality is also necessary to reduce uncertainty in estimates of fire-associated carbon emissions in the Amazon, as fire in the onset, middle and end of the dry season have different behaviours (Rissi et al 2017, Amaral et al 2019). Combustion becomes more efficient as the dry season progresses, resulting in reduced carbon monoxide and increased carbon dioxide emissions (Hoffa et al 1999).
Fire dynamics are often described in terms of the size, frequency or duration of burn scars (Andela et al 2019). However, despite the clear seasonal coupling between rainfall and fire in the Amazon (Aragão et al 2008), marked spatial differences in the onset, length, and peak of the dry seasons (Moura et al 2015, Anderson et al 2018, Berenguer et al 2021), and the strong interannual variation in the hydrological cycle (Villar et al 2009), this variability is rarely included in research. For example, researchers often depict a generalized dry season that has been fixed between July–September (Saleska et al 2007, Samanta et al 2010, Xu et al 2011), July–October (Cox et al 2008, Marengo et al 2011) and August–October (Xu et al 2020). However, when spatio-temporal variation in the rainfall regime over the Amazon is disregarded, variations in the fire dynamics can consequently be misinterpreted (Berenguer et al 2021). Few studies have addressed the fire occurrence according to regional dry season patterns (McDaniel et al 2005, Romero-Ruiz et al 2010, Armenteras-Pascual et al 2011, Alencar et al 2015), but knowledge of this relationship is still unclear for the entire Amazon.
Here, we investigated in detail the interaction between rainfall and fire across the Amazon. With a spatio-temporal stratification of the dry season, we seek to overcome the constraints in understanding the fire dynamics imposed by the variability of the rainfall regime. We aimed to (a) produce spatially explicit maps of the Amazon basin according to the onset, end, and length of the dry season, (b) characterize the fire seasonality according to the variation of the dry season, and (c) define the months with the highest occurrence of active fires, which could be used to inform policy. Given that we are interested in the timing of the fire and not what is burning, we do not attempt to divide fires into their different types. We discuss our results showing the importance of considering the spatio-temporal variations in the dry season across the Amazon to improve the monitoring of the fire occurrence and provide recommendations that can be useful for decision-makers in the strategic management planning across the fire season.
2. Methods
2.1. Study area
The study area encompasses an area above 6.5 million km2 of the Amazon basin, including seven countries in South America, with Brazil accounting for the largest area, covering 63% (figure 1). About 31% is concentrated in the Andean countries Peru (9%), Colombia (7%), Venezuela (7%), Bolivia (7%) and Ecuador (1%). The remaining area occurs in Guyana (3%), Suriname (2%) and French Guiana (1%). In addition to forest areas, savanna patches occur mainly in Bolivia, in the far north of Brazil and Venezuela (figure 1). The Amazon has one of the highest rainfall regimes globally (Villar et al 2009), reaching annual values above 5000 mm in some parts of the basin (figure 1).

Figure 1. Study area in the Amazon basin. The percentage of forest cover and deforestation observed between 2000 and 2020 were extracted from the Global Forest Change data (Hansen 2013). Vegetation was defined by combining data from global biomes (Olson et al 2001) and regional mapping of the Brazilian Amazon (DNPM - RADAMBRASIL, 1973–1983). Mean annual rainfall was calculated using Climate Hazards Group InfraRed Precipitation with Station data (CHIRPS) from 1981 to 2019.
Download figure:
Standard image High-resolution image2.2. Data and analysis
2.2.1. Stratifying the Amazon basin according to dry season variation
We calculated the mean monthly rainfall of each pixel using a 39 year time series (1981–2019) from Climate Hazards Group InfraRed Precipitation with Station data (CHIRPS). The CHIRPS algorithm incorporates satellite data, precipitation estimates, and records of in situ pluviometric stations, providing a product since 1981 with daily frequency and spatial resolution of 5.4 km (Funk et al 2015). This is a recent dataset, which has already performed well in several regions of the world (Duan et al 2016, Katsanos et al 2016, Perdigón-Morales et al 2018). For the Amazon, the validation of these data showed that CHIRPS explains 73% of the data from rain gauge stations (Anderson et al 2018).
We resampled the data to a spatial resolution of 10 km using the bilinear method. We adopted a threshold of 100 mm to define the dry season, as this is the mean monthly evapotranspiration value of tropical forests (Shuttleworth 1989, Rocha et al 2004, Von Randow et al 2004). With the persistence of rainfall below 100 mm, evapotranspiration exceeds rainfall, which can be used as an indicator of water deficit in tropical forests (Malhi et al 2002, Aragão et al 2007). This threshold is also in accordance with the value considered for Amazonian savannas (Biddulph and Kellman 1998). We defined the dry season timing by grouping pixels that share the same month for the onset and end of the dry season. We defined the dry season length as the number of consecutive months with rainfall lower than 100 mm. The differentiation between timing and length of the dry season is important because pixels with the same dry season length can have a different dry season timing. For example, if in a pixel the dry season began in June and ended in September, it has a different dry season timing from a pixel that had the onset of the dry season in May and the end in August, although both have a four-month dry season length. All raster files of the dry season (onset, end, and length) are available at Zenodo (https://doi.org/10.5281/zenodo.5706455).
2.2.2. Fire seasonality
We used active fires data from the Fire Information for Resource Management System, available between 2003 and 2019 (NASA 2020). We used the standard product of the Aqua/MODIS Collection 6 (Giglio et al 2018), which comprises daily observations and represents the centre of a pixel with a spatial resolution of 1 km. We only considered active fires with a confidence level above 80%.
To characterize the fire seasonality in each cell, we calculated the mean of cumulative active fires on the annual and monthly scales. We also calculated the monthly percentage of fire, expressed as the mean (2003–2019) of the percentage ratio between the number of active fires in each month and the total active fires accumulated in the respective year. We defined the fire peak month as the month with the highest monthly percentage of fire.
2.2.3. Critical fire period
To define Critical Fire Periods across the Amazon, (a) we classified the cells with fire activity considering the dry season regions, which were previously defined according to the dry season timing, (figure S1 available online at stacks.iop.org/ERL/16/125009/mmedia) and then, (b) we used the k-means clustering method (MacQueen 1967) to group the regions according to similar behaviour in terms of the monthly percentage of fire. In this step, we first calculated the optimal number of clusters, expressed as the number of clusters for which the decay still results in a high differentiation from the others. Then, the Euclidean distance was considered for clustering in the k-means method, such that regions of the same cluster have high intraclass similarity and low interclass similarity for the other clusters (Kassambara 2017). For each region of each cluster, we defined the Critical Fire Period as the consecutive months in which the sum of the monthly percentage of fire was above 80%. This threshold was defined to capture both the period of maximum fire activities and a minimum number of months that can be used for strategic planning (figure S2).
3. Results
3.1. Spatio-temporal variation of the dry season
The seasonal variation in rainfall was spatially distributed, resulting in 74 regions with different dry season timings (figures 2 and S1). There is no dry season in 21% of the Amazon, with the largest area concentrated close to the equator, northwest of the basin (figure 2 and table S1). For the remaining area, we observed the expected opposite seasonal patterns between the north and south hemispheres. The dry season between May and September represents 41% of the area and covers most of the basin (figures 2(a) and (b)). In the northern hemisphere, in the west part, the dry season occurs between November and April, while in the east, it is concentrated between August and December, encompassing 7% and 14% of the area, respectively (figures 2(a) and (b)). In 58% of the Amazon, the dry season length varied among three (20%), four (17%), and five (21%) months (figure 2(c) and table S1). The shortest dry season lengths, one and two months, covered 14% of the basin and were adjacent to the aseasonal region. Dry season length with more than five months represented only 6% of the area and was restricted mainly to the north and northeast of the basin (figure 2(c) and table S1).

Figure 2. Spatio-temporal patterns of the dry season in the Amazon Basin were calculated using CHIRPS data from 1981 to 2019 at a spatial resolution of 10 km. The dry season includes the months with mean monthly rainfall below 100 mm. The onset/end months of the dry season are shown in figures (a) and (b), respectively. The dry season length is the number of consecutive months of the dry season (figure (c)).
Download figure:
Standard image High-resolution image3.2. Spatio-temporal relationship between the dry season and fire occurrence
From 2003 to 2019, an annual average of 63 710 (±31 088) active fires were observed in an area that covered 42% of the Amazon (figure 3(a) and table 1). The annual mean was less than two active fires in 62% of cells, corresponding to 18% of observations (table 1). Although only 10% of the cells had more than six active fires, they accounted for 39% of the annual mean (24 752, table 1).
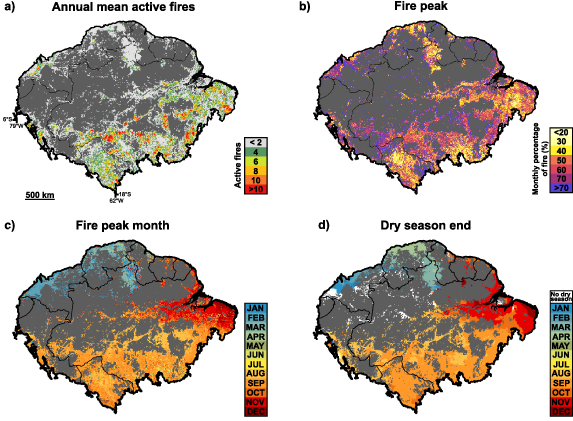
Figure 3. (a) Annual mean active fires observed in each cell considering the period between 2003 and 2019. (b) Monthly percentage of fire observed in the peak month, the highest burning activity observed in each cell during the year. The monthly percentage of fire was calculated as the mean percentage ratio between the number of active fires in each month and the total active fires accumulated in the respective year. Figures (c) and (d) show the month of the fire peak and dry season end, respectively. Cells without active fires are shown in dark grey on all maps.
Download figure:
Standard image High-resolution imageTable 1. Cells with active fires were divided into six classes according to the number of active fires observed (<2, 2–4, 4–6, 6–8, 8–10 and >10). The table shows the total cells and annual mean active fires observed in each class.
| Class | Cells | Annual mean active fires | ||
|---|---|---|---|---|
| Number | % | Number | % | |
| <2 | 17 322 | 62.47 | 11 637.94 | 18.27 |
| 2–4 | 5243 | 18.91 | 15 266.00 | 23.96 |
| 4–6 | 2453 | 8.85 | 12 053.65 | 18.92 |
| 6–8 | 1293 | 4.66 | 8987.06 | 14.11 |
| 8–10 | 664 | 2.39 | 5939.12 | 9.32 |
| >10 | 753 | 2.72 | 9825.82 | 15.42 |
| Total | 27 728 | 100 | 63 709.59 | 100 |
Considering the distribution of fire activity throughout the year, more than half of the annual mean active fires (32 246) occurred in the peak month of each cell, (table S2). In 43% of the cells, 30% to 50% of the monthly percentage of fire of the year occurred in the peak month (figure 3(b) and table 2(a)). These contributions were greater in cells with up to six active fires in the peak month (table 2(b)). Cells with a monthly percentage of fire in the peak month between 50% and 70% added up to 28% of the cells, with the highest occurrence of these percentages in cells with more than six active fires in the month with the highest burning activity (figure 3(b) and table 2). Furthermore, the shorter the dry season length, the more concentrated the burning activity was in the peak month, with a predominance of the monthly percentage of fire above 70% in cells with a dry season varying between zero and three months (figure 4).
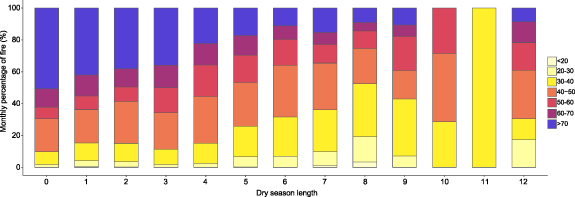
Figure 4. Cell distribution for each dry season length according to the monthly percentage of fire observed in the peak month (<20%, 20%–30%, 30%–40%, 40%–50%, 50%–60%, 60%–70% and >70%).
Download figure:
Standard image High-resolution imageTable 2. Fire occurrence in the peak month. Table 2(a) shows the distribution of cells with burning activity according to the monthly percentage of fire observed in the peak month (10%–20%, 20%–30%, 30%–40%, 40%–50%, 50%–60%, 60%–70% and >70%). Table 2(b) shows the cells divided into six classes according to accumulated of active fires in the peak month (<2, 2–4, 4–6, 6–8, 8–10 and >10) and their distribution considering the classes of the monthly percentage of fire.
| Monthly percentage of fire (%) | ||||||||||
|---|---|---|---|---|---|---|---|---|---|---|
| (a) | 10–20 | 20–30 | 30–40 | 40–50 | 50–60 | 60–70 | >70 | Total | ||
| Cells | 62 | 1269 | 4417 | 7474 | 4398 | 3392 | 6716 | 27 728 | ||
| % | 0.22 | 4.58 | 15.93 | 26.95 | 15.86 | 12.23 | 24.22 | 100 | ||
| Monthly percentage of fire (%) | ||||||||||
| (b) | Active fires | Cells | 10–20 | 20–30 | 30–40 | 40–50 | 50–60 | 60–70 | >70 | Total (%) |
| <2 | 22 776 | 0.27 | 5.31 | 17.14 | 26.92 | 12.72 | 10.90 | 26.74 | 100 | |
| 2–4 | 3334 | 0.03 | 1.65 | 12.96 | 28.61 | 28.25 | 16.56 | 11.94 | 100 | |
| 4–6 | 1043 | 0.00 | 0.38 | 6.33 | 26.56 | 32.69 | 19.85 | 14.19 | 100 | |
| 6–8 | 391 | 0.00 | 0.00 | 3.32 | 18.93 | 38.36 | 25.58 | 13.81 | 100 | |
| 8–10 | 128 | 0.00 | 0.00 | 2.34 | 24.22 | 35.94 | 23.44 | 14.06 | 100 | |
| >10 | 56 | 0.00 | 0.00 | 0.00 | 10.71 | 39.29 | 35.71 | 14.29 | 100 | |
| Total | 27 728 | — | — | — | — | — | — | — | ||
We observed two opposite fire seasons in the northern and southern hemispheres, concentrated at the beginning and end of the year, respectively (figure S3). Furthermore, we observed a well-defined spatio-temporal relationship between the fire peak and the dry season end (figures 3(c) and (d)). Similar to dry season end, the fire peak month showed three clear patterns throughout the basin with different seasons among the south, north, and eastern Amazon (figures 3(c), (d) and table S3). In 52% of the cells, mainly covering the centre-south of the basin, the fire peak occurred in August (17%) and September (35%), (figure 3(c) and table S3(a)). Concentrated in the eastern Amazon, 28% of the cells presented the fire peak in the last trimester of the year. In 14% of them, the peak occurred in October, 11% in November and 4% in December (figure 3(c) and table S3(a)). Conversely, in the north of the basin, the fire peak occurred in the first three months of the year, encompassing 14% of the cells distributed in January (4%), February (6%) and March (4%), (figure 3(c) and table S3(a)).
Regarding the time-lag to the dry season end, fire peaks were concentrated in the last two months of the dry season and the first month of the subsequent rainy season. In 47% of the cells that had a dry season defined, the fire peak and dry season end occurred in the same month (figures 3(c), (d) and table S4). Forty per cent of the cells had a one-month lag between the dry season end and the fire peak, of which 20% had a fire peak one month before the dry season end, and 20% had a fire peak in the month after the end of the dry season (figures 3(c), (d) and table S4). Considering the dry season length of the cells, the time-lag revealed a unimodal distribution for most lengths (figure 5). The greatest correspondence between the fire peak and the dry season end occurred in the dry season length of five months, accounting for 56% of the total cells (figure 5 and table S5). We also observed that the longer the dry season length, the greater the number of cells with the fire peak in the months before the end of the dry season (figure 5). Conversely, fire peaks after the dry season end were more frequent in cells with a dry season length less than three months, occurring mainly in the first month of the rainy season and representing 36% to 48% of the total of cells (figure 5 and table S5).

Figure 5. Distribution of cells according to the time-lag between the fire peak and dry season end, considering their dry season length. The number of cells observed for each dry season length is shown on the right of each distribution graph. Cells without time-lag had the dry season end and fire peak in the same month. Negative and positive time-lags indicate fire peaks occurring in the months before and after the end of the dry season, respectively. Cells with active fires but no dry season are not shown.
Download figure:
Standard image High-resolution image3.3. Critical fire period
We found four clusters with clear spatial patterns distributed among the northwest (C1), north (C2), south (C3), and northeast (C4), (figures 6(a) and (b)). C1 covered regions with a dry season length of less than three months and occurring at the beginning of the year. This cluster concentrated 2.38% (1519) of the annual mean active fires, with most critical periods start in January and last two to three months, which can encompass the entire dry season, as well as the subsequent onset of the rainy season (figure 6(c)). The longest critical periods were observed in C2, located in the savanna areas of northern Brazil and Venezuela, ranging from four to seven months (figures 6(b) and (c)). C2 concentrated 4.68% (2984) of the annual mean active fires, and the regions with the highest burning activity had critical periods ending in March/April (figure 6(c)). These regions showed a dry season length of four to seven months and had a more equitable distribution of the monthly percentage of fire during the critical period, with values mainly ranging between 10% and 30% (figure 6(c)). C3 covered the basin area with the highest burning activity, with critical periods mainly beginning in August and lasting for two to three months in the six regions that added up to 67% (42 837) of the annual mean active fires (figure 6(c)). In general, this period included the dry season end and the rainy season onset, with mean monthly percentages of fire for August, September, and October of 31%, 41% and 18%, respectively (figure 6(c)). The critical periods in C4 mainly included three to four months, ending in November/December. In the eight regions that concentrated 20% (12 766) of the annual mean active fires, the critical period was concentrated in the last two months of the dry season and the first month of the rainy season subsequent, accounting for about 62% and 23% of the monthly percentage of fire of the year, respectively.

Figure 6. The regions defined according to the dry season timing (onset/end) were grouped into four clusters (C1, C2, C3 and C4), considering the similar behaviour of the monthly percentage of fire (figure 6(a)). The monthly percentage of fire in each region was calculated as the mean percentage ratio between the number of active fires in each month to the total active fires accumulated in the respective year. The spatial distribution of the four clusters is illustrated in figure 6(b). The monthly percentage of fire for each region in each cluster is illustrated in figure 6(c). The regions are ranked in descending order within each cluster according to the percentage of active fires in relation to the annual mean active fires (63 710) observed in the Amazon basin. The dry season timing of each region is illustrated by black rectangles.
Download figure:
Standard image High-resolution image
4. Discussion
Although the dry season plays a key role in the fire occurrence, the spatio-temporal relationship between these variables was not clear for the Amazon. We advanced on this issue, stratifying the Amazon into dry season regions and showing spatially explicit results of the fire calendar for each of them. The characteristics of the dry season allowed us to describe a spatio-temporal variation beyond those widely reported in the main deforestation epicentres in the Amazon (Aragão et al 2008, Maeda et al 2009). We outline the importance of the fire calendar for (a) research examining fire dynamics, and (b) policy and management.
4.1. Analytical importance
Our analysis clearly shows that fire analyses that disregards the seasonality of the dry season will misrepresent fire dynamics in several parts of the Amazon (Berenguer et al 2021). For example, an approach that uses the epicentres of deforestation to fix a single dry season for the entire basin, would misinterpret the fire dynamics in about 48% of the Amazon (table S3(a)). This includes some notable fire hotspots such as Roraima, the location of the 1997–98 megafires (Elvidge et al 2001); Colombia, where deforestation-related fires are expanding in recent years (Armenteras-Pascual et al 2011); and the eastern Amazon, including some of the deforested regions where both indigenous peoples and endemic species are highly threatened (Silva Junior et al 2020). The importance of these regions demonstrates the fact that Amazon-wide assessments of fire must consider seasonality.
Defining the present-day fire calendar could also help track how climate change could modify fire seasons, which is important given fire's key role in any large-scale forest dieback (Nobre et al 2016). Extreme droughts are affecting the Amazon with greater frequency, extension and severity (Panisset et al 2017). Furthermore, the dry season is becoming longer (Anderson et al 2018), with some regions in the Southern Amazon extending by one week per decade (Fu et al 2013). Changes in the timing and length of the dry season can modify the fire-prone period throughout the year, and the calendar presented could help to track changes in fire seasonality more clearly. In the last 40 years, some parts of the Amazon have seen a 34% reduction in rainfall between August and October, in addition to temperature increases of up to 2.5 °C (Gatti et al 2021). As our results show that 65% of the Amazon has a fire peak between August and October, these changes may be relevant to the fire calendar, particularly in the south and east regions (table S3(a)). In a trend towards a warmer dry season and even drier months, we can also expect a change in the fire type occurring, mainly due to increase of forest fires, as these conditions boost the flammability of the forest, making it a fire-prone system (Brando et al 2020). Linking fire seasonality to fire type is challenging (Chen et al 2013), but remains an important research priority to track the impacts of fire (Barlow et al 2020).
4.2. Fire policy and practice
Fire prevention/fighting actions are more successful when a fire calendar is available (Anderson et al 2021, McKemey et al 2021), and its lack has led to actions that do not fully contemplate fire planning, prevention and mitigation. For example, in August 2019, the Brazilian Amazon was exposed to a large increase in fire that drew the world's attention (Barlow et al 2020). To curb this environmental crisis, the Brazilian government enacted decrees prohibiting the use of fire until the end of October. However, the control did not last long, and, as soon as the law validity expired, fire rose once again in November (Silveira et al 2020). Our analysis shows that territorial boundaries are not the most suitable limits for defining seasonally-dependent environmental policies, especially in countries like Brazil with continental dimensions. We defined three different fire periods in the Brazilian Amazon, and these should be considered for more specific policy making (figure 6 and table S6). This is especially important for a Bill to develop a National Integrated Fire Management Policy in Brazil, that has been in progress since 2018 (Brasil 2018); our results would provide science-based guidelines to incorporate the seasonality and spatio-temporal variation of the fire in the region. The fire calendar can also improve policy at smaller scales: for example, Pará, one of the Brazilian states with the highest burning activity, has two distinct fire seasons (figure 6).
The fire calendar can also help define when prevention/firefighting actions need to be implemented in relation to the dry season onset. In general, the shorter the dry season length, the faster these actions must be taken to ensure its effectiveness. This is particularly important in countries such as Colombia, where favourable conditions for fire have a shorter duration, and for this reason, the burning activity begins as soon as the dry season starts. Importantly, we found that longer dry seasons do not imply a longer Critical Fire Period, except for savanna areas where dry season length can extend beyond six months; these savannas have evolved with fire and active fires were distributed more evenly during the dry season. However, in most of the basin, if fire containment interventions were concentrated for three to four months, the reduction could reach more than 80%. Furthermore, it is interesting to note that Critical Fire Period can also cover the rainy season onset. As the fuel load at the end of the dry season is in its driest condition, the fire can still be sustained at the onset of the subsequent rainy season, stressing the need to monitor this period.
Our research did not differentiate fire types, which is an important element of determining fire containment measures. In many cases, fire is just a signal of deforestation (Armenteras-Pascual et al 2011); here, efforts should go on detecting and combating forest loss, not fire per se. Fire is often used by those who depend on it for their livelihood, consisting in these cases the only viable tool to guarantee food production. However, it is necessary to implement a fire calendar indicating allowed burning periods and how the practice should be carried out to reduce the risk of fires escaping into the remaining forests. At the same time, environmental enforcement must focus on the Critical Fire Periods, ensuring greater success in actions to curb illegal use of fire in agriculture. By defining these periods it is possible to make the best use of the scarce resources across Amazon countries (Suarez et al 2018, Levis et al 2020, Hope 2021), and would help them meet their commitments to reduce carbon emissions from forest degradation. Finally, to support decisions and policy makers, we provide a user-friendly interface with our results: https://amazonianfirecalendar.shinyapps.io/fire_amazon/.
5. Conclusion
In this study, we focused on clarifying how the dry and fire seasons are related in the Amazon. We show two key insights. First, by combining satellite-derived datasets of rainfall and active fires, we observed that the marked seasonality in the fire peaks was linked to the regional variation of the dry season end, which is consistent with the results of studies carried out on smaller scales in the northwest (Romero-Ruiz et al 2010, Armenteras-Pascual et al 2011), southeast (Brando et al 2016) and east (Alencar et al 2015) of the Amazon. This shows that assuming a single dry season for the entire Amazon is not suitable to characterize the fire occurrence. Second, our approach defines fire calendars for the Amazon, specifying different Critical Fire Periods. This could support policies and management interventions that target illegal agricultural fires, reduce deforestation and the subsequent burning, and support smallholders to develop fire-safe practices under changing climatic conditions. Further efforts are still needed to investigate the seasonality of each fire use and how extreme droughts influence their occurrence. However, the results achieved with this study already provide strategic information that can support decision makers in successful fire management plans and contingency actions.
Acknowledgments
This work was part of N S C 's PhD thesis and she thanks the Conselho Nacional de Desenvolvimento Científico e Tecnológico (CNPq 140379/2018-5) and the Coordenação de Aperfeiçoamento de Pessoal de Nível Superior- CAPES-PrInt/Research and Development in Tropical Meteorology for the scholarships granted. This study was also financed in part by CAPES – Finance Code 001. L O A thanks the MAP-Fire project (IAI—SGP-HW 016), Fundação de Amparo à Pesquisa do Estado de São Paulo (FAPESP, 2020/08916-8, 2016/02018-2), CNPq (441949/2018-5, 442650/2018-3, productivity scholarship: 314473/2020-3). C A N thanks CAPES (88887.469205/2019-00). A C M P thanks CNPq (140877/2018-5). C S J thanks CAPES (Code 001). J B C R thanks MAP-FIRE project (IAI—SGP-HW016). J B & E B thank the BNP Paribas Foundation's Climate and Biodiversity Initiative (Project Bioclimate), and CNPq-CAPES; Prevfogo-IBAMA 441949/2018-5 [Sem-Flama]). L E O C A thanks CNPq (productivity scholarship: 314416/2020-0).
Data availability statement
The data that support the findings of this study are available upon reasonable request from the authors.
Conflict of interest
Authors declare no competing interests.