

Abstract
Launched on 1 January 2021, the African Continental Free Trade Area (AfCFTA) aims to bring together 1.3 billion people in a US$3.4 trillion economic bloc. The World Bank estimates that the AfCFTA could lift tens of millions of people out of poverty by 2035. Previous studies have shown that an increase in annual mean temperature can significantly affect economic growth. The AfCFTA economy will therefore be affected by future warming. However, without the AfCFTA, the impact of the increased annual average temperature on local economies could be severe, further depriving low-income African countries of economic recovery. To assess the damage to regional economic growth caused by future warming, trend analyses are conducted in the aggregated historical CFSR/NCEP and CMIP6 (GFDL-ESM4) climate projection data from 1979 to 2100 for different emission pathways over some major continental economic centres. The long-term impact of surface temperature increase on gross regional product (GRP) per capita growth rates are investigated by fitting CMIP6 daily and annual mean temperatures to a log-polynomial regression model. The results show that an increase in annual mean temperature will significantly affect the economic growth of low latitude and altitude regions compared to high latitude and altitude regions. Most emerging African economies and many member states of the African Union and AfCFTA are located in this low latitude zone. This makes the economies of the newly created AfCFTA very vulnerable to climate change. Several studies suggest that FTAs can help reduce the economic vulnerability of developing countries. The results presented here can contribute to better design and implementation of economic, trade and climate policies in the AfCFTA to mitigate the economic impacts of future warming.
Export citation and abstract BibTeX RIS

Original content from this work may be used under the terms of the Creative Commons Attribution 4.0 license. Any further distribution of this work must maintain attribution to the author(s) and the title of the work, journal citation and DOI.
1. Introduction
The African Continental Free Trade Area (AfCFTA) was established in 2018 through the African Continental Free Trade Agreement under the banner of African Union. It finally came into force on 1 January 2021 after being delayed by several months due to the COVID-19 crises [1–5]. The AfCFTA is expected to bring together 1.3 billion people in a $3.4 trillion economic bloc. A successful AfCFTA will make it the largest free trade bloc in terms of the number of participating countries (54) since the creation of the World Trade Organization. The World Bank estimates that AfCFTA could lift tens of millions of people out of poverty by 2035 [1]. Free trade areas [6–8] are accompanied by the removal of tariff and non-tariff barriers to the movement of goods across borders, which facilitates local firms' access to foreign inputs, thereby increasing business productivity. Free trade areas also increase competition among local firms, which boosts production and facilitates the movement of labor and goods from one region to another. As a result, living standards increase. Chen et al [9] examined the long-run relationship between tariffs and economic growth in a two-country growth model (AK) and found that a sufficiently high tariff can increase or decrease economic growth and depends on the level of productivity coefficients in both countries. Handley et al [10] examined the impact of 2018–2019 U.S. import tariff increases on U.S. export growth through the lens of supply chain linkages. They found that declining export growth is associated with rising import tariffs on some goods. Some studies have also shown that a smaller party in a trade agreement gains more from removing trade barriers and loses more by imposing them [11]. In general, the economies of countries that produce little to meet increasing demand can suffer from high tariffs on imported goods. Unlike the trade bloc European Union, which allows low tariffs and free movement of labor and capital, Africa still has very narrow borders that are burdened with high tariffs on cross-border goods. This could contribute to a slowdown in economic growth on the continent. In addition, the need to present immigration documents before entering a neighboring country has restricted the free movement of skilled labor on the continent. With the AfCFTA, we expect some new trade policies that can help boost economic activities on the continent. Apart from social factors such as political instability, religious and social differences, another important factor that can affect the AfCFTA economy is climate change.
Research on the socioeconomic impacts of climate change has grown rapidly in recent years [12–16]. In this decade (from 2010), Africa experienced an increase in the number of emerging economies, higher population density and industrialization, especially in coastal cities West Africa. Most of these emerging economies are located in the equatorial region of sub-Saharan Africa, with countries such as Ivory Coast, Kenya, Ethiopia, Rwanda and Tanzania on the list. Increasing industrialization and growing populations are leading to an increase in CO2 emissions and other greenhouse gasses from industry and automobiles. The 2016 Paris Agreement [17] reiterated the need for countries of the world to consider reducing global CO2 emissions by shifting their energy production and consumption to greener sources in order to keep the global temperature rise well below 2 ∘C. Observation has shown that African countries have so far done little to adhere to the Paris Agreement as fossil fuel combustion increases due to a growing number of motor vehicles and thermal power plants, population increases and urbanization increases, so regional average temperatures are expected to rise. These increasing anthropogenic contributions to global CO2 emissions have also been shown to be very unhealthy for the Earth's climate system [18–23] with the ability to amplify extreme weather events [24–28], which has severe physical and economic impacts [15, 29–37].
The impact of daily temperature variability on economic growth has been widely studied in the literature. Maximilian et al [38] examined the effects of daily temperature variability on economic growth and found that seasonally adjusted daily temperature variability reduces macroeconomic growth. Burke et al [39] analyzed the global nonlinear effects of temperature on economic output and found that aggregate economic productivity is nonlinearly related to temperature for all countries, with productivity peaking at an annual average temperature of 13 ∘C and declining sharply at higher temperatures. Matthias and Leonie [40] examined the impact of climate conditions on economic output using data from a global panel of regions. Using annual panel models, long-difference regressions, and cross-sectional regressions, they identified temperature effects on productivity levels and productivity growth. Moreover, they found robust evidence that temperature significantly affects productivity levels. Using a stochastic growth model in which labor productivity is affected by country-specific climate variables, Kahn et al [41] examined the long-term effects of climate change on economic activity in several countries. They found that real per capita output growth is affected by persistent changes in temperature above or below the historical norm. In Africa, Abidoye and Odusola [42] examined the empirical relationship between economic growth and climate change in Africa. Using annual data for 34 countries from 1961 to 2009, they found a negative impact of climate change on economic growth with a reduction in gross domestic product (GDP) growth of 0.67 percentage points for every 1 ∘C increase in temperature.
Following these interesting results, this paper is devoted to analyzing the long-run impact of climate change on Africa's regional economic growth rates and the resulting impact on the economy of the newly created African Continental Free Trade Area. I also attempt to examine which regional economies will be most affected by climate change. The rest of the paper is as follows: in section 2, I present the source of the historical and projected surface temperature data used, the model of the CMIP6 projection data used, the moving average method, and the log-polynomial regression model that relates GDP growth rates per capita to annual rolling mean temperature variability. In section 3, I discuss the results of my research and conclude in section 4.
2. Methods
2.1. Climate data
The climate projection data used in this study are the Climate Model Intercomparison Project (CMIP) Phase 6 (CMIP6) for the GFDL-ESM4 model from National Oceanic and Atmospheric Administration (NOAA) Geophysical Fluid Dynamics Laboratory (GFDL). These data were downloaded from the Potsdam Institute for Climate Impact Research (PIK) cloud database and can also be found online at Coupled Model Intercomparison Project Phase 6. The GFDL-ESM4 datasets run from 2015 to 2100 and are taken at a resolution of about 1∘ with 49 levels of comprehensive, interactive chemistry and aerosols from precursor emissions Earth System (ESM4). Three different CMIP6(GFDL-ESM4) datasets were analyzed for three different Shared Socioeconomic Pathways (SSPs) (ssp126, ssp370, and ssp585). The SSPs are different greenhouse gas emission scenarios that have been integrated into the CMIP6 climate models. They help to better understand how current levels of greenhouse gas emissions may affect future warming. The ssp126 is the emissions scenario with climate policy. ssp370 and ssp585 are emissions scenarios without climate policy to achieve climate targets.
The historical data are from the Climate Forecast System Reanalysis (CFSR) from the National Centers for Environmental Prediction (NCEP). This dataset ranges from 1979 to 2014 and can be accessed online at Global Weather Data for SWAT for any location on Earth with the coordinates provided. The data includes daily maximum and minimum temperatures. Because the CMIP6 data use daily mean surface temperatures, it was difficult to reconcile the daily mean maximum and minimum temperatures for high latitude countries with the mean daily temperatures from the CMIP6 data. This is because these high latitude regions have large seasonal temperature differences compared to low latitude countries. To address this issue, the maximum data from SWAT are considered and rescaled to fall below current temperatures. Therefore, the historical data used here are for reference only and have not been used to model projected GRP growth rates per capita.
The gross national product and national population data used to create figure 3 were obtained from the World Bank [43, 44]. The CMIP6 data (GFDL-ESM4) are in netCDF4 format, while the CFSR/NCEP data can be downloaded as a CSV file. For each dataset, surface temperature data (measured at 2 m above ground level) are extracted over some of the major economic centers in Africa (Lagos, Nairobi, Cape Town and Algiers) with specific longitude, latitude and altitude data. These cities were selected based on their significant contribution to their country's GDP and regional economy. The data is then fitted to mathematical models to conduct trend studies and economic impact.
2.2. Trend analysis
The method of moving averages has widely been used by scientists in all fields to analyze time-series data [45]. A moving average is commonly used with time series data to smooth out short-term fluctuations and highlight longer-term trends or cycles. Mathematically, let us consider a sequence of surface temperature data points  , an n-moving average is a new sequence
  defined from
  by taking the arithmetic mean of subsequences of n terms [45],
To capture trends in the data sets, the CFSR/NCEP data and the CMIP6 data are aggregated to get an idea of the historical and future trends in surface temperature taken at 2 m above ground level.
2.3. Long term climate impact on GRP per capita growth rate
Many regression models have been applied in the literature [33, 38–40, 46] to analyze the impacts of temperature variability on economic growth. In this work, to analyze long term economic impacts of elevated annual mean temperatures, a simplified form of the log-polynomial regression model is considered, which is similar to the one used in the paper by Burke et al [39] and discussed in Newell et al [47]. The model is given by,

where  is a 2nd degree polynomial function in the mean surface temperature ,
  are the GRP per-capita growth rates (in percent point), αi
and
are the GRP per-capita growth rates (in percent point), αi
and  i
are some constant and error terms respectively. They are usually referred to as the regional dummy variables which account for institutional and cultural differences between regions [38]. The full model is given by,
i
are some constant and error terms respectively. They are usually referred to as the regional dummy variables which account for institutional and cultural differences between regions [38]. The full model is given by,

where a and b are the coefficients of the linear and quadratic terms respectively, i stands for the data location and t for the time (day, year).
3. Results and discussion
3.1. Trend analysis
The impact of different emission pathways on future warming in the CMIP6 data is examined by calculating the number of days when daily maximum temperatures exceed 25 ∘C. The years 2020, 2050 and 2100 are considered. Figure 1: The top row refers to the ssp126 emissions scenario, the middle row refers to the ssp370 scenario, and the bottom row refers to the ssp585 scenario. This figure shows that in the equatorial region of sub-Saharan Africa, the number of days when daily maximum temperatures exceed 25 ∘C is much higher compared to high latitude regions, and this number is expected to increase further under emission scenarios ssp370 and ssp585. Therefore, this region is most vulnerable to climate change and is likely to suffer economic losses in the future compared to high latitude regions.
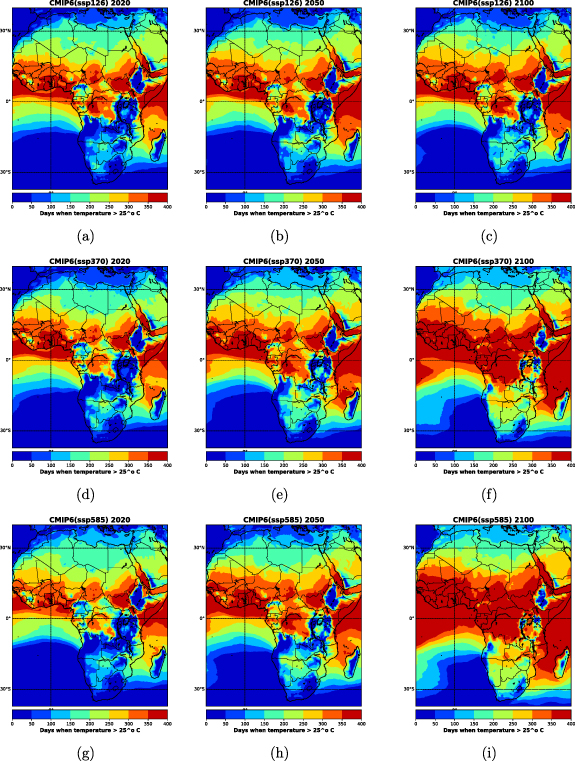
Figure 1. Future projection of the number of days when daily maximum temperatures exceeds 25 ∘C. The years 2020, 2050, and 2100 where considered for different emission pathways. Top row is for the emission scenario assuming climate protection measures are taken (ssp126), middle row is for ssp370 emission scenario and bottom row for ssp585 emission pathway. This figure shows the equatorial region of sub-Saharan Africa is most vulnerable to climate change and will likely suffer future economic losses compared to high latitude regions.
Download figure:
Standard image High-resolution imageFour megacities in different sub-climate regions (equatorial and semi-equatorial (Mediterranean and temperate)) were selected to study the trend of daily mean surface temperatures. Daily mean surface temperatures are then extracted from gridded CMIP6 data (GFDL-ESM4) over these cities with different latitudes and altitudes to investigate the effects of latitude and altitude differences on daily mean surface temperature trends. African countries generally have some form of quasi-centralised economies, with most coastal megacities contributing a significant share to the country's GDP. Based on this argument, Lagos, Nigeria, West Africa, a powerhouse of the Nigerian economy and the Economic Community of West African States (ECOWAS) with longitude = 3.406894, latitude = 6.446522 and an elevation of 26 m above sea level was selected. Other major cities in ECOWAS such as Accra and Abidjan have very similar mean surface temperatures. Similarly, Nairobi, Kenya, another major economic centre in East Africa, has longitude = 36.811673, latitude = −1.284469 and an elevation of 1668.0 m above sea level. The two megacities of Algiers (longitude = 3.070831, latitude = 36.691327 and elevation = 49 m above sea level) and Cape Town (longitude = 18.492373, latitude = −33.907693 and elevation = 16 m above sea level) in the extreme north and south of the continent with a completely different climate from the equatorial regions were also selected. Figure 2 shows the geographical location of the cities studied.
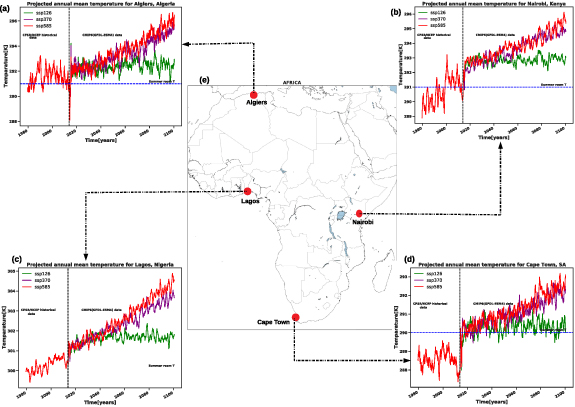
Figure 2. Projected annual rolling mean temperature for different emission pathways shows a steep increase for low latitude, low elevation equatorial regions as compared to high latitude, high elevation regions. Blue dash lines represent some threshold temperature which also stands for the average summer room temperature of the region (300 K for Lagos (c), 291 K for Nairobi (b), 290 K for Cape Town (d), and 291 K for Algiers (a)) while black dash lines separate the historical CFSR/NCEP from the CMIP6 projection data. (e) is the map of Africa showing the geographical locations of the cities under study. The time series were generated by making use of equation (1). Details about the figures are shown in supplementary figure 5.
Download figure:
Standard image High-resolution imageTo analyze trends in surface temperature data over Lagos, Nairobi, Cape Town and Algiers, their annual rolling mean surface temperatures in the aggregated historical CFSR/NCEP and CMIP6 (GFDL-ESM4) climate projection data over the selected cities are calculated from equation (1) and presented in figure 2. These regions have different threshold temperatures or summer room temperatures. The rates of increase in their mean surface temperatures relative to summer room temperatures are compared. Figure 2 shows a steep increase in annual moving average surface temperature for low-latitude, low-elevation equatorial regions relative to high-latitude, high-elevation regions. The blue dashed lines represent the average summer room temperature for the region (300 K for Lagos, 291 K for Nairobi, 290 K for Cape Town, and 291 K for Algiers), while the black dashed lines separate the historical CFSR/NCEP data from the CMIP6 projection data. It is also noteworthy that the projected increase in surface temperature in Nairobi (much closer to the equator but at a much higher altitude) shows a steady increase, while the temperature in Lagos (at sea level) shows an almost exponential increase.
3.2. Economic impact assessment
The effects of daily temperature variation on regional growth rates have been analyzed for all regions of the world and published online by Maximilian et al [38]. Here the effects of an additional degree of daily temperature variability on regional growth rates for Africa is presented in figure 3. From this figure, the reduction in regional growth rates per additional degree of daily temperature variability is larger in equatorial countries with smaller seasonal temperature differences than in high latitude regions with larger seasonal temperature differences. The size of the scatter plot indicates the country's population, using 2017 World Bank values, and the color indicates the country's average seasonal temperature difference. The list of African countries and their alpha-3 codes used in this figure (figure 3) can be found in supplementary table 1 (available online at stacks.iop.org/ERL/16/094046/mmedia). The 2020 GDP data from International Monetary Fund (IMF) (supplementary figure 1) show that most of the African countries with the highest GDP are located in the equatorial zone of Sub-Saharan Africa, which forms the backbone of the African continental free trade area. Rising annual mean temperatures and daily temperature fluctuations can significantly affect the AfCFTA economy when countries such as Nigeria, Kenya, Ghana, Ivory Coast and the Democratic Republic of Congo are severely affected. The daily mean surface temperature data for 2015 over the selected cities with different latitudes and altitudes are extracted and studied. A comparative study of the daily temperature variability and seasonal temperature differences across the different locations is equally done. Figure 4 shows that the daily temperature variability and seasonal temperature difference are higher in high latitude regions than in low latitude regions. We also note that the daily temperature variability is higher in Nairobi, which is at a higher altitude, than in Lagos at sea level.

Figure 3. The reduction in regional growth rates per extra degree of daily temperature variability is larger in equatorial countries with small seasonal temperature difference as compared to regions further from the equator. The size of scatter points indicates country population using 2017 values and the colour denotes the average seasonal temperature difference of the country. See Maximilian et al [38] for the global picture. The list of African countries and their alpha 3 codes used in this figure can be found in supplementary table 1.
Download figure:
Standard image High-resolution image
Figure 4. Daily temperature variability and seasonal temperature difference is higher in countries further from the equator as compared to equatorial countries. The CMIP6 data was used under ssp585 emission forcing for the year 2015. The dotted lines are the respective annual mean temperature. The coordinates of the various cities are as follows: Lagos' longitude = 3.406894, latitude = 6.446522 and elevation = 26 m above sea level. Nairobi's longitude = 36.811673, latitude = −1.284469, and elevation = 1668.0 m above sea level. For Capetown we have longitude = 18.492373, latitude = −33.907693 and elevation = 16 m above sea level and Algiers' longitude = 3.070831, latitude = 36.691327, and elevation = 49 m above sea level.
Download figure:
Standard image High-resolution imageTo assess the likely economic impact of this increase in mean surface temperature, daily mean surface temperatures from 2015 to 2100 over Lagos, Nairobi, Cape Town and Algiers are fitted to a log-polynomial regression model shown in equation (3). A comparative study is carried out to examine the contribution of latitude and altitude on the growth rates of GRP per capita. In figure 5 and supplementary figures 2–4, the daily and annual mean temperatures are fitted to the log-polynomial regression model with regression parameters from Burke et al [39] for the different emission scenarios. Figure 5 (top row) shows log(GRP) growth rates per capita plotted against annual mean temperatures. The middle row shows the density plots of observed data and the bottom row shows the density plots of log(GRP per capita growth rates). This figure shows that regions at higher latitudes and elevations with greater daily temperature variability and seasonal temperature differences exhibit a nonlinear relationship between log(GRP) per capita growth rates and temperature, with an increase in economic growth followed by a decrease at temperatures above 290 K, while regions at low latitudes and elevations exhibit a quasi-linear relationship between log(GRP) per capita growth rates and temperature, with a large decrease in economic growth. CMIP6 data were used under the ssp370 emission forcing. The percentage point change in log(GRP) and the change in marginal growth rates of these cities compared to the baseline (ssp126) are shown in figures 6(a)–(e). Here, Lagos shows a much larger (more negative) percentage change in log(GRP), followed by Kenya, while Algiers shows no significant change with increasing annual mean temperatures. While figure 6(e) shows that Lagos at low latitude and altitude will experience a very small (negative) marginal change in growth rate compared to Nairobi, Algiers and Cape Town at higher latitude and altitude under future warming. The calculated values of median change in log(GRP) are given in table 1.
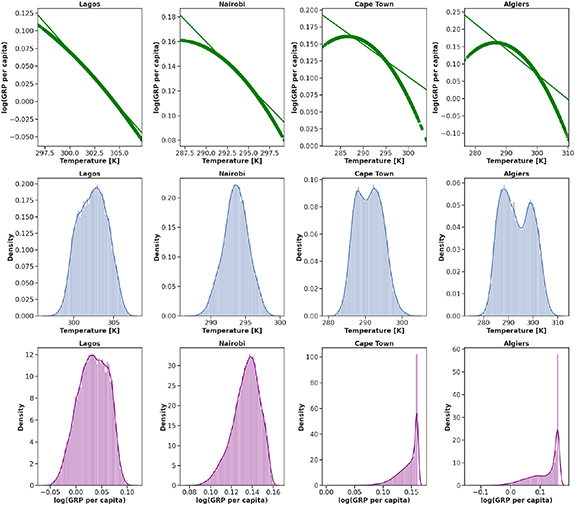
Figure 5. The relation between log(GRP per capita) and daily mean temperatures aggregated from 2015 to 2100 (top row) with regression parameters taken from Burke et al [39]. Middle row are the observation data density plots and bottom row the log(GRP per capita growth rates) density plots. This figure shows, higher latitude, higher altitude regions with larger seasonal temperature difference have a non-linear relation between log(GRP per capita growth rates) and temperature with an increase in economic growth followed by a decline for temperatures above 290 K while low latitude, low altitude regions show a quasi-linear relation between log(GRP per capita growth rates) and temperature with a sharp decline in economic growth. The CMIP6 data was used under ssp370 emission forcing.
Download figure:
Standard image High-resolution image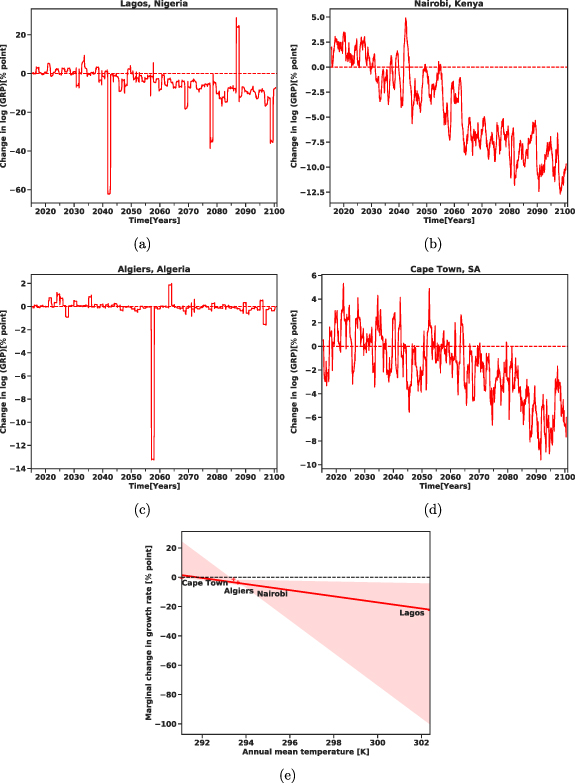
Figure 6. Projected change in log(GRP) for ssp370 emission scenario relative to the baseline state(ssp126 pathway) for Lagos (a), Nairobi (b), Algiers (c), and Cape Town (d). The marginal change in growth rates (e) shows low latitude, low altitude regions have smallest marginal change in growth rate relative to the baseline state under increasing annual mean temperature. The computed values are given in table 1.
Download figure:
Standard image High-resolution image
Table 1. Summary table of the data used and parameter values.
| Regions | |||||
|---|---|---|---|---|---|
| Parameters | Lagos | Nairobi | Cape Town | Algiers | |
| Location | Longitude | 3.406894 | 36.811673 | 18.492373 | 3.070831 |
| Latitude | 6.446522 | −1.284469 | −33.907693 | 36.691327 | |
| Elevation | 26 m | 1668.0 m | 16 m | 49 m | |
| CMIP6 ssp126 | Mean | 301.63 | 292.8 | 290.3 | 292.37 |
| Temp data (K) | std | 1.555 | 1.574 | 3.5 | 6.08 |
| Min | 296.65 | 287.03 | 280.55 | 296.50 | |
| 25% | 300.30 | 291.72 | 287.45 | 287.27 | |
| 50% | 301.78 | 292.94 | 290.25 | 291.77 | |
| 75% | 302.87 | 294.0 | 292.98 | 297.76 | |
| Max | 305.40 | 297.45 | 302.51 | 307.67 | |
| CMIP6 ssp370 | Mean | 302.39 | 293.63 | 291.07 | 293.43 |
| Temp data (K) | std | 1.79 | 1.79 | 3.57 | 6.2 |
| Min | 296.77 | 286.91 | 280.9 | 276.54 | |
| 25% | 300.99 | 292.45 | 288.17 | 288.18 | |
| 50% | 302.42 | 293.65 | 291.05 | 292.93 | |
| 75& | 303.74 | 294.86 | 293.78 | 298.76 | |
| Max | 307.26 | 299.22 | 303.97 | 310.19 | |
| CMIP6 ssp585 | Mean | 302.64 | 293.8 | 291.25 | 293.7 |
| Temp data (K) | Std | 1.915 | 1.86 | 3.610 | 6.30 |
| Min | 296.88 | 287.4 | 281.05 | 278.34 | |
| 25% | 301.2 | 292.58 | 288.32 | 288.42 | |
| 50% | 302.59 | 293.93 | 291.26 | 293.1 | |
| 75& | 304.07 | 295.135 | 293.37 | 298.96 | |
| Max | 308.20 | 300.18 | 304.25 | 311.96 | |
| Model parameters | a | 0.137 | 0.137 | 0.137 | 0.137 |
| b | −0.0005 | −0.0005 | −0.0005 | −0.0005 | |
| α | 0.07 | 0.07 | 0.07 | 0.07 | |
| Change in log(GRP) | Median | −22.67 | −3.50 | −0.60 | −1.28 |
The results indicate that the economic impact of the increase in regional average temperature will be felt most by countries in the equatorial region of sub-Saharan Africa, with countries such as Nigeria, Kenya, Ghana, Ivory Coast, Cameroon, the Democratic Republic of Congo and Somalia being the most vulnerable compared to high latitude countries such as Algeria, South Africa and other high latitude countries such as Morocco, Egypt, Tunisia and Botswana. Supplementary figure 1 shows that these low latitude countries form the foundation of the AfCFTA when their total GDP is added together, implying that the future increase in global mean surface temperature will significantly affect the AfCFTA economy. The AfCFTA agreement initially requires members to eliminate tariffs on 90% of goods. The United Nations Economic Commission for Africa estimates that this agreement will increase intra-African trade by  by 2022. This means that effective regional trade policies can help mitigate future declines in regional economic growth due to climate change.
4. Conclusion
The AfCFTA was established on 1 January 2021 to accelerate regional development and economic growth. It has been shown that an increase in annual mean temperature can significantly affect economic growth. Researchers have also found that the economies of low-income countries, such as sub-Saharan Africa, will be severely affected by a projected increase in annual mean temperature and daily temperature fluctuations. This will further discourage these low-income African countries from economic recovery. To estimate the damage inflicted on regional economic growth by future warming, trends in aggregate historical CFSR/NCEP data and CMIP6 (GFDL-ESM4) climate projection data from 1979 to 2100 are examined for various emission pathways over some major continental economic centers. The impact of increased surface temperature on gross regional product (GRP) per capita growth rates is examined by fitting daily and annual mean temperatures to a log-polynomial regression model. From the analysis, it is found that an increase in annual mean temperature significantly affects the economic growth of low-latitude and high-altitude regions compared to high-latitude and high-altitude regions. The economic growth of equatorial countries such as Nigeria, Kenya, Ghana, Ivory Coast, Cameroon, Democratic Republic Congo, Somalia, etc could suffer more from future warming than that of high latitude countries such as Algeria, South Africa, Morocco, Egypt, Tunisia and Botswana. These low-latitude countries, with their combined GDP, form the basis of the AfCFTA. A future increase in global mean surface temperature will significantly affect the economies of the newly created AfCFTA. The removal of trade barriers has been shown to reduce the economic vulnerability of developing countries. Moreover, recent studies have shown that a smaller party in a trade agreement gains more from the removal of trade barriers than it loses from their introduction. Therefore, to mitigate future declines in regional economic growth due to climate change, bilateral trade policies that allow low tariffs on goods that cross international borders are recommended. This will promote competition and reduce regional monopolies. This policy could also help boost the economic activities of countries with low economic performance to meet rising demand. In addition, the AfCFTA agreement requires members to eliminate tariffs on 90% of goods. The United Nations Economic Commission for Africa estimates that this agreement will increase intra-African trade by 52% by 2022. This underscores that effective regional trade policies can help mitigate future declines in regional economic growth due to climate change. There is also a greater need for other climate change mitigation measures in the region, such as providing cheaper and cleaner energy for household cooling.
Acknowledgments
This research has received funding from the International Climate Protection (ICP) Fellowship Program of the Alexander von Humboldt (AvH) Foundation and the German Federal Ministry of Education and Research (BMBF) under the research Projects CLIC (FKZ: 01LA1817C) and SLICE (FKZ: 01LA1829A).
The author will like to thank the Ministry of Higher Education of Cameroon for the financial support in the form of research allowances for State University lecturers.
The author will also want to thank the members of the Department of Complexity Sciences of the Potsdam Institute for Climate Impact research (PIK) in Potsdam, Germany for their immense material support during the time spent there.
Data availability statement
The data that support the findings of this study are available upon reasonable request from the authors.
Author contributions
N A A design the project, carried out the experiment, and wrote the paper.
Conflict of interest
The author declare that there is no competing interests.