


Abstract
Active layer thickness (ALT) is a critical metric for monitoring permafrost. How soil moisture influences ALT depends on two competing hypotheses: (a) increased soil moisture increases the latent heat of fusion for thaw, resulting in shallower active layers, and (b) increased soil moisture increases soil thermal conductivity, resulting in deeper active layers. To investigate their relative influence on thaw depth, we analyzed the Field Measurements of Soil Moisture and Active Layer Thickness (SMALT) in Alaska and Canada dataset, consisting of thousands of measurements of thaw depth and soil moisture collected at dozens of sites across Alaska and Canada as part of NASA's Arctic Boreal Vulnerability Experiment (ABoVE). As bulk volumetric water content (VWC) integrated over the entire active layer increases, ALT decreases, supporting the latent heat hypothesis. However, as VWC in the top 12 cm of soil increases, ALT increases, supporting the thermal conductivity hypothesis. Regional temperature variations determine the baseline thaw depth while precipitation may influence the sensitivity of ALT to changes in VWC. Soil latent heat dominates over thermal conductivity in determining ALT, and the effect of bulk VWC on ALT appears consistent across sites.
Export citation and abstract BibTeX RIS
1. Introduction
Permafrost is ground that remains at or below 0 °C for two or more consecutive years. Permafrost underlies approximately 80% of the land surface of Alaska (Jorgenson et al 2008) and 24% of the Northern Hemisphere (Zhang et al 1999, 2000). Permafrost includes bedrock, ice, mineral soil, and twice as much carbon as the atmosphere in the form of frozen organic matter (Hugelius et al 2014). As permafrost thaws, this organic matter will also thaw and decay, emitting carbon dioxide and methane into the atmosphere, amplifying the warming already caused by anthropogenic emissions (Zimov et al 2005, Schuur et al 2008, Schaefer et al 2011, 2014). Thaw can additionally cause the ground to subside, damaging buildings and other infrastructure. Permafrost temperatures have increased since the 1980s (Biskaborn et al, 2019), and permafrost has begun to thaw as a result (Zhang and Stamnes 1998, Smith et al 2001, Schuur et al 2008, Turetsky et al 2020).
The active layer is the layer of ground above permafrost that thaws in the summer and refreezes in winter. The active layer thickness (ALT) is defined as either the maximum thaw depth at the end of the summer thaw season or the maximum depth of the 0 °C isotherm (Schaefer et al 2011). The World Meteorological Organization has identified ALT as an essential climate variable to monitor the status of permafrost (Michaelides et al 2019). Air temperature variations as the seasons wax and wane exert the strongest control on ALT (Zhang and Stamnes 1998, Wang et al 2018). However, ALT also depends upon the physical and thermal characteristics of the land surface that modulate the flow of energy into and out of the soil. Snow insulates the soil in winter, resulting in ground temperatures 3 °C–4 °C warmer than the air temperature (Zhang et al 2005). Moss insulates the soil in summer, resulting in shallower active layers (Nakano and Brown 1972, Hinzman et al 1991, Rocha and Shaver 2011). Snow and vegetation cover, along with topography, underground water flow, surface water bodies, soil properties, soil organic matter content, and fire history all influence soil thermodynamic properties, and thus ALT (Woo 2012, Zipper et al 2018).
Soil moisture content in particular strongly influences the soil thermodynamic characteristics (Schaefer et al 2009). Water has a high heat capacity, high latent heat of fusion, and high thermal conductivity, and ice has a thermal conductivity 3–4 times that of liquid water (Nakano and Brown 1972, Hinkel et al 2001). Soil moisture is quantified as volumetric water content (VWC), defined as the volume of water divided by the total volume of soil. VWC depends on soil porosity, grain size, and organic matter, and some portion of the water in the voids between grains stays unfrozen even at temperatures of −10 °C to −20 °C (Romanovsky and Osterkamp 2000, Ling and Zhang 2004). Vegetation plays a multifaceted role from buffering water runoff to insulating the soil from changing air temperatures (Genxu et al 2008). VWC determines the soil heat capacity and thermal conductivity, influencing the flow of energy into and out of the soil, and thus ALT and ground temperature (Romanovsky and Osterkamp 2000, Wang et al 2020).
The influence of VWC on soil thermodynamic properties raises the question: will wetter soils result in deeper or shallower active layers? The Stefan equation governing the thaw of frozen soil indicates both thermal conductivity and latent heat of fusion control thaw depth (Walvoord and Kurylyk 2016, French 2017). One hypothesis, based on thermal conductivity, suggests that increased soil moisture would facilitate increased energy flow into the soil and thus result in a deeper active layer. Observations and numerical modeling showing thaw bulbs below stream beds and shallower active layers in drained Siberian floodplains support this hypothesis (Nakano and Brown 1972, Bradford et al 2005, Kwon et al 2016). The alternate hypothesis, based on the high heat capacity of water and the latent heat of fusion, suggests frozen soils with high ice content would require more energy to thaw, resulting in a shallower active layer. Observations and modeling indicating wetter soils tend to have shallower active layers support this hypothesis (Carey and Woo 1998, Zhang et al 2005). If thermal conductivity exerts greater control on ALT, water would conduct more heat into the soil and we would expect to see deeper active layers in wetter soils. If latent heat exerts greater control, the ice content would require more energy to melt, and we would expect shallower active layers in wetter soils. In this paper, we analyze simultaneous measurements of thaw depth and soil moisture throughout Alaska to determine which hypothesis best describes the influence of VWC on ALT.
2. Methods
2.1. Field Measurements of Soil Moisture and Active Layer Thickness (SMALT) in Alaska and Canada dataset
Understanding how soil moisture controls active layer thermodynamics requires coincident measurements of VWC and ALT. NASA's Arctic Boreal Vulnerability Experiment (ABoVE) field campaign produced a Field Measurements of Soil Moisture and Active Layer Thickness (SMALT) in Alaska and Canada dataset synthesizing thousands of thaw depth and VWC measurements to validate remotely sensed ALT and soil moisture (Schaefer et al 2015, Schaefer et al 2021, Michaelides et al 2019). SMALT consists of ∼350 000 data records from over 100 sites made by multiple research teams from 2009 to 2019 (figure S1 (available online at stacks.iop.org/ERL/16/055028/mmedia)). The SMALT includes isolated measurements made at individual research sites as well as transect surveys totaling ∼50 km across Alaska (Chen et al 2016, Jafarov et al 2017, Wilson et al 2018). The primary measurements in the SMALT dataset are thaw depth, VWC, and soil dielectric permittivity. The ancillary data include measurement method, date, and geospatial coordinates (table S1).
2.2. Data collection
SMALT includes 206 000 observations of ALT measured using either mechanical probing (6.0%) or ground penetrating radar (GPR) (94.0%). The teams typically made their measurements in August and September, near the end of the thaw season. We assume thaw depth measured in August and September represents an acceptable approximation of ALT. The rate of change of thaw depth slows late in the season and the difference between the August thaw depth and the final ALT is ∼6%, depending on latitude and vegetation cover (Boike et al 1998, Zhang and Stamnes 1998, Hinkel et al 2001, Michaelides et al 2019). Mechanical probing entails pressing a graduated T-shaped rod into the ground until it hits the permafrost table (figure S2). The mechanical probe measures the thaw depth with an uncertainty of 3 cm (Schaefer et al 2015, Chen et al 2016).
For GPR measurements, the transmitting antenna emits a pulse at a center frequency of 500 MHz that travels downwards through the active layer and reflects off the permafrost table (Schaefer et al 2015, Chen et al 2016, Jafarov et al 2017). The receiver measures the two-way travel time (TWTT) as the time from the transmitter to the permafrost table and back (figure S3). The teams pulled the GPR antenna along the ground to acquire multi-kilometer transects with a pulse frequency of ∼3 Hz, which results in a typical average spacing of ∼0.3 m. Because of rough surface topography, due mainly to tussocks, not every pulse resulted in a useable reflection, so SMALT includes ∼140 000 GPR records with neither ALT nor VWC. Every few minutes, the teams measured thaw depth with a mechanical probe as calibration points to convert the TWTT into wave velocity. The calibration points give an average wave velocity for a site or region to convert all the TWTT to thaw depths. The standard deviation of wave velocity at each site represents the uncertainty in thaw depth, with a typical thaw depth uncertainty of ∼20% (Chen et al 2016).
The SMALT includes 16 000 VWC measurements collected by GPR (22.1%), Hydrosense I and II probes (75.3%), and DualEM (2.6%). For the GPR measurements of VWC, we divide thaw depth by the TWTT to get a wave speed as a measure of soil dielectric permittivity:

where  is the soil dielectric permittivity (−), v is the wave speed (m s−1), and C is the speed of light in a vacuum (2.998 × 10⁸ m s−1). The Hydrosense I and II instruments consist of a pair of metal rods of three lengths, 6, 12, and 20 cm, pushed into the soil to measure soil dielectric permittivity (figure S4). The DualEM measures electrical resistivity in the soil (figure S5). All three methods use empirical petrophysical transforms based on laboratory measurements to convert to VWC. The GPR measurements used the Engstrom et al (2005) petrophysical transform and most of the Hydrosense data used the Topp et al (1980) transform (figure S6). Some teams developed site specific petrophysical transforms based on locally collected soil samples. The DualEM data used the petrophysical transform of Yu and Drnevich (2004) and Drnevich et al (2008). All VWC measurements represent an average value over the depth reached by the instrument used (Bourgeau-Chavez et al
2010). The Hydrosense measurements represent the average VWC of the surface soil to a depth of either 6, 12, or 20 cm, depending on the probe length used, which we call surface VWC. The VWC measurements from GPR and DualEM represent the average water content over the entire active layer, which we call the bulk VWC.
is the soil dielectric permittivity (−), v is the wave speed (m s−1), and C is the speed of light in a vacuum (2.998 × 10⁸ m s−1). The Hydrosense I and II instruments consist of a pair of metal rods of three lengths, 6, 12, and 20 cm, pushed into the soil to measure soil dielectric permittivity (figure S4). The DualEM measures electrical resistivity in the soil (figure S5). All three methods use empirical petrophysical transforms based on laboratory measurements to convert to VWC. The GPR measurements used the Engstrom et al (2005) petrophysical transform and most of the Hydrosense data used the Topp et al (1980) transform (figure S6). Some teams developed site specific petrophysical transforms based on locally collected soil samples. The DualEM data used the petrophysical transform of Yu and Drnevich (2004) and Drnevich et al (2008). All VWC measurements represent an average value over the depth reached by the instrument used (Bourgeau-Chavez et al
2010). The Hydrosense measurements represent the average VWC of the surface soil to a depth of either 6, 12, or 20 cm, depending on the probe length used, which we call surface VWC. The VWC measurements from GPR and DualEM represent the average water content over the entire active layer, which we call the bulk VWC.
For this analysis, we used 7499 data records from SMALT with simultaneous observations of ALT and VWC from 48 different sites (figure 1). We originally extracted 8721 records, but removed 544 data records made in May when the thaw depth measured by mechanical probing does not reasonably represent ALT. We also removed 59 data records with unrealistic VWC values greater than 1.00 cm3 cm−3 (figure S6). Lastly, we averaged the VWC measurements for those sites where researchers took one thaw depth measurement and many closely spaced VWC measurements. This resulted in 7499 records of simultaneous ALT and VWC observations measured in mid to late August from 2013 to 2018. The VWC measurements for these records consist of DualEM transects (5.5%), GPR calibration points (47.4%), and Hydrosense probes (47.1%). Almost all ALT measurements come from mechanical probing (90.2%), with the remaining 9.8% from GPR. Summary metrics for each site, including average latitude, longitude, and number of data records, can be found in table S2.
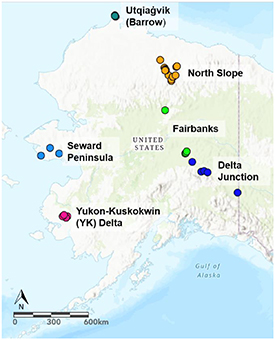
Figure 1. Sites from the SMALT with simultaneous measurements of ALT and VWC used in this study. The colors represent how we grouped the data into regions for statistical analysis. See figure S1 for a map of all sites in SMALT.
Download figure:
Standard image High-resolution imageBecause the number of observations per site varied widely, from 2 to 597, we combined data from multiple sites into groups based roughly on region and vegetation (figure 1). The Utqiaġvik (Barrow) sites lie on the Arctic coastal plain, which consists of drained thermokarst lakes and open tundra covered with grass, moss, and lichen. The North Slope sites cover hilly areas of glacial debris covered with tussocks and moss. The Fairbanks sites all lie in the boreal forest zone, typically in open meadows of tussocks and moss surrounded by wooded areas of black spruce and shrubs. We grouped the Coldfoot site just south of the Brooks Range with the Fairbanks sites because of the similarity in vegetation and surface characteristics. The Delta Junction sites also occur in the boreal forest zone, but all lie in landscapes dominated by the dynamics of the Tanana River. The Yukon-Kuskokwin (YK) Delta consists of raised peat plateaus covered by grass, moss, and lichen separated by sunken thermokarst gulleys, wetlands, and lakes. The Seward Peninsula sites lie in narrow valleys covered in sedge grass, moss, and lichen surrounded by mountains.
2.3. Data analysis and statistics
We studied ALT as a function of VWC using scatterplots and linear regressions. The data showed large variability resulting from many factors known to influence ALT and VWC, such as air temperature, precipitation, surface vegetation, soil bulk density, organic layer thickness, etc. Because of the natural background variability in the data due to all these factors, we used two-dimensional (2D) probability density functions (PDFs) to isolate the relationship between VWC and ALT (Schuster et al 2018). To create the 2D PDFs, we divided VWC and ALT into bins of equal and finite width using Scott's Normal Reference Rule (Scott and Kosar 2015) and counted the number (frequency) of data points in each bin. For each VWC bin, we identified the ALT bin with the most points, representing the highest probability ALT. Using the center coordinates of the highest probability ALT bins creates a new scatterplot with greatly reduced variability, termed the highest probability plot. We then calculated new linear regressions using the highest probability ALT. We tested the statistical significance of all linear regressions using a two-tail Student's t-Test at a 95% confidence interval (p = 0.05). A statistically significant relationship means the slope of the linear regression is significantly non-zero over the 95% confidence interval.
We subdivided the data by the depth range of the VWC measurements and by region, repeating the 2D highest probability analysis for each subset. Subdividing by the probe depth isolates the effects of VWC as a function of depth within the active layer. We defined four groups: VWC in the top 6 cm of soil, VWC in the top 12 cm of soil, VWC in the top 20 cm of soil, and bulk VWC for the entire active layer. SMALT included only 54 data records of VWC in the top 6 cm of soil, too few to perform the 2D highest probability analysis (figure S7). To isolate any regional differences, we created six groupings based on geographical area as identified in figure 1.
We calculated the energy required to melt the ice of the entire active layer using the latent heat of fusion from ice to water. We used the following equation

where Q is the energy required to melt the ice in the entire active layer per unit area, given by the footprint of the instrument used (J cm−2), ρ is the density of water at 0 °C (0.9999 g cm−3), and Lf is the latent heat of fusion for water (334 J g−1) (Tro et al 2019). We assume the soil temperature stays close to 0 °C during thaw such that the density of water stays constant. The energy equation combines ALT and VWC and serves as an additional way to isolate a relationship between the two in data with high background variability. We used the bulk VWC from the GPR and DualEM measurements since they represent the average soil moisture over the entire active layer, which allowed us to calculate the total water in the soil column per unit area.
We calculated the average summer air temperature and total summer precipitation for each site using version 4 of the Daymet product (Thornton et al 2020). We extracted daily average temperature and precipitation of the Daymet 1 × 1 km2 tile corresponding to each site. We focused on the summer thaw season of June, July, and August corresponding to the year of the ALT and VWC measurements. For each site, we calculated average summer air temperature and total summer precipitation from 1 June to 31 August. Heavier spring precipitation increases ALT, but we did not account for the differences in the timing of spring between the southern and northern sites (Neumann et al 2019). To normalize for the differing number of records per site in the regional analysis, we used a weighted average based on the percentage of the total number of data records per site (table S3).
3. Results
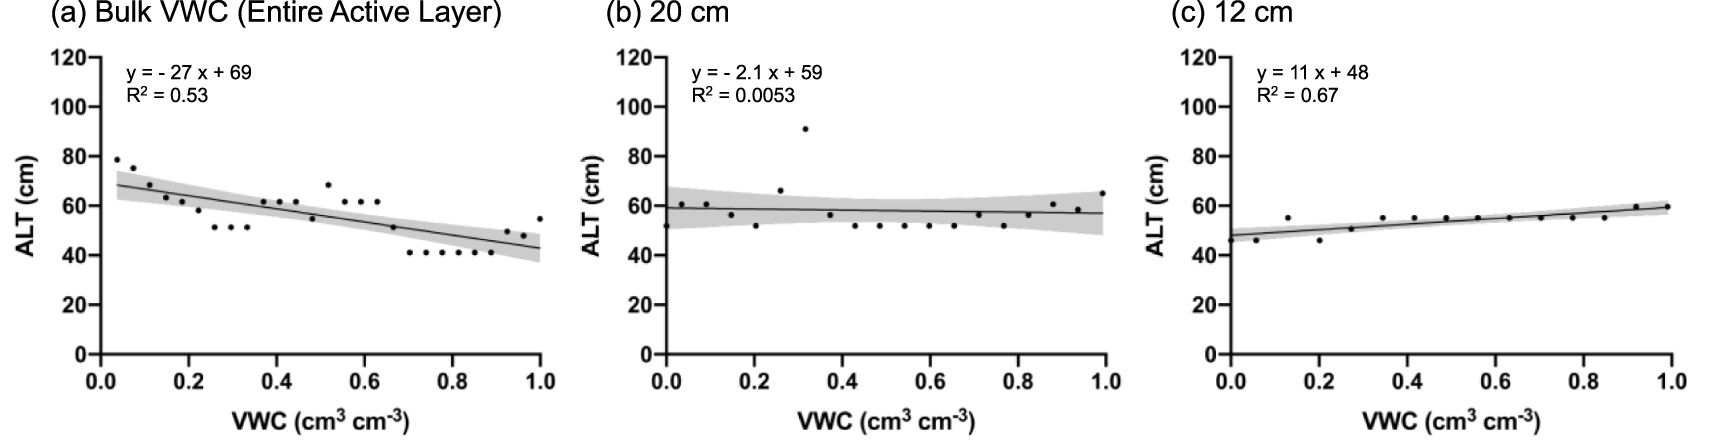
A scatterplot and linear regression of all data indicate ALT decreases as VWC increases (figure 2(a)). The low R2 for the scatterplot reflects the variability in the data due to the many other factors that influence ALT and VWC. Nevertheless, because of the large number of data points, the slope of the scatterplot regression is statistically significant (p = 0.05). The 2D PDF (figure 2(b)) shows strong, unimodal peaks for both ALT and VWC. ALT peaks from 40 to 70 cm and VWC peaks from 0.45 to 0.65 cm3 cm−3 (figure S8). A linear regression of the highest probability plot (figure 2(c)) shows a more gradual slope and a slightly higher R2 than the scatterplot, but the slope is not statistically significant (p = 0.05). The overall negative slope of ALT with VWC indicates ALT decreases as soil moisture increases, supporting the latent heat hypothesis, but the evidence is not strong enough to be conclusive.

Figure 2. ALT as a function of VWC for all data shown as a scatterplot (a), 2D PDF (b), and highest probability plot (c). The grey shading around the linear regressions represents the 95% confidence interval of the regression. Table S4 shows the full regression equations and statistics.
Download figure:
Standard image High-resolution imageThe relationship between ALT and VWC appears to change depending on the depth of the VWC measurement. ALT showed a statistically significant, negative correlation with bulk VWC, defined as the average VWC over the entire active layer (figure 3(a)). ALT showed no statistically significant relationship with VWC in the top 20 cm of soil (figure 3(b)). However, ALT showed a statistically significant, positive correlation with VWC in the top 12 cm of soil (figures 3(c) and S9). The statistically significant, negative correlation between ALT and bulk VWC supports the latent heat hypothesis while the statistically significant, positive correlation between ALT and 12 cm VWC supports the thermal conductivity hypothesis.
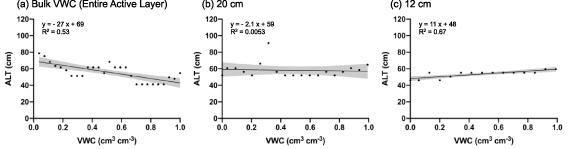
Figure 3. Highest probability plots of ALT as a function of VWC, separated by the averaging depth for the VWC measurements. The grey shading indicates the 95% confidence interval of the regression. Scatterplots and 2D PDFs for this analysis can be found in figure S9.
Download figure:
Standard image High-resolution imageThe energy required to thaw the active layer increases with bulk VWC (figure 4). Higher ice content requires more energy to thaw, and thus would not thaw as deeply as drier soils. The higher probabilities for VWC between 0.45 and 0.65 cm3 cm−3 mirror the unimodal distribution of VWC (figure S8). The distribution of the energy required widens as VWC increases, reflecting the many other factors that influence VWC and ALT. Nevertheless, the statistically significant relationship between energy to thaw the active layer and bulk VWC supports the latent heat hypothesis.

Figure 4. 2D PDF of bulk VWC and the energy required to thaw the entire active layer per unit area, given by the footprint of the instrument used. Scatterplot and highest probability plot can be found in figure S10.
Download figure:
Standard image High-resolution imageEach region shows a statistically significant, negative correlation between ALT and bulk VWC (figure 5). The Seward Peninsula region did not contain any bulk VWC data records. ALT showed no statistically significant relationship with 12 cm and 20 cm VWC for any region, with the exception of Delta Junction 12 cm VWC and Seward Peninsula 20 cm VWC. We see similarities and differences between the regional slopes and y-intercepts in figure 5. The slopes for the Fairbanks and North Slope regions are statistically identical (p = 0.05), as are the slopes for YK Delta and Utqiaġvik. The y-intercept values of the North Slope, Fairbanks, and YK Delta regions are statistically identical as well (p = 0.05). The slope and y-intercept for Delta Junction does not match any other region. The statistically significant, negative correlations between ALT and bulk VWC support the latent heat hypothesis, but with clear regional differences.
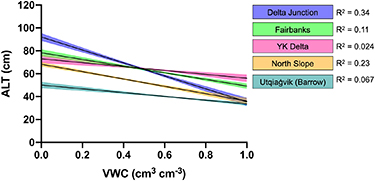
Figure 5. The linear regression from the plot of bulk VWC and ALT for each location grouping (figure 1). The colored shading indicates the 95% confidence interval of each linear regression. All regressions are statistically significant (p = 0.05). Scatterplots for each location can be found in figure S11. The Seward Peninsula region did not contain any bulk VWC data records.
Download figure:
Standard image High-resolution imageDifferences in average summer temperature and total summer precipitation can help explain these regional differences in ALT as a function of bulk VWC (figure 6). The y-intercepts for the different regions show a statistically significant, positive correlation with average summer temperature, indicating higher temperatures result in deeper active layers. The y-intercept also shows a statistically significant, positive correlation with total summer precipitation, indicating increased summer precipitation results in deeper active layers (figure S12). However, this may result from the fact that total summer precipitation also shows a statistically significant, positive correlation with average summer temperature, indicating precipitation may represent a confounding variable. We saw no statistically significant relationship between average summer temperature and regional slope (not shown). However, slope shows a negative correlation with summer precipitation, indicating active layer thaw becomes less sensitive to precipitation as precipitation increases, but this relationship is not statistically significant.

Figure 6. (a) The ALT y-intercept from the regional groupings created in figure 5 as a function of average summer temperature. (b) The regression slope from the regional groupings created in figure 5 as a function of total summer precipitation. The grey shading indicates the 95% confidence interval of the linear regression.
Download figure:
Standard image High-resolution image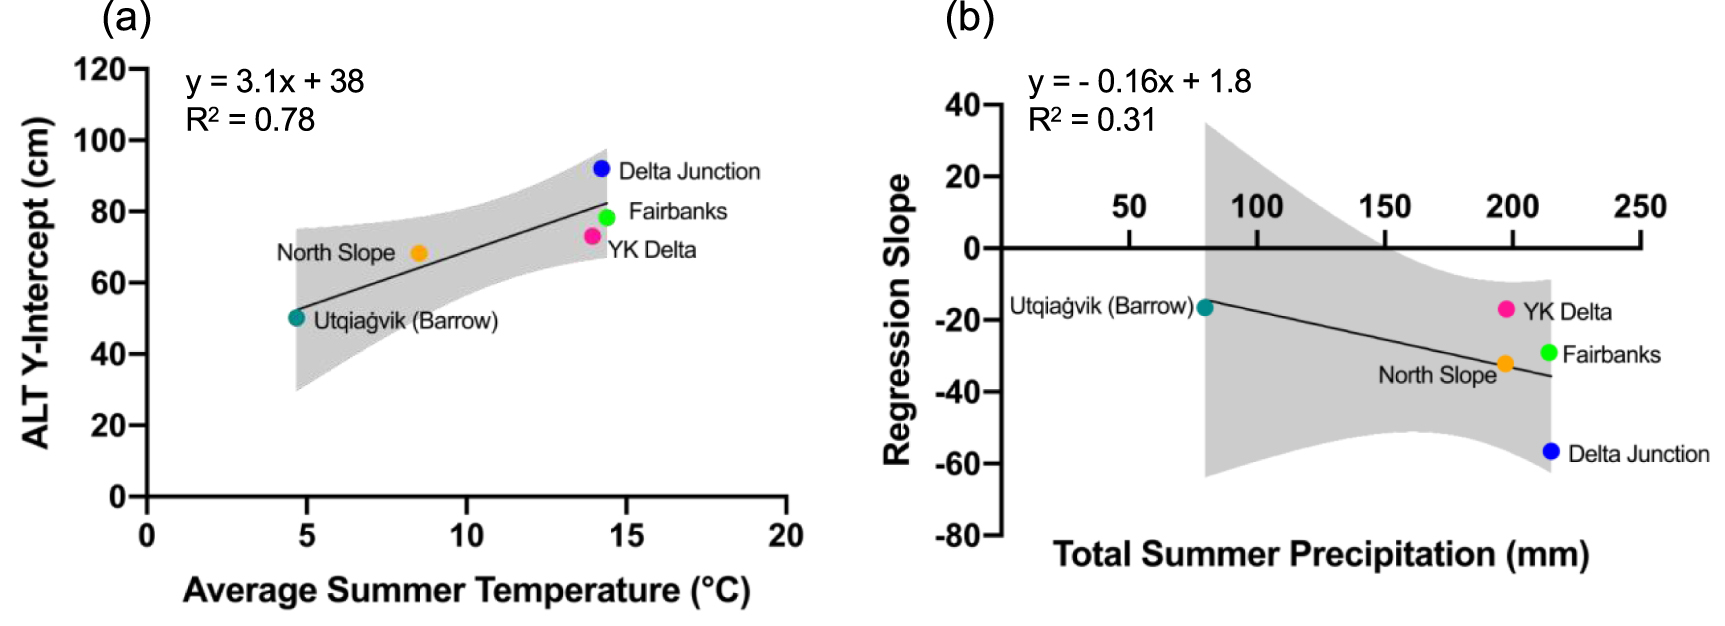
4. Discussion
Our analysis suggests latent heat exerts a stronger control on ALT than thermal conductivity overall, although we see evidence that both mechanisms occur simultaneously at different depths throughout the soil column. When looking at all VWC data, the scatter and highest probability plots both show a negative correlation between ALT and VWC, supporting the latent heat hypothesis. However, only the scatterplot regression is statistically significant. The bulk VWC shows a statistically significant, negative correlation with ALT, supporting the latent heat hypothesis. The bulk VWC represents the total water and latent heat content of the active layer, and the negative correlation clearly indicates wetter soils require more energy to thaw, resulting in shallower active layers. However, the top 12 cm VWC measurements show a statistically significant, positive correlation with ALT, supporting the thermal conductivity hypothesis. The 6 cm VWC also shows a positive correlation, supporting the thermal conductivity hypothesis, although this is not statistically significant (figure S7). Water at the surface of the soil appears more important to the thermal conductivity hypothesis than the total water content in the active layer. Surface soil consists primarily of organic matter, which acts as an insulator when dry, but becomes thermally conductive when wet. The thermal conductivity of the surface soil controls the exchange of energy with the atmosphere, with wetter surface soils conducting more heat, resulting in deeper active layers. This outweighs the heat soils lose through evaporation at the surface (Hinkel et al 2001). The 20 cm VWC shows no relationship with ALT, indicating a transition from thermal conductivity to latent heat controls on ALT. The 12 cm VWC represents the thermal conductivity influence on ALT while the bulk VWC represents the latent heat control on ALT.
Model analyses identify air temperature, winter snow conditions, and soil moisture as the three most important factors in determining ALT (Zhang and Stamnes 1998, Wang et al 2020). Our measurements of ALT show a statistically significant, positive correlation with average summer temperature (figure S14), supporting air temperature as the dominant control on ALT. The y-intercepts of the regional ALT vs. bulk VWC curves show a statistically significant, positive correlation with average summer temperature. The ALT vs. bulk VWC curves shift up or down with air temperature, also indicating air temperature as the dominant control on ALT. In essence, the warmer the summer, the deeper the active layer.
We see clear relationships between summer temperature, VWC, and ALT, but the relationship between ALT and precipitation appears more complex. Total summer precipitation correlates with summer average temperature, making it more difficult to isolate the effects of precipitation and temperature statistically. Precipitation accelerates permafrost thaw, particularly in spring (Douglas et al 2020). Warm rain enters the soil and cools, adding heat to the active layer and promoting thaw. The slope of terrain and water tracks can generate areas with deeper active layers due to horizontal heat transport from flowing water (Jorgenson et al 2010, Chen et al 2016, Voytek et al 2016). Yet, we found no statistically significant correlation between total summer precipitation and ALT or VWC of any depth grouping (figure S13). This lack of correlation may result from the fact that the soils at many of the sites in the SMALT stay at or near saturation throughout the summer, making the ALT and VWC appear insensitive to precipitation. Water tends to perch on the permafrost table, often forming a well-defined water table with saturated soil at the bottom of the active layer and drained soil on the top (Schaefer et al 2015). The VWC measurements in SMALT represent instantaneous value in time, while VWC varies depending on precipitation history and drainage. Unraveling how precipitation influences ALT requires a time history of simultaneous VWC and thaw depth measurements to isolate the impacts of individual rain events.
Bulk VWC control on ALT appears as a common factor at all sites. Field and modeling studies identify soil water content as an important factor influencing ALT (Nakano and Brown 1972, Hinkel et al 1990, 2001, Boike et al 1998, Carey and Woo 1998, Zhang and Stamnes 1998, Romanovsky and Osterkamp 2000, Zhang et al 2005, Jorgenson et al 2010, Scherler et al 2010, Atchley et al 2016, Kwon et al 2016, Jafarov et al 2017, Wang et al 2020). Statistically, the many factors affecting ALT should introduce randomness into our data, theoretically resulting in different regression slopes at each site, yet the slopes in figure 5 are all statistically significant, negative, and similar in magnitude. The steeper or more negative the slope, the more sensitive ALT is to an increase in bulk VWC. Many factors that influence ALT can explain variations between regions, but the unifying influence of VWC appears constant. Fire, for example, results in deeper active layers and wetter soils (Michaelides et al 2019), yet the sites in the YK Delta dominated by fire show a statistically identical regression slope as sites with no fire history, such as at Utqiaġvik.
Variations in average soil moisture or the depth of the water table within the active layer could help explain differences in slope between regions. A shallow water table or fully saturated soils throughout the summer would decrease the sensitivity of ALT to variations in bulk VWC, resulting in smaller regression slopes. Utqiaġvik and the YK Delta have small, statistically identical slopes. Both regions have shallow water tables with saturated active layers, resulting in a relatively small sensitivity to changes in bulk VWC. The North Slope and Fairbanks regions also have statistically identical slopes but more negative than Utqiaġvik and the YK Delta. North Slope and Fairbanks differ greatly in vegetation and geomorphology, but both regions tend to have better soil drainage, resulting in slightly lower bulk VWC on average and a higher sensitivity to changes in VWC. The Delta Junction region remains the outlier with the strongest slope, the most spatially variable bulk VWC, and lowest average bulk VWC.
Our analysis indicates a need to explore new techniques and strategies to measure bulk VWC when studying the relationship between soil moisture and ALT. Bulk VWC for the entire active layer represents the critical measurement, but measurements of surface soil moisture are much easier to make and thus are much more common. The 12 cm and 20 cm VWC measurements remain ideal for validation of remotely sensed soil moisture, plant dynamics, and similar research focusing on near surface soils. These measurements can tell us of the thermal conductivity influence of VWC on ALT but not the latent heat influence. Unfortunately, we see no significant correlation between 12 cm, 20 cm, and bulk VWC, so we cannot infer bulk VWC from surface VWC (figure S15). The GPR and DualEM work well to measure bulk VWC but require a significant resource investment to obtain and operate the equipment. Simply using longer probes for instruments similar to the Hydrosense may represent the simplest solution. Multiple buried sensors offer high time and vertical resolution to measure bulk VWC but only for fixed locations.
5. Conclusions
The latent heat of soil water exerts a stronger control on ALT than thermal conductivity, although both mechanisms occur simultaneously. Increased soil moisture content throughout the active layer increases the required latent heat of fusion for thaw, resulting in shallower thaw depths. However, increased soil moisture at the surface increases thermal conductivity and the exchange of energy with the atmosphere, resulting in deeper active layers. Precipitation may influence the sensitivity of ALT to increases in VWC while temperature determines the baseline thaw depth. The latent heat mechanism appears consistently across regions where we had observations.
Acknowledgments
Funding came from the NASA Grants NNX10AR63G, NNX06AE65G, NNX13AM25G, and NNX17AC59A; NOAA Grant NA09OAR4310063; and NSF Grants ARC 1204167. Funding was provided by the Next‐Generation Ecosystem Experiments (NGEE Arctic) project, supported by the Office of Biological and Environmental Research in the U.S. DOE Office of Science. J Chen was supported by NASA Terrestrial Hydrology Program, Grant 80NSSC18K0983. Thank you to the two anonymous reviewers whose valuable comments greatly improved this manuscript.
The authors have confirmed that any identifiable participants in this study have given their consent for publication.
Data availability statement
The data that support the findings of this study are openly available at the following URL/DOI: https://doi.org/10.3334/ORNLDAAC/1903.