

Abstract
Land-use change affects both the quality and quantity of soil organic carbon (SOC) and leads to changes in ecosystem functions such as productivity and environmental regulation. Future changes in SOC are, however, highly uncertain owing to its heterogeneity and complexity. In this study, we analyzed the outputs of simulations of SOC stock by Earth system models (ESMs), most of which are participants in the Land-Use Model Intercomparison Project. Using a common protocol and the same forcing data, the ESMs simulated SOC distribution patterns and their changes during historical (1850–2014) and future (2015–2100) periods. Total SOC stock increased in many simulations over the historical period (30 ± 67 Pg C) and under future climate and land-use conditions (48 ± 32 Pg C for ssp126 and 49 ± 58 Pg C for ssp370). Land-use experiments indicated that changes in SOC attributable to land-use scenarios were modest at the global scale, in comparison with climatic and rising CO2 impacts, but they were notable in several regions. Future net soil carbon sequestration rates estimated by the ESMs were roughly 0.4‰ yr−1 (0.6 Pg C yr−1). Although there were considerable inter-model differences, the rates are still remarkable in terms of their potential for mitigation of global warming. The disparate results among ESMs imply that key parameters that control processes such as SOC residence time need to be better constrained and that more comprehensive representation of land management impacts on soils remain critical for understanding the long-term potential of soils to sequester carbon.
Export citation and abstract BibTeX RIS

Original content from this work may be used under the terms of the Creative Commons Attribution 4.0 license. Any further distribution of this work must maintain attribution to the author(s) and the title of the work, journal citation and DOI.
1. Introduction
Soil is an essential resource for human sustainability that provides important ecosystem services such as water purification, nutrient cycling, and disaster prevention (Keith et al 2016). Any change in the huge stock of soil organic carbon (SOC) under climate change or land-use change can lead to feedback in the climate–carbon cycle (Jones et al 2005, Bond-Lamberty and Thomson 2010, Hugelius et al 2014, Crowther et al 2016). Land-use conversion can seriously affect SOC by modifying plant debris input and biophysical conditions at the soil surface (Smith 2008) and by enhancing horizontal soil displacement associated with wind and rainfall (Lal 2003, van Oost et al 2007). The historical use of land for agriculture and human settlement has caused soil degradation in many regions, thereby threatening the sustainability of human society (Houghton 1995, Pongratz et al 2010, Sanderman et al 2017).
Through appropriate land management practices, profitable soil functions that contribute to a soil's ability to absorb carbon from the atmosphere can be conserved, utilized, and enhanced (Stockmann et al 2013, Paustian et al 2016, Govers et al 2017). Fuss et al (2018) reviewed 22 studies on global soil carbon sequestration and estimated that the technically feasible potential is, on average, 4.28 Gt CO2 yr−1 (1.17 Pg C yr−1), with a range of 2–5 Gt CO2 yr−1. Recently, Bossio et al (2020) conducted a comprehensive global analysis and obtained the remarkable value of 5.5 Gt CO2 yr−1. The levels of SOC sequestration imply that it can be a cost-effective option. The Food and Agriculture Organization has initiated a program to evaluate the global SOC sequestration potential (GSOCseq; Smith et al 2020). At the 21st Conference of the Parties of the United Nation Framework Convention on Climate Change, held in Paris in 2015, an ambitious mitigation initiative called the '4 per 1000 (4‰) Initiative' was launched as a part of the Global Climate Action Agenda (Baveye et al 2017, Minasny et al 2017, Soussana et al 2019). This initiative set a goal of sequestering anthropogenic carbon in world soils at a rate of 4‰ of total carbon stock per year. Focusing on land areas where best management practices can be implemented, Minasny et al (2017) estimated that a 4‰ increase in SOC stock in these areas would compensate for 20%–35% of current anthropogenic emissions, but to achieve this mitigation target scientific challenges and practical barriers must be overcome (Amundson and Biardeau 2018, Stockmann et al 2013, Riahi et al 2017, Yamagata et al 2018).
Earth system models (ESMs), in which a biogeochemical carbon cycle scheme is coupled with physical climate schemes, are widely used for climate studies, including assessments of climate projections and mitigation options (Intergovernmental Panel on Climate Change [IPCC] 2013). Following their early application to the assessment of climate–carbon cycle feedbacks (e.g. Cox et al 2000, Friedlingstein et al 2006), ESMs have been increasingly used for land-use change studies (e.g. Pongratz et al 2010, Arora and Montenegro 2011, Lawrence et al 2018). However, ESMs have difficulties in replicating contemporary soil properties and dynamics (Todd-Brown et al 2013, 2014, Luo et al 2016, Hashimoto et al 2017). The objective of this study was to examine historical and future changes in the global SOC stock, mainly in the context of land-use change, as simulated by the ESMs being used for the IPCC Assessment Reports. The examination of the impacts of land-use change on global SOC stock in historical and future periods in this study is a first step in assessing the effectiveness of land management in climate change mitigation.
2. Methods
2.1. Land-use model intercomparison project data
2.1.1. Overview
This study analyzed output data from the Land-Use Model Intercomparison Project (LUMIP) (Lawrence et al 2016), one of the endorsed model intercomparison projects of the Coupled Model Intercomparison Project Phase 6 (CMIP6; Eyring et al 2016). As the metric of soil carbon stock, we used SOC total, which includes cSoil (CMIP variable name for soil carbon density) and other soil carbon pools. LUMIP was designed to investigate specific issues related to land-use and land-cover changes, and it examines not only individual biogeophysical and biogeochemical processes on land but also interactions and feedbacks among these processes (e.g. Boysen et al 2020, who describe an idealized deforestation experiment). ESMs were driven by data of the Land-Use Harmonization dataset (LUH2, Hurtt et al 2020, Ma et al 2020), which includes global gridded timeseries of historical and projected land-cover and land-use changes. Several example maps are shown in figure S1 (available online at stacks.iop.org/ERL/15/124061/mmedia).
This study used output data from 15 ESMs (table 1), in which land surface processes are simulated by specific sub-models. Note that CESM2 and NorESM2-LM share the same land model, CLM5. The land sub-models of the ESMs have similar biophysical schemes (Sellers et al 1997) but differ greatly in their parameterizations of land-use change and management, such as crop and wood harvesting, pasture management, and fertilizer and irrigation inputs to croplands. Several of the sub-models consider gross land-use changes (i.e. concurrent, bidirectional transformations between forest and cropland within a grid cell), whereas others consider only net land-use changes. In general, the representation of gross transitions is known to substantially increase carbon losses to the atmosphere (Stocker et al 2014).
Table 1. Models analyzed in this study, land-use processes included, and present-day global total soil organic carbon (SOC total) stocks.
| Earth system model | Grid | Land sub-model | Land-use change | SOC pools | SOC total in the 2000s (Pg C) | References and notes |
|---|---|---|---|---|---|---|
| ACCESS-ESM1-5 | 145 × 192 | CABLE2.4 | Net transition | cCwd, cLitter, cSoil | 981 | Ziehn et al (2017, 2020) |
| BCC-CSM2-MR | 160 × 320 | BCC-AVIM2 | Net transition | cLitter, cSoil | 1812 | Wu et al (2019) |
| CanESM5 | 64 × 128 | CLASS-CTEM | Net transition | cLitter, cSoil | 1483 | Swart et al (2019) |
| CESM2 | 192 × 288 | CLM5 | Net transition, explicit crops, wood harvest | cCwd, cLitter, cSoil | 1989 | Lawrence et al (2019) |
| CMCC-CM2-SR5 | 192 × 288 | CLM4.5 | Net transition, crops by grasses, wood harvest | cLitter, cSoil | 2964 | Cherchi et al (2019), land-hist experiment used |
| CNRM-ESM2-1 | 128 × 256 | ISBA-CTRIP | Net transition, explicit crops, no wood harvest | cLitter, cSoil | 1858 | Séférian et al (2020), Delire et al (2020) |
| EC-Earth3-Veg | 256 × 512 | LPJ-GUESS | Gross transition, explicit crops, wood harvest | cCwd, cLitter, cSoil | 1592 | Döscher et al and Miller et al (in prep) |
| GFDL-ESM4 | 180 × 288 | LM4.1 | Gross transition, crops by grasses, wood harvest | cSoil | 320 | Dunne et al (2020) |
| GISS-E2-1-G | 90 × 144 | ModelE | Net transition, crops by grasses, no wood harvest | cSoil | 1726 | Kelley et al (2020) |
| IPSL-CM6A-LR | 143 × 144 | ORCHIDEE | Net transition, crops by grasses, no wood harvest | cLitter, cSoil | 654 | Dufresne et al (2013) |
| MIROC-ES2L | 64 × 128 | VISIT-e | Gross transition, explicit crops, wood harvest | cLitter, cSoil | 1491 | Hajima et al (2020), Ito and Hajima (2020) |
| MPI-ESM1-2-LR | 96 × 192 | JSBACH3.2 | Gross transition, gross transitions, explicit crops, wood harvest | cLitter, cSoil | 985 | Reick et al (2013), Mauritsen et al (2019) |
| MRI-ESM2-0 | 160 × 320 | HAL | Net transition, forest area fraction | cLitter, cSoil | 1232 | Yukimoto et al (2019) |
| NorESM2-LM | 96 × 144 | CLM5 | Net transition, explicit crops, wood harvest | cCwd, cLitter, cSoil | 1886 | Bentsen et al (2013), Seland et al (2020) |
| UKESM1-0-LL | 144 × 192 | JULES-ES-1.0 | Net transition, crops by grasses, no wood harvest | cSoil | 1774 | Sellar et al (2019) |
2.1.2. Target variables and metrics
The global total soil carbon stock was calculated by summing grid-mean soil carbon density (cSoil) weighted by grid area land fraction. By definition, cSoil represents the carbon mass in the full depth of the soil model and corresponds to both mineral soil and humus in soil surveys. Note, however, that different models use different soil depths. Several models also showed anomalously high carbon stocks in the northern or southern high latitudes because of extremely high carbon stocks (>100 kg C m−2) in a few grid cells. Several models separate plant litter (variable name, cLitter) and coarse woody debris (cCwd) from cSoil (see table 1) to account for labile components. Therefore, to assess soil dynamics on a decadal time scale, we examined the total stock (SOCtotal) including both cSoil and cLitter (plus cCwd). Carbon flows that affect the SOC stock were also examined: namely, litter input from vegetation (variable name, fVegLitter), and microbial decomposition and heterotrophic respiration (variable name, rh).
2.1.3. Experiments
A full description of the LUMIP experimental protocol is given by Lawrence et al (2016). For this study, we selected experiments appropriate to our aim of analyzing historical to future SOC changes under different land-use conditions. First, we analyzed outputs of baseline experiments (hereafter, experiment names are in italics) conducted with fully coupled models (i.e. in which climate is internally evolving):
- historical: 1700 or 1850 (model dependent) to 2014
- ssp126 and ssp370: 2015–2100.
The historical experiment was driven by historical atmospheric and land conditions, and ssp126 and ssp370 were driven by the SSPs 1–2.6 (low end) and 3–7.0 (middle to high end) scenarios from ScenarioMIP (O'Neill et al 2016). More extensive cropland expansion and forest loss occur in the ssp370 future than in the ssp126 future (Riahi et al 2017). An additional experiment with prescribed (i.e. common among models) climate conditions was conducted by several ESMs:
- land-hist: driven by bias-adjusted observational climate data, Global Soil Wetness Project phase 3 (van den Hurk et al 2016).
LUMIP also includes specific experiments to evaluate land-use impacts as differences from baseline experiments:
- hist-noLu: uses constant land-use conditions in the historical run
- land-noLu: uses constant land-use conditions in the land-hist run
- ssp126_ssp370Lu: uses ssp370 land-use data in the ssp126 run
- ssp370_ssp126Lu: uses ssp126 land-use data in the ssp370 run
No experiment using constant land-use conditions for the future period was conducted because sensitivity to future land-use conditions is assessed by the land-use forcing exchange experiments (ssp126_ssp370Lu and ssp370_ssp126Lu). Data in CMIP format were obtained from the CMIP6 Portal provided by the Earth System Grid Federation (https://esgf-node.llnl.gov/search/cmip6/; as of August 2020).
2.2. Analyses
2.2.1. Benchmarking of the current stock
cSoil values in 2000–2009 estimated in the historical experiment (or in the land-hist experiment in the case of CMCC-CM2-SR5) were compared with two soil inventory datasets (which were produced by a number of soil profile surveys): the Harmonized World Soil Database v 1.21 (HWSD; FAO/IIASA/ISRIC/ISSCAS/JRC 2012) and WISE30Sec (Batjes 2016). Global SOC estimates were also compared to empirical estimates by Post et al (1982) and Jobbágy and Jackson (2000). Mean residence time (turnover, in years) of SOC was calculated by the simplest-model approach (Todd-Brown et al 2013) based on estimates for the 1850s (closer to equilibrium, because most models started their historical experiment in 1850 from an unforced control simulation). The use of near-equilibrium estimates avoids confounding factors from transient environmental changes such as 'false priming' (Koven et al 2015).
2.2.2. Trends and patterns of SOC sequestration change
The annual global SOC sequestration rate was calculated for each experiment as the slope of a linear regression applied to the data for given periods (1950s [1950–1959], 2000s [2000–2009], 2030s [2030–2039], 2060s [2060–2069], and 2090s [2090–2099]). The trends were calculated for the global total and for latitudinal zones (25° S–25° N and 25°–55° N). The relative change rate (‰ yr−1) was calculated by dividing the trend by the base SOC stock in the 2000s simulated by each ESM.
3. Results and discussion
3.1. Total soil carbon stock
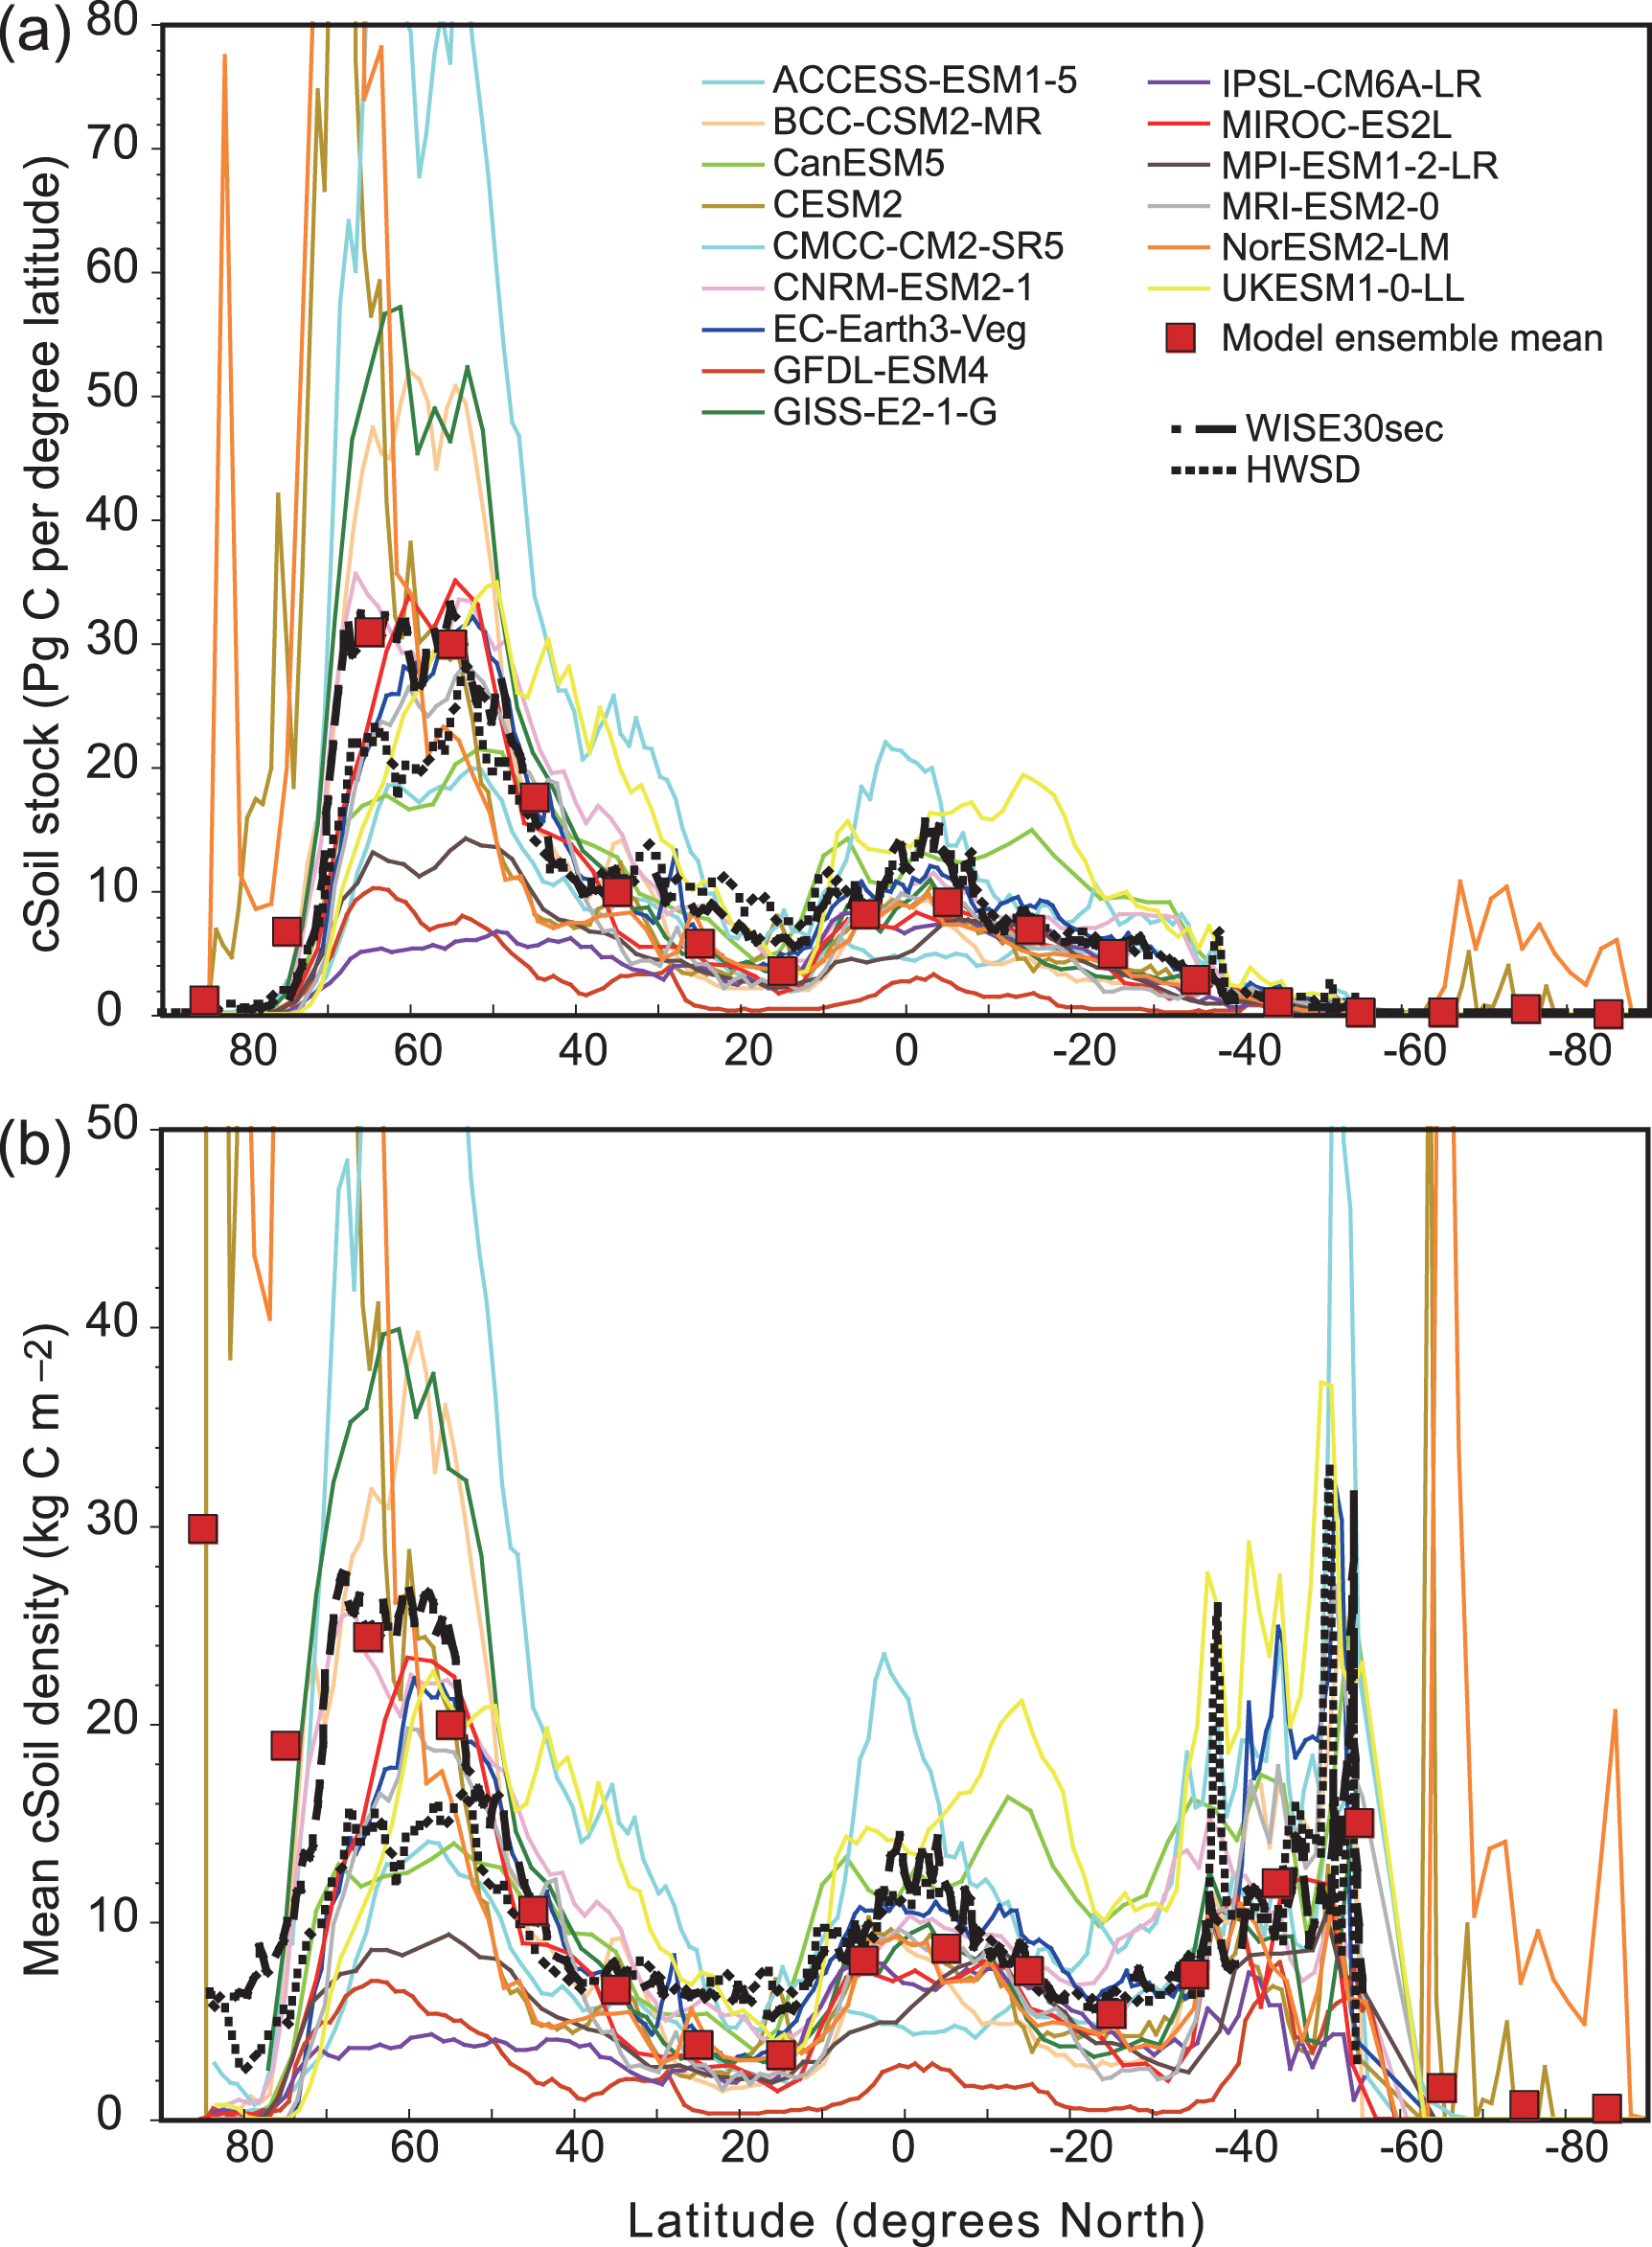
Global SOCtotal simulated in the 2000s ranged from 320 Pg C in GFDL-ESM4 to 2964 Pg C in CMCC-CM2-SR5 (table 1 and figure 1). Across the 15 ESMs, global SOCtotal averaged 1553 ± 672 Pg C (mean ± standard deviation [SD]), and most simulated global cSoil stocks fell within the range of observational values. Global cLitter (12 ESMs) + cCwd (4 ESMs) and cSoil stocks were simulated as 185 ± 88 Pg C and 1413 ± 688 Pg C, respectively. On average, cLitter + cCwd accounted for 11.9% of SOCtotal; the global cLitter + cCwd fraction ranged from 1.7% to 27.8% among the ESMs. Most models simulated high carbon stocks in the northern high latitudes and low carbon stocks in the middle to low latitudes (figure 2; see figure S2 for cSoil maps), consistent with findings by Todd-Brown et al (2013) and Carvalhais et al (2014) for CMIP5 models. This simulated latitudinal gradient reflects variations in the decomposition rate and is consistent with large-scale patterns seen in observational soil carbon datasets.
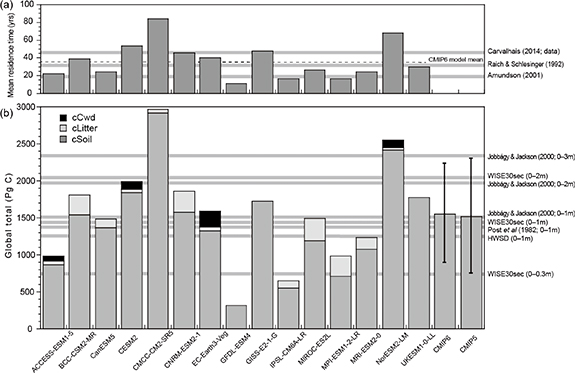
Figure 1. Comparison among CMIP land models of (a) estimated global mean residence times of SOC and (b) present global soil carbon pools, cSoil (if available), cLitter, and cCwd, in the 15 models in the 2000s simulated by the historical experiment (or by the land-hist experiment of CMCC-CM2-SR5). The mean CMIP6 and CMIP5 results (11 models, Todd-Brown et al 2013) are shown at the right, and observational data are shown by the gray horizontal bars.
Download figure:
Standard image High-resolution image
Figure 2. Latitudinal distributions of (a) carbon stocks in cSoil and (b) mean areal carbon density, simulated by CMIP6 ESMs in the 2000s. Distributions in the global soil datasets HWSD and WISE30sec (1 m soil depth) are included for comparison.
Download figure:
Standard image High-resolution imageGlobal mean residence time of SOC total in the 1850s was calculated as 36.8 ± 20.5 years and ranged from 11.4 years in GFDL-ESM4 to 84.1 years in CMCC-CM2-SR5 (figure 1). In most models, the residence time fell within the observational range of 18.5–45.8 years (Raich and Schlesinger 1992, Amundson 2001, Carvalhais et al 2014). The difference in mean residence time explains about 88% of the variation of global SOC stock among the models (figure S3). Previous studies have pointed out that the turnover rate is an important metric of ecosystem carbon pools (e.g. Bonan et al 2013, Todd-Brown et al 2013, Carvalhais et al 2014, Friend et al 2014). For example, Erb et al (2016) and Nyawira et al (2017) reported an acceleration of SOC turnover that they attributed mostly to a reduction in litter input driven by deforestation and crop and wood harvesting.
3.2. Temporal change in SOC stock
3.2.1. Historical period (1850–2014)
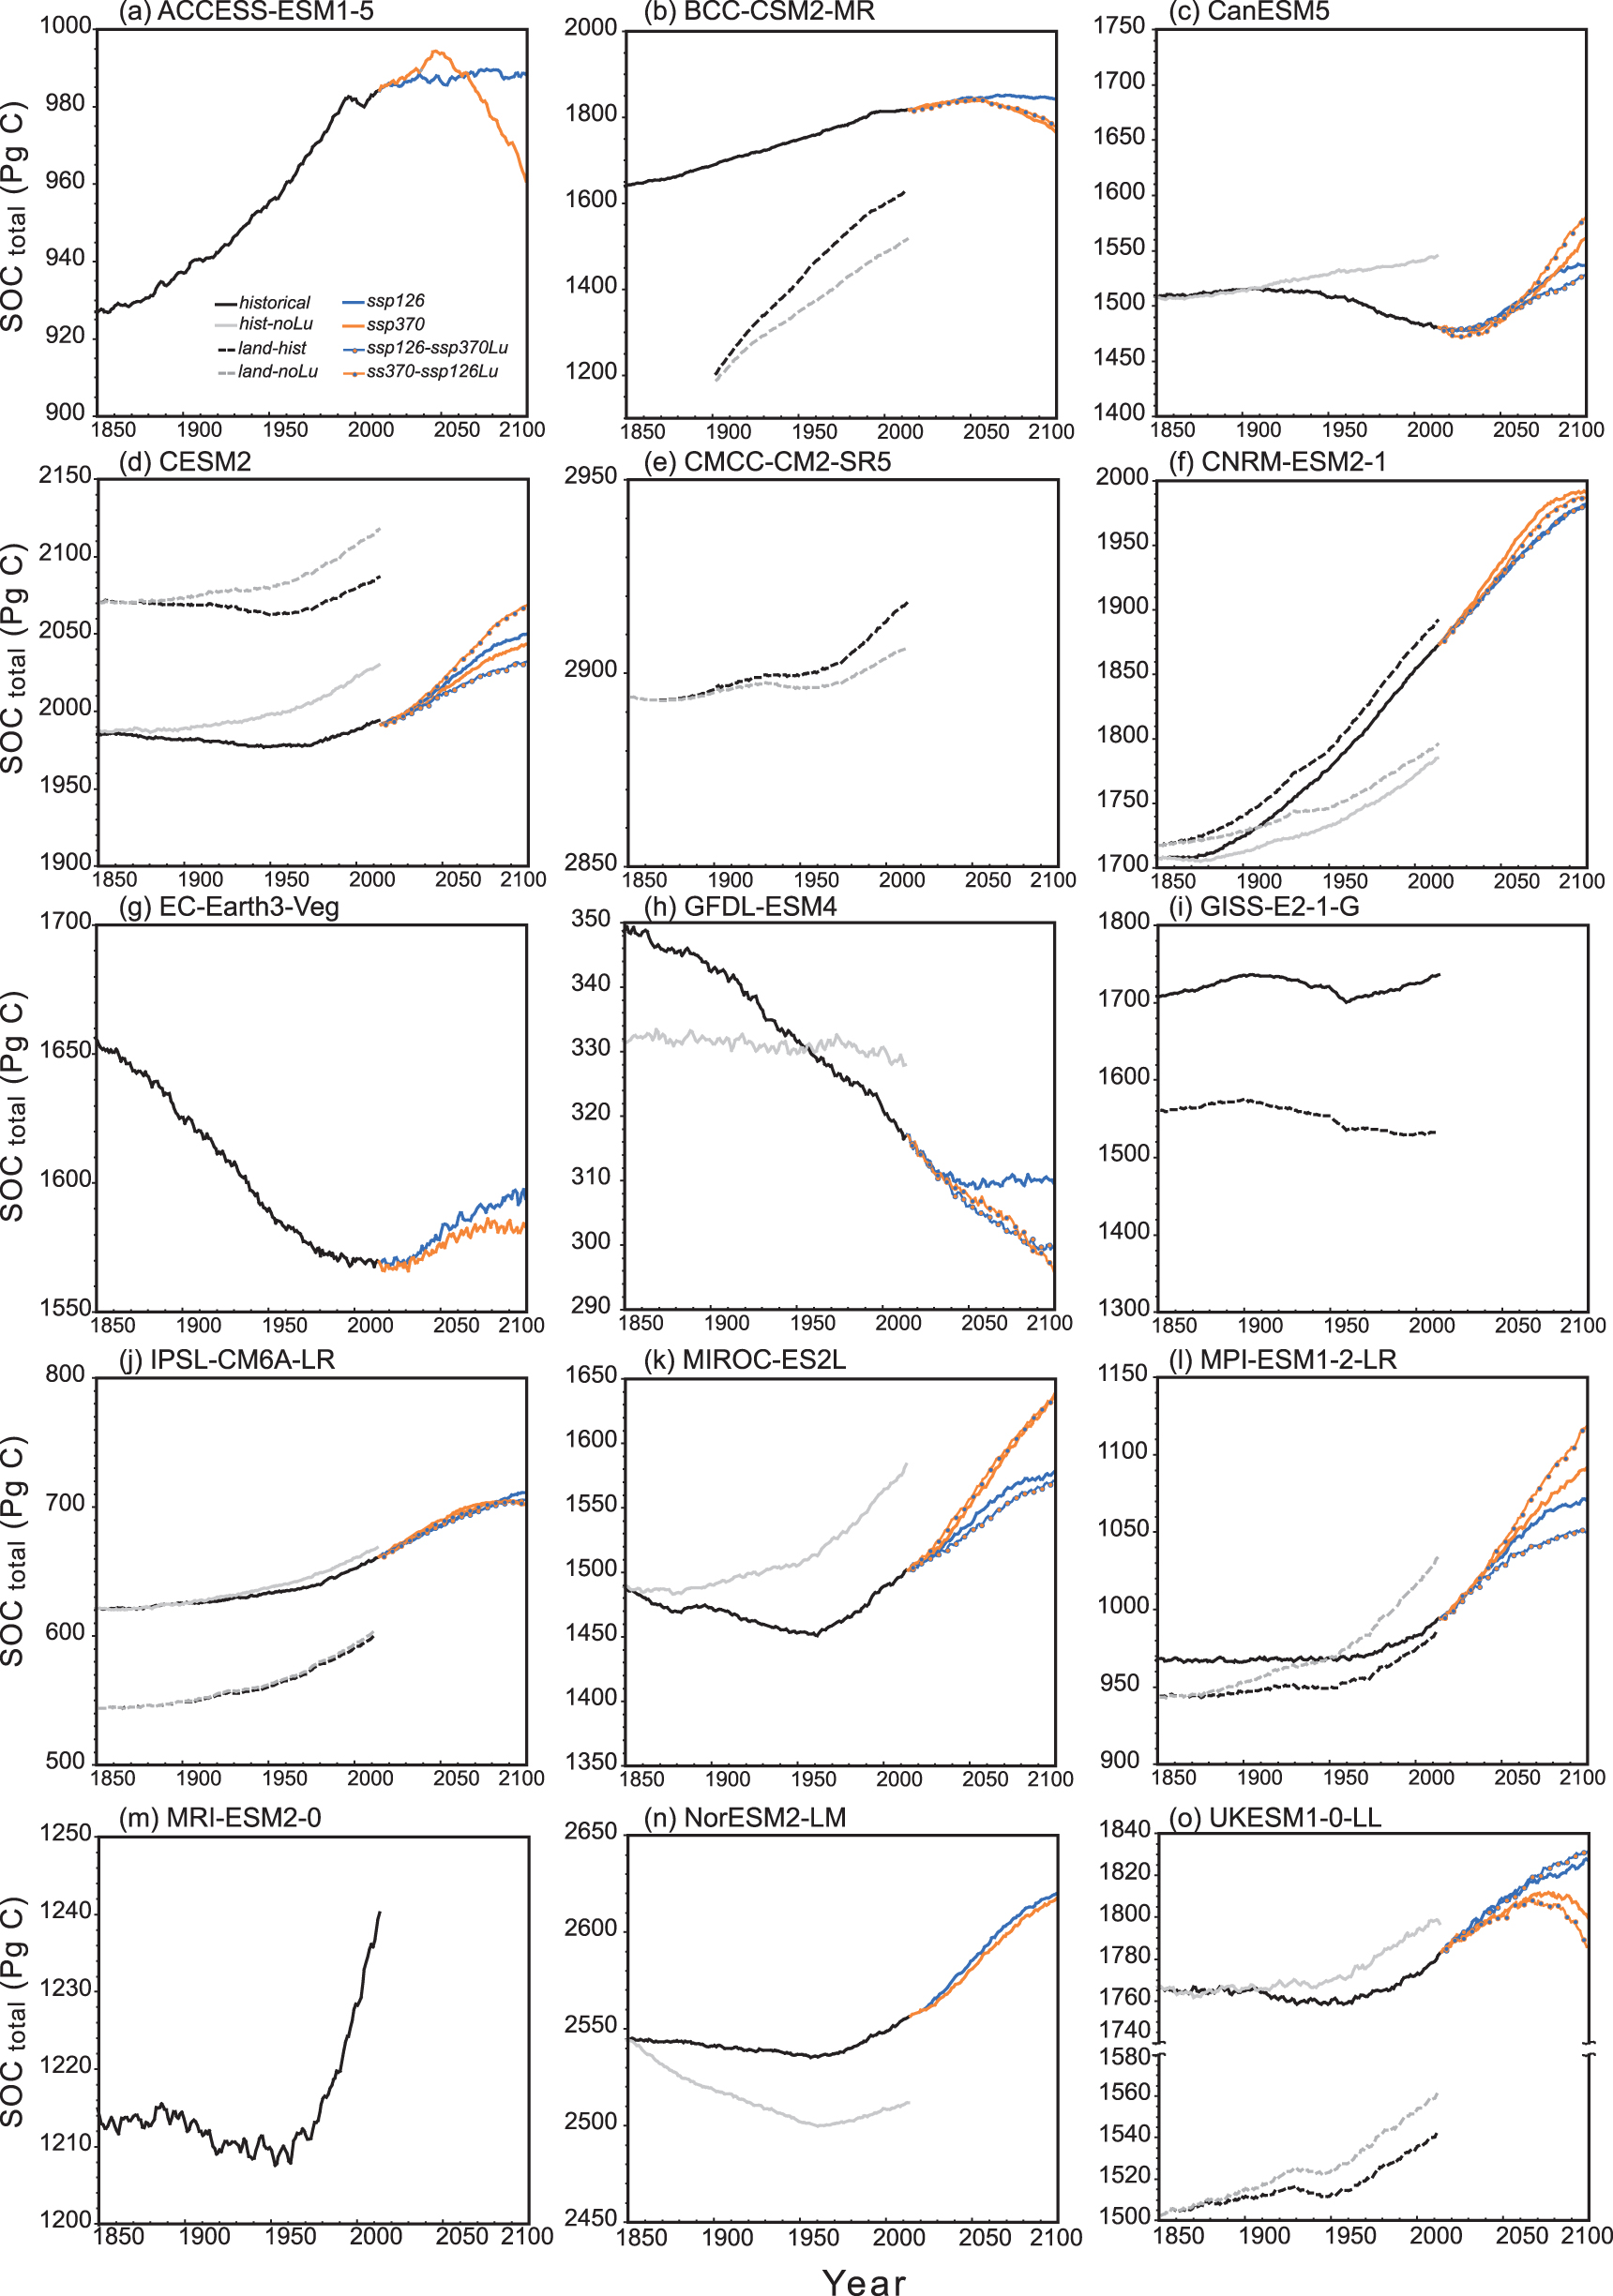
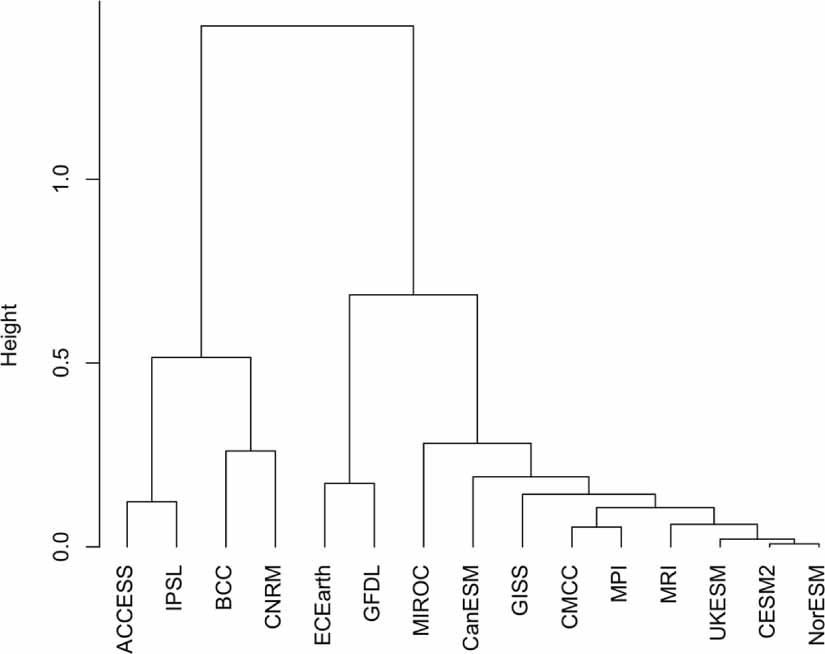
Throughout the historical experiment, the multi-model mean net SOC accumulation rate was simulated to be 0.18 ± 0.41 Pg C yr−1 or 0.11 ± 0.31‰ yr−1 (mean ± SD of 15 models): historical total, 29.9 ± 66.9 Pg C. The highest accumulation rate was simulated by BCC-CSM2-MR: 1.1 Pg C yr−1 or 0.66‰ yr−1. Simulated changes in the global SOC stock showed model-specific trajectories (figure 3). A cluster analysis (figure 4(a)) showed that the trajectories could be categorized into two large groups, one considering of 4 models and the other of 11 models. The former group showed a steady increase of SOC total through the historical period, although the magnitude of the increase differed, from 39 Pg C in IPSL-CM6A-LR to 177 Pg C in BCC-CSM2-MR. The latter group was divided into two sub-groups: one comprised EC-Earth3-Veg and GFDL-ESM4, and the other consisted of the other nine models. The former sub-group showed substantial decreases in SOC total of 32 Pg C in GFDL-ESM4 and 86 Pg C in EC-Earth3-Veg (both adopted gross land-use transition, table 1), whereas the latter showed, in general, stable or weakly decreasing SOC total trends to about 1950, followed by gradual accumulations. As a result, net changes in SOC total during the 20th century were small in this model group. In all models, the historical change in SOC total is at least partly attributable to land-use changes such as tropical deforestation. On an area-basis (figure S4), SOC total decreased at a rate of 3.0 ± 6.7 (median 2.5) Pg C per million km2 of cropland expansion and 1.0 ± 2.2 (median 0.8) Pg C per million km2 of cropland and pasture expansion.
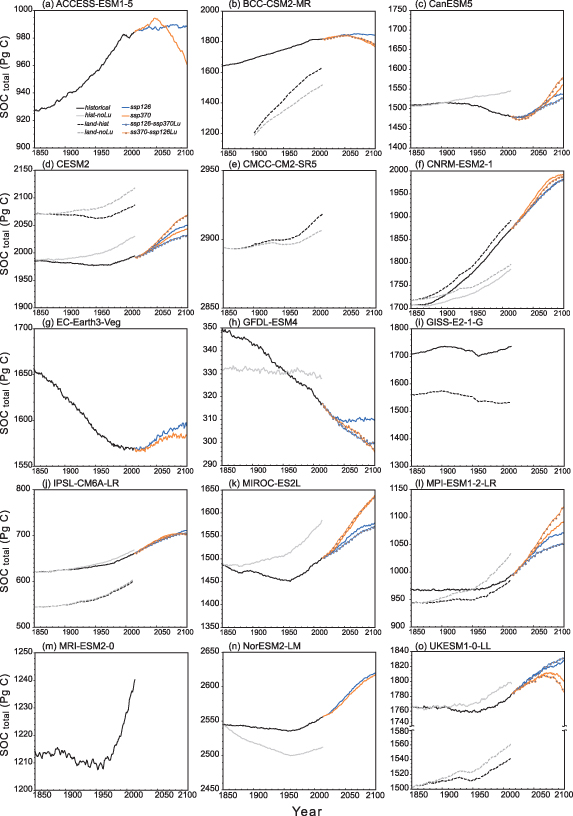
Figure 3. Temporal trajectories of global total SOC simulated by ESMs in the LUMIP and CMIP6 experiments.
Download figure:
Standard image High-resolution image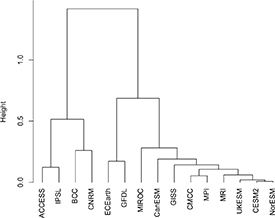
Figure 4. Dendrogram of SOC total change patterns simulated in the historical experiment by the ESMs. The data are standardized to the values in the year preceding the analysis period. Clustering was conducted based on Euclidean distance (height) and conducted by the furthest neighbor method with R software (R Core Team 2020).
Download figure:
Standard image High-resolution imageHistorical changes in SOC stocks occurred heterogeneously over the land surface and differed among ESMs (figure S5). Three models (ACCESS-ESM1-5, BCC-CSM3-MR, and CNRM-ESM2-1) showed extensive increases, whereas two models (EC-Earth3-Veg and GFDL-ESM4) that used gross land-use transition showed decreases in most land areas. The others showed a mixture of increases and decreases, depending on cultivation intensity and climate conditions. We focused on highly cultivated areas (see figure S1), which showed marked inconsistencies among the model results. In Europe, for example, the majority of models simulated a net increase of SOC, whereas CanESM5 and GFDL-ESM4 simulated regional decreases of SOC stocks except in a few countries. In North America (Midwestern United States), the simulated historical change was obviously inconsistent among the models: clear increases were simulated by six models, clear decreases by five models, and mixed patterns by four models. Similar inconsistencies were simulated in other cultivated areas such as in central South America and East Asia (China). In primary (naturally vegetated) lands, the SOC responses were mainly caused by climate change, but they were also inconsistent among the models. For example, in the Eurasian tundra and central Amazon, some models simulated a SOC increase, whereas others simulated a decrease.
3.2.2. Future period (2015–2100)
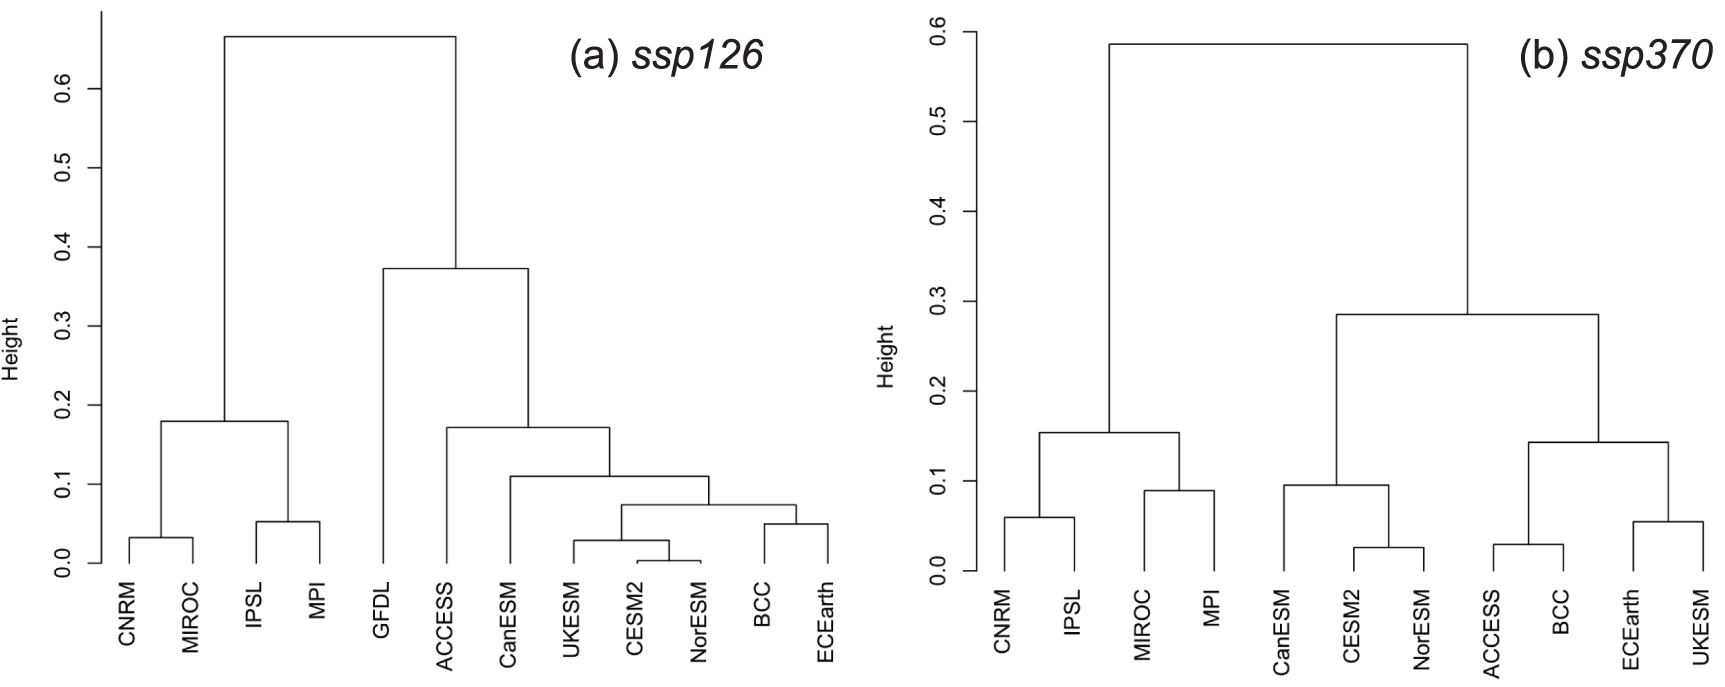
In the ssp126 experiment, most models simulated increases in SOC total at model-specific rates: 0.57 ± 0.38 Pg C yr−1 or 0.39 ± 0.35‰ yr−1 (mean ± SD): total 47.8 ± 32.2 Pg C by the end of the 21st century. In the ssp370 experiment, the models also simulated increases in SOC total; the mean projected value was similar to that simulated in ssp126 but there was wider inter-model variability: 0.59 ± 0.69 Pg C yr−1 or 0.42 ± 0.50‰ yr−1 (total 49.3 ± 57.8 Pg C). A cluster analysis divided the change patterns simulated in the ssp126 experiment into two groups (figure 5(a)), one showing clear increasing trends and the other showing weak or mixed trends. The fastest SOC accumulation rate of 1.27 Pg C yr−1 was simulated by CNRM-ESM2-1, and in terms of relative change, the fastest rate of 0.92‰ yr−1 was simulated by MPI-ESM1-2-LR. The simulated SOC total change patterns of the ssp370 experiment were also divided into one group showing a steady increasing trend and a second group showing weak or mixed trends (figure 5(b)). The mixed-trend group, e.g. ACCESS-ESM1-5 and UKESM1-0-LL, typically showed a parabolic trajectory, with an initial increase to saturation followed by a decrease (figure 3).
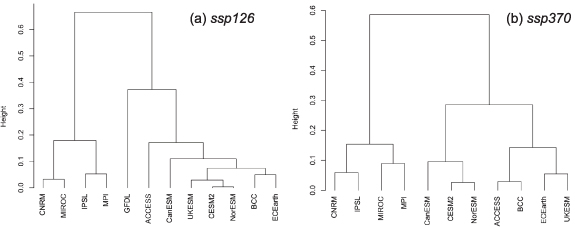
Figure 5. Dendrogram of SOC total change patterns in the results of the (a) ssp126 and (b) ssp370 experiments simulated by the ESMs.
Download figure:
Standard image High-resolution imageFuture changes in the SOC stock also occurred heterogeneously, with consistency between scenarios and differences among the models (figures S6 and S7). As seen in the historical experiment, in agricultural areas, the changes were inconsistent among the models and ranged from strong losses (e.g. central North America by CanESM5 and UKESM1-0-LL) to substantial gains (e.g. Europe by CESM2, MIROC-ES2L, and NorESM2-LM). As in the historical experiment, the soil responses in natural lands, for example, high-latitude lands dominated by boreal forest and tundra, to climate change were different among the models (figures S5 and S6); these results are consistent with previous climate impact studies (e.g. Friend et al 2014, Todd-Brown et al 2014). Because these model-specific results are attributable to not only soil schemes but also the climate simulations, detailed investigations of biogeophysical and biogeochemical feedbacks for each ESM are needed (e.g. Ito and Hajima 2020).
3.2.3. Land-use data exchange experiments
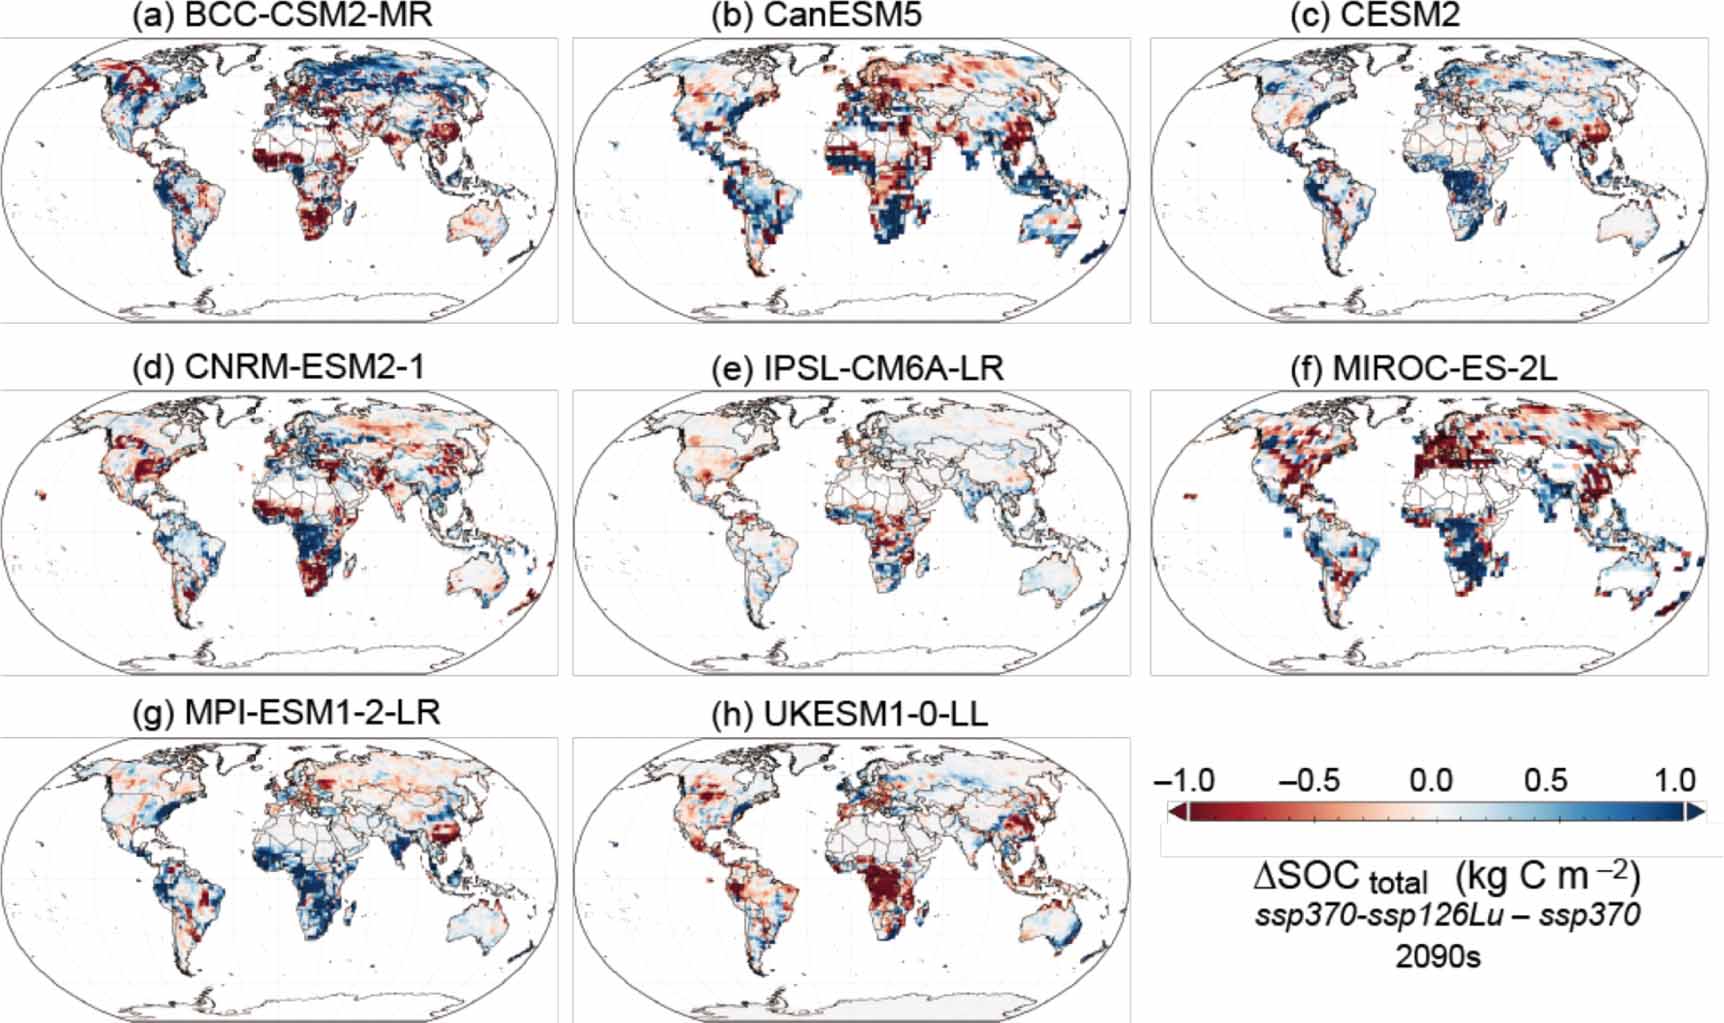
The land-use forcing exchange experiments (ssp126-ssp370Lu and ssp370-ssp126Lu), conducted by seven ESMs, helped us to assess the impacts of future land-use change on SOC. The magnitude of global SOC change associated with a land-use scenario was evaluated as the difference between pairs of experiments (see figure 3). First, we identified several regions that were sensitive to anticipated future land-use changes (figure 6). For example, in central Africa, CNMR-ESM2, MIROC-ES2L, and MPI-ES1-2-LR simulated larger SOC stocks in ssp370-ssp126Lu than in ssp370. In contrast, CanESM5 and UKESM1-0-LL simulated lower SOC stocks under the same conditions. Although the global total change in SOC (5.5–5.9 Pg C) was not markedly large, we should pay attention to these potentially vulnerable regions.
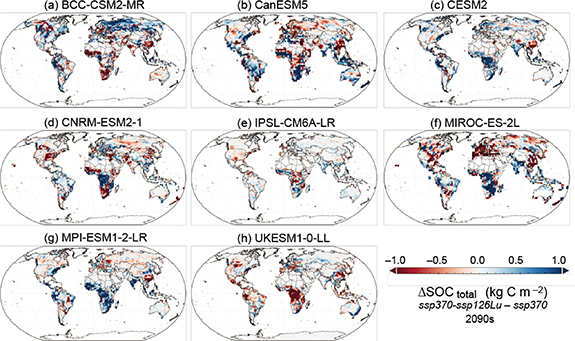
Figure 6. Distribution of the impacts of land-use change on SOC total in the 2090s. The difference (ΔSOC total) between ssp370-ssp126Lu and ssp370 simulated by each of the seven ESMs used for these experiments are shown.
Download figure:
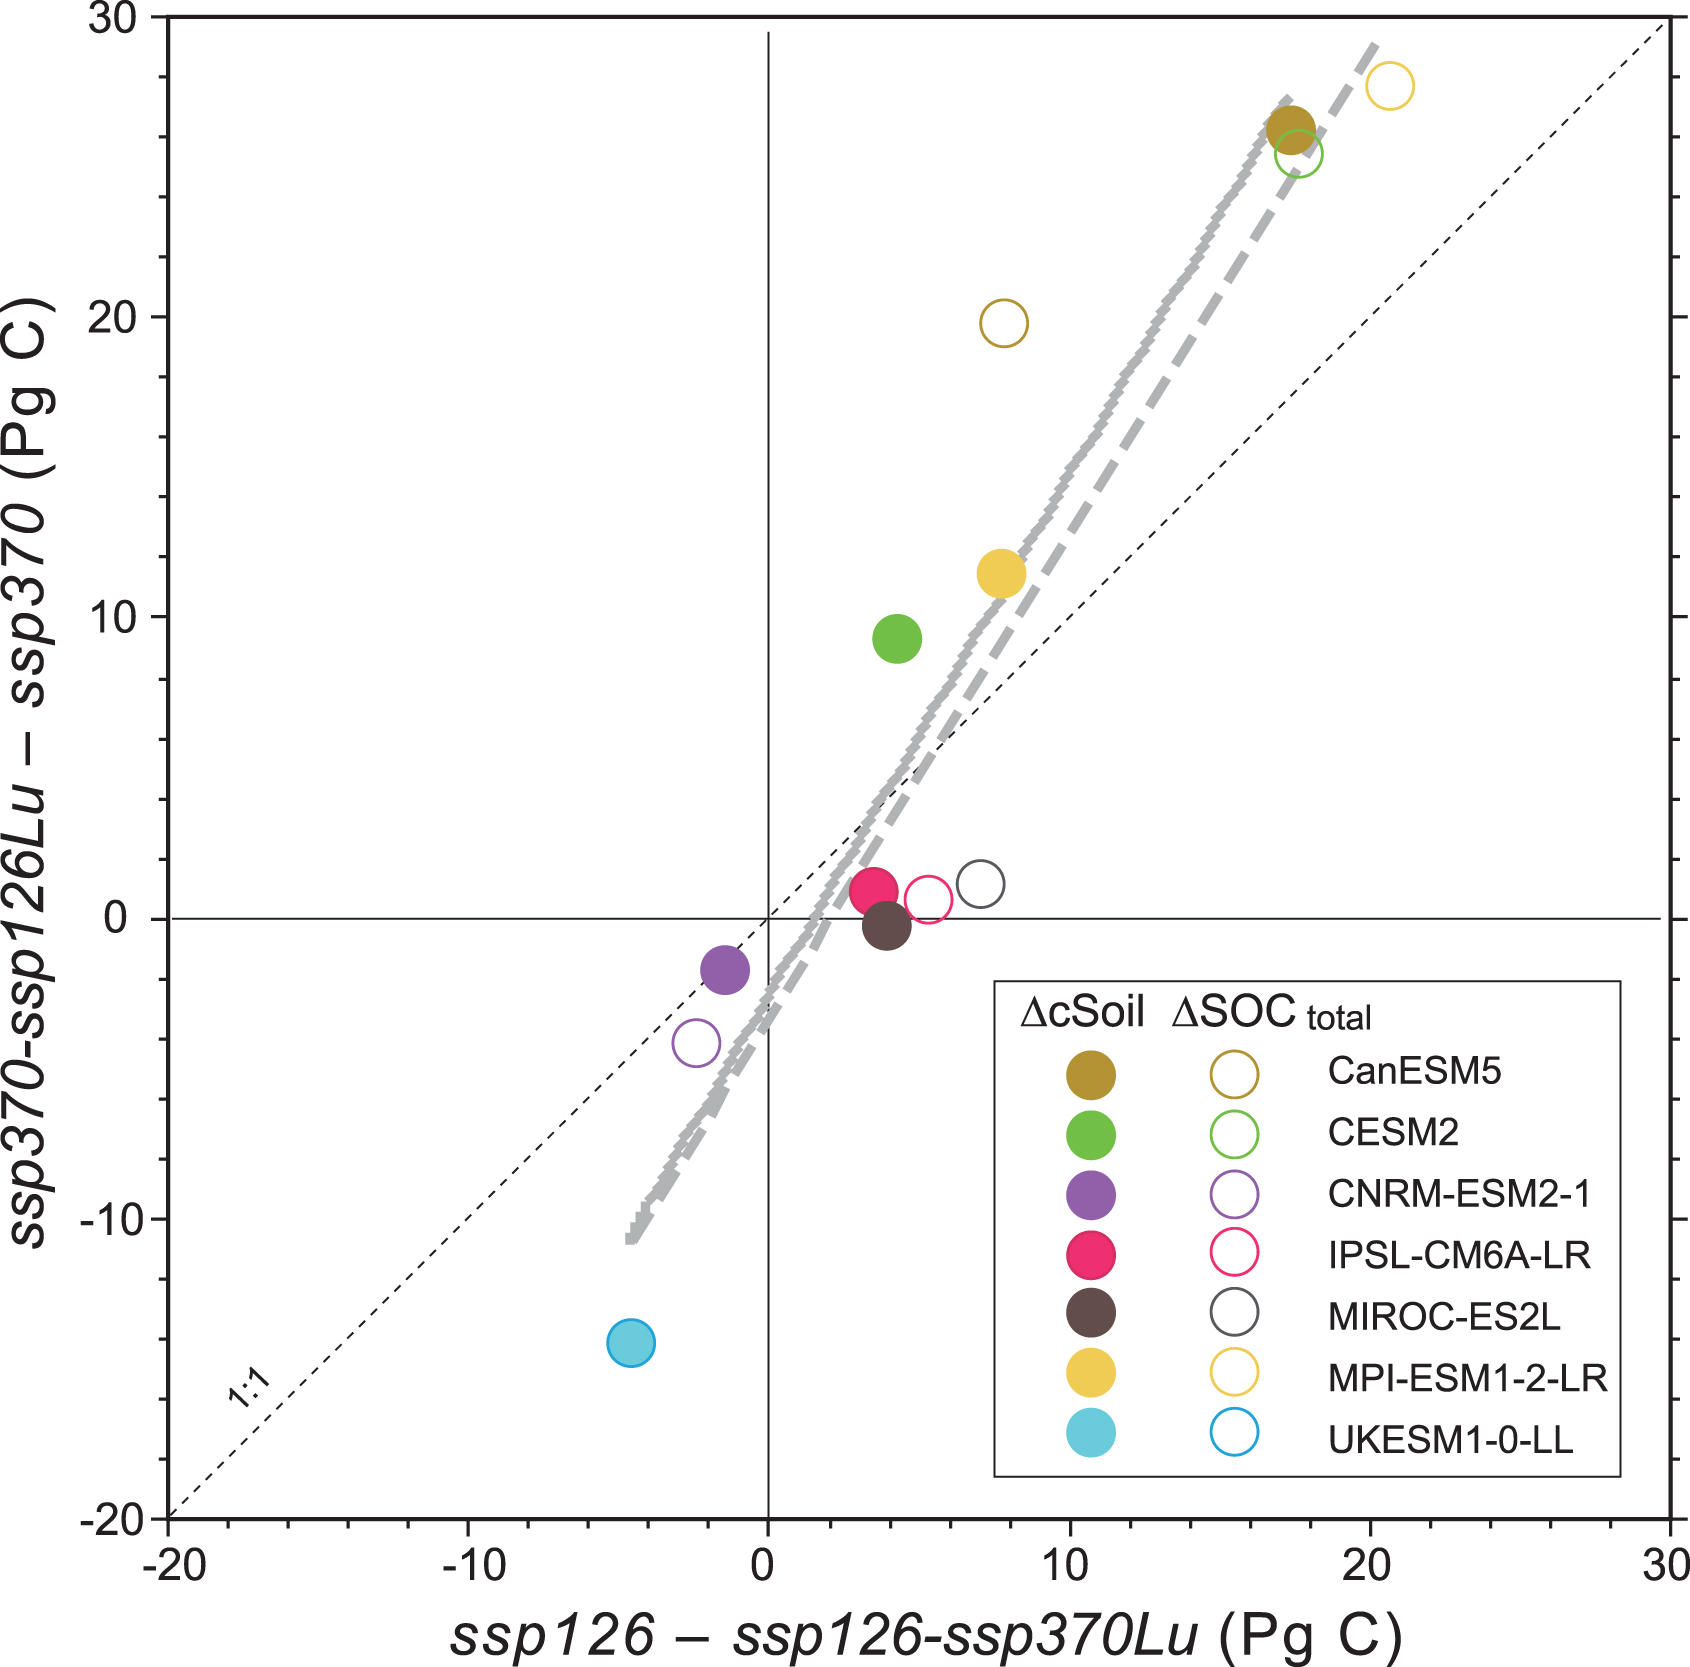
Standard image High-resolution imageSecond, among the ESMs, the model response to land-use change was asymmetric. The differences among ESMs were larger in the ssp370-based simulations (−14 to 28 Pg C, y-axis of figure 7) than in the ssp126-based simulations (−4 to 21 Pg C, x-axis of figure 7); these results imply that the impacts of land-use change are greater under higher greenhouse gas forcing. This asymmetry is likely due to the stronger CO2 fertilization effect at higher CO2 levels, which causes larger gains and losses to be associated with reforestation and deforestation. In the ssp126-ssp370Lu experiment, SOC was more strongly reduced than in the ssp126 experiment because of weaker land-use regulation and continued deforestation.

Figure 7. Relationships of the simulated responses of cSoil and SOC total (i.e. including cLitter and cCwd) in 2100 between the pair of land-use change experiments. Dotted and dashed gray lines show linear regression lines fitted to ΔcSoil and ΔSOC total, respectively.
Download figure:
Standard image High-resolution imageThird, cLitter and cCwd showed characteristic contributions seen as the difference between the cSoil and SOC total results in figure 7. In MPI-ESM1-2-LR, for example, the SOC stock in the ssp370-ssp126Lu simulation was 28 Pg C higher than it was in the simulation using the ssp370 land-use data. This SOC stock difference was associated with the smaller cropland expansion in the ssp126 land-use scenario. Interestingly, the detritus soil component responded sensitively to land-use change; cLitter accounted for about 60% of the SOC difference. The SOC response in the ssp126-ssp370Lu experiment was opposite to that in the ssp370-ssp126Lu experiment, and its magnitude was smaller. In contrast, in UKESM1-0-LL, less carbon was stored when ssp126 land-use data were used with ssp370. However, the responses of several models were insensitive to the land-use change data used.
3.3. Implications for refinement of soil scheme in ESMs
The SD of global SOC total among the 15 ESMs, ±672 Pg C, was as large as that obtained by previous-generation CMIP5 models, ±770 Pg C (Todd-Brown et al 2013). This large SD implies that the inter-model difference, stemming from model uncertainty (e.g. Falloon et al 2011, Tian et al 2015), has not been markedly diminished since 2013. Previous studies have reported similar inter-model variability. For example, Todd-Brown et al (2014) found that the simulated global SOC response ranged from a 72 Pg C loss to a 253 Pg C gain. Nishina et al (2015) applied the analysis of variance method to the simulation results of six land models and found that the majority of the uncertainty in SOC projections (up to 90%) was attributable to differences in the sensitivity of land models in terms of responses to environmental change. The comparison among the simulated SOC responses to land-use forcing is a novel attempt of the present LUMIP-based analysis.
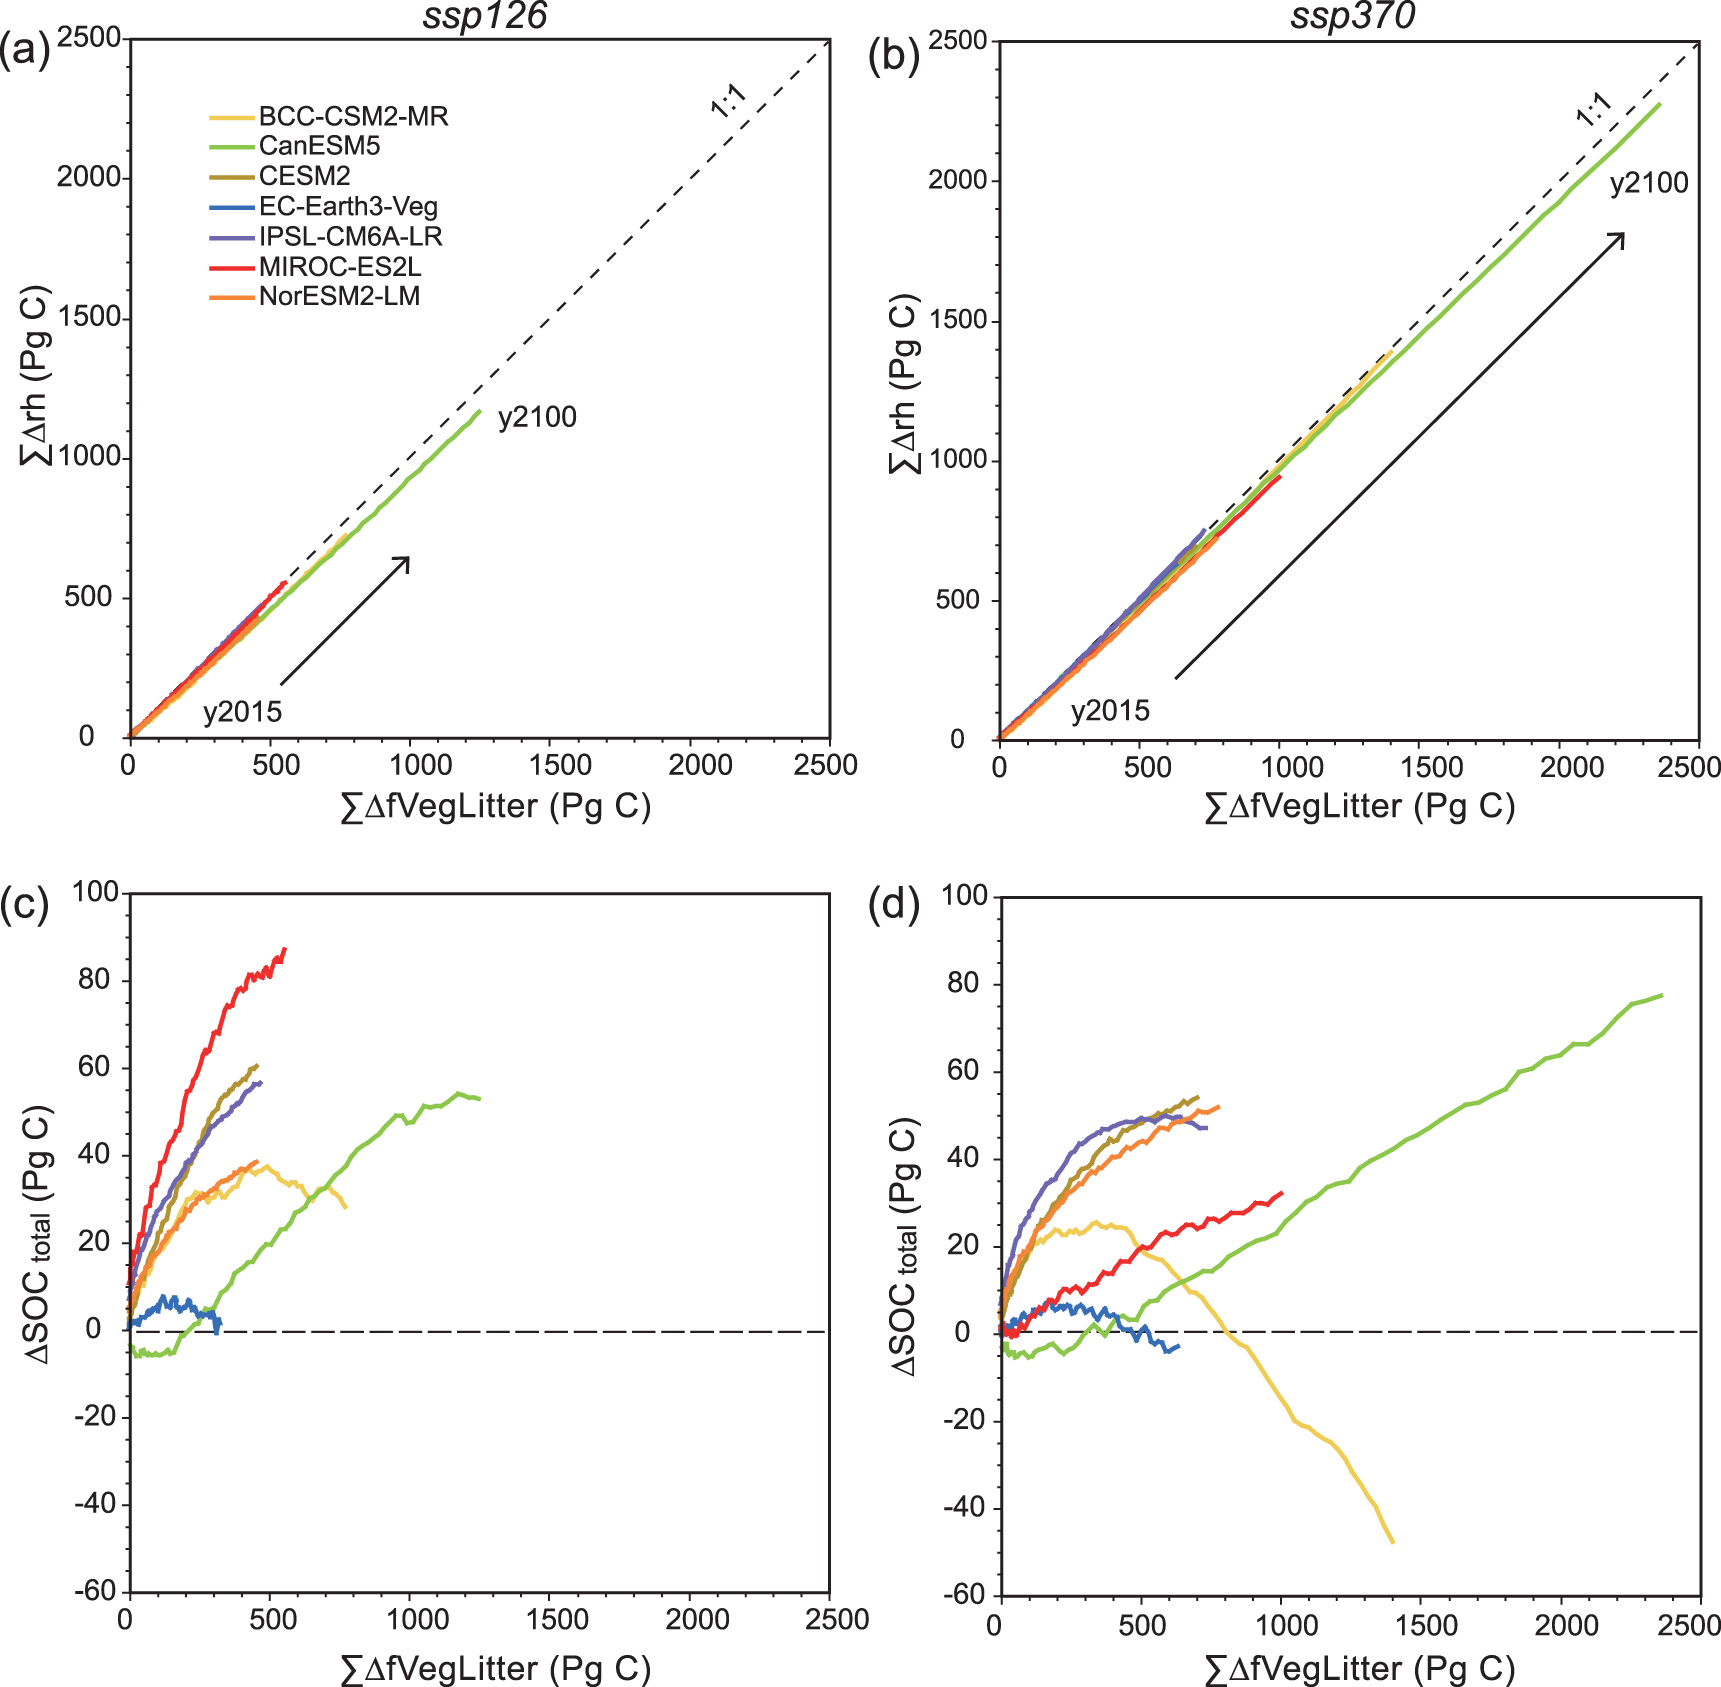
It is difficult to offer an explanation for the inconsistency among the simulated SOC patterns that is both comprehensive and mechanistic. Nyawira et al (2017) devised a universal setup to isolate input-driven from turnover-driven soil carbon changes following land-use change. To conduct corresponding analysis in a simpler manner, SOC variation is assessed to be caused by changes in carbon input by litterfall or in the decomposition rate associated with the turnover rate. First, we examined input (fVegLitter) and output (rh) carbon flows of the SOC stock to examine the consistency between inputs and outputs across models. We found that although the magnitude of simulated flows differed among the ESMs, the relationship between the two flows was consistent across ESMs and SSPs (figures 8(a) and (b)), and that the fVegLitter–rh relationship was quite linear in all cases. The moderate and model-specific relationships between the cumulative fVegLitter change and SOC change imply a substantial influence of different rates of carbon loss by decomposition (figures 8(c) and (d)). Moreover, this dynamic SOC response result is consistent with the static SOC stock result, which is well-correlated with mean residence time (figure S3(b)).

Figure 8. Relationships between cumulative changes in carbon input by litterfall (fVegLitter) and (a), (b) carbon output as heterotrophic respiration (rh) or (c), (d) soil carbon (SOC) stock in the (a), (c) ssp126 and (b), (d) ssp370 experiments. The change term (Δ) is defined as the difference from the 2000s mean, and ∑ represents the accumulation from 2015 to 2100.
Download figure:
Standard image High-resolution imageCertain processes and parameters of the soil models implemented in ESMs can be improved, such as the decomposition rate and its sensitivity to temperature and moisture conditions. However, considering the complexity of soil processes, a more practical strategy would be to constrain bulk (whole soil) metrics instead of individual parameters. Considering its importance, in the carbon dynamics, mean residence time of SOC may be one candidate for such a constraint (e.g. Carvalhais et al 2014). The use of modern numerical algorithms would make it possible to optimize multiple parameters (e.g. base decomposition rate and temperature dependence) by minimizing errors in target metrics. By contrast, model structure improvements require deep insights into biogeochemical processes. For example, different treatment of C–N interactions might lead to very different responses in terms of SOC stocks. In fact, reactive nitrogen deposition, acting in synergy with other environmental drivers, can enhance terrestrial carbon sequestration in N-limited ecosystems (Zaehle et al 2011) but not, apparently, in N-saturated ecosystems (Bertolini et al 2016). Other processes such as peat accumulation and permafrost thawing, although they occur locally, are nonetheless important in terms of the greenhouse gas budget of soils under global change. Establishing parameterizations for these processes is a big challenge for soil, ecosystem, and climate model researchers.
3.4. Implications for soil management for climatic mitigation
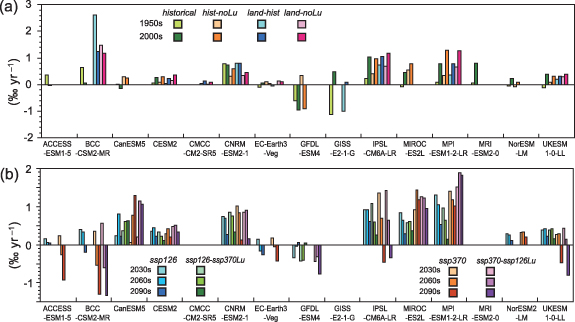
Although the model results presented here appear inconsistent, nonetheless have implications for soil management for mitigation of global warming through carbon sequestration. First, the results indicate a range of possible rates of global SOC stock change (figure 9; see figure S8 for zonal results). In the 2000s in the historical experiment, the global SOC increment was simulated to increase at rates of around 0.46 ± 0.48 Pg C yr−1 (0.28 ± 0.49‰ yr−1) by the 15 ESMs. This change rate seems modest in comparison with the technical potential of SOC sequestration (1.17 Pg C yr−1; Fuss et al 2018), but at about one-third of net land sink (e.g. Friedlingstein et al 2019), it is significant in terms of the global contemporary carbon budget. In the future ssp126 and ssp370 experiments, the change rate accelerates to about 0.78 Pg C yr−1 by the 2030s; a particularly high sequestration rate of about 1.9 Pg C yr−1 was simulated by CNRM-ESMs in the 2030s, and one of 2.1 Pg C yr−1 was simulated by MIROC-ES2L in the 2060s. The simulated future SOC accumulation induced by climate change and conventional land use (around 0.4‰ yr−1) is auspicious for future climatic mitigation by soils, in particular if management strategies are taken in top-level consideration in near-future decision-making processes. However, it should be noted that in both experiments, the SOC accumulation rates gradually declined to 0.1–0.3 Pg C yr−1 by the 2090s.
Figure 9. Relative change rates of global soil carbon (SOC total) storage simulated by the LUMIP experiments. Rates in (a) the 1950s and 2000s in the historical experiments and (b) the 2030s, 2060s, and 2090s in the future projection experiments. See figure S8 for results for the northern mid-latitudes and tropics.
Download figure:
Standard image High-resolution image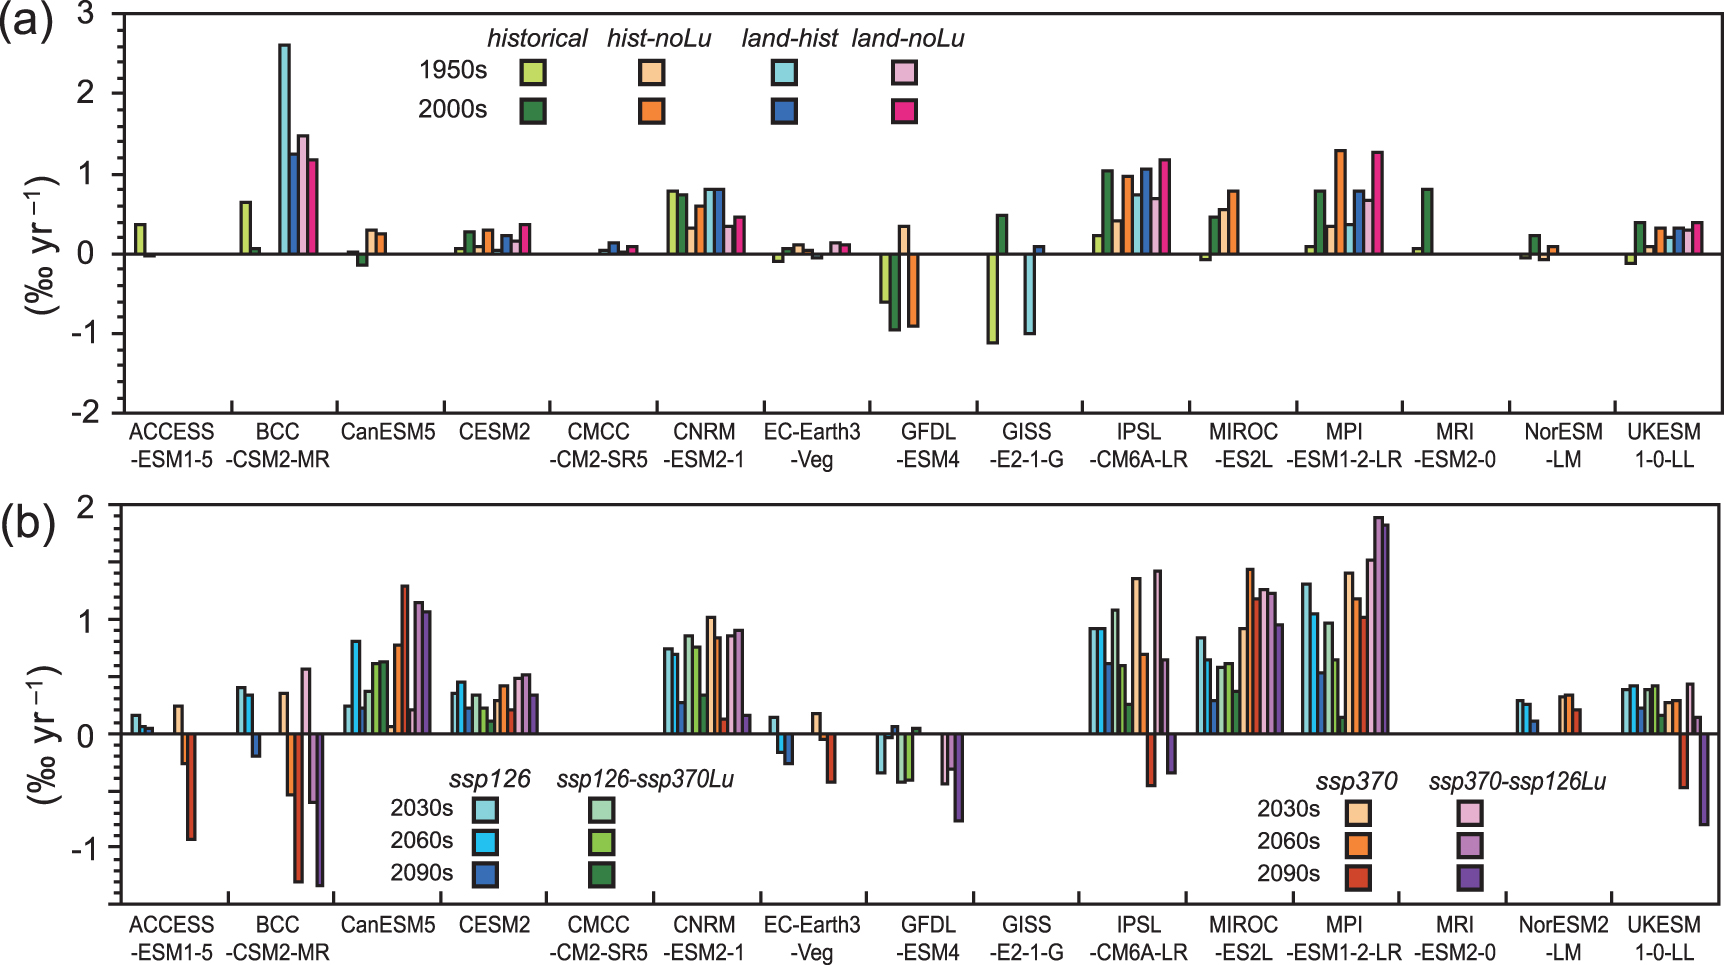
Second, the spatial results showed which regions are likely to respond more sensitively, specifically, to land-use change and land management (e.g. figures S5–S7). For example, MIROC-ES2L simulated increased SOC stocks mainly in Central to East Siberia and East Asia, as well as in parts of Europe and North America. In several areas, somewhat decreased SOC stocks were simulated. In addition, croplands in central North America and West Europe were simulated by several ESMs to accumulate increasing amounts of carbon into the soil, probably as a result of the extra input from crop harvest residues in some models. There geospatial outcomes are worth comparing with field survey results (e.g. Minasny et al 2017), which show high carbon sequestration rates in soils with low initial stock and a dependency on management history.
Third, the simulation results provide supplementary evidence that prevention of deforestation or reforestation can enhance SOC stocks. In the hist-noLu experiment (conducted by all ESMs except CMCC-CM2-SR5; sometimes with no wood harvest), SOC stocks higher by 8–82 Pg C were simulated in 2014 than were simulated in the historical experiment. The ssp126 and ssp370 experiments provide corresponding insights. For example, the ssp126 results imply that SOC total will increase by as much as 11 ± 7 Pg C per million km2 if expansion of cropland and pasture is prevented. Likewise, the land-use change experiments (figure 7) imply that SOC total would differ by 6 ± 8 Pg C (ssp370Lu) and 6 ± 13 Pg C (ssp126Lu) as a result of land-use conversion of 3.7 million km2 to cropland (or of 11.7 million km2 to cropland and pasture).
4. Concluding remarks
This study investigated SOC stocks and their variations simulated in CMIP6 and LUMIP experiments by ESMs. Overall, the results indicate that total SOC is likely to increase, although at a modest rate (about 0.4‰ yr−1). The present results do not do not preclude the possibility of soil carbon sequestration and suggest that SOC may function as a carbon reservoir under future climate change. Additional efforts to improve soil carbon stocks should include not only enhancement of carbon sequestration through soil management (e.g. reducing tillage, applying bio-char, or planting cover crops) but also prevention of soil carbon loss in croplands and vulnerable natural areas (Lal 2004, Paustian et al 2016). These efforts would also provide environmental co-benefits, although the degree of their effectiveness in this regard is still being evaluated (e.g. Poeplau et al 2011, Pugh et al 2015). In addition, these modeling efforts emphasize the importance of monitoring and verification of SOC at global scale (Smith et al 2020).
The impact of different land-use pathways on soil carbon stocks, as demonstrated by the land-use data exchange experiments, is a novel outcome showing the effectiveness of a LUMIP-based analysis. It is still difficult, however, for land schemes to accurately reproduce contemporary physical conditions, chemical processes, and biological interactions (e.g. Luo et al 2016), including land-use impacts. Further model refinement, especially in terms of land-use impact, of ESMs and integrated assessment models used for global change studies is required (e.g. Pugh et al 2015, Nyawira et al 2016, Arneth et al 2017, Pongratz et al 2018, Duarte-Guardia et al 2019). Collaborative work, data analysis, and modeling studies are necessary to obtain more reliable future projections for effective climate mitigation planning and sustainable soil utilization.
Acknowledgments
We acknowledge the World Climate Research Programme, which coordinated and promoted CMIP6 through its Working Group on Coupled Modelling. We thank the various climate modeling groups for producing and making available their model output, the Earth System Grid Federation (ESGF; URL, https://esgf-node.llnl.gov/search/cmip6/) for archiving the data and providing access, and the multiple funding agencies who support CMIP6 and ESGF A I and T H were supported by the Integrated Research Program for Advancing Climate Models, Ministry of Education, Culture, Sports, Science and Technology, Japan. J P was supported by the German Research Foundation's EmmyNoether Program (PO1751/1-1). D M L was supported in part by the RUBISCO Scientific Focus Area (SFA), which is sponsored by the Regional and Global Climate Modeling (RGCxM) Program in 810 the Climate and Environmental Sciences Division (CESD) of the Office of Biological and Environmental Research in the U S Department of Energy Office of Science. B G received support from the French government under the ANR 'Investissements d'avenir' program with the reference CLAND ANR-16-CONV-0003. C D J, A J W, and E R were supported by the Joint UK BEIS/Defra Met Office Hadley Centre Climate Programme (GA01101). D W acknowledges financial support from the Strategic Research Area MERGE (Modeling the Regional and Global Earth System—www.merge.lu.se) and the Swedish national strategic e-science research program eSSENCE (http://essenceofescience.se/). C D J, A J W, V B, S M, D P, and D W acknowledge funding from the European Union's Horizon 2020 research and innovation programme CRESCENDO under Grant agreement No 641816.
Author contributions
A I drafted the paper and T H supervised the analyses. D M L coordinated the LUMIP. All authors contributed significantly to conducting the LUMIP simulations, data preparation, interpretation, and writing of the manuscript.
Data availability statement
The data that support the findings of this study are openly available at https://esgf-node.llnl.gov/projects/cmip6/