

Abstract
Beneficial impacts on wellbeing levels of communities living near Protected Areas (PAs) is a key factor for meeting biodiversity conservation targets. Recent studies suggest that the proximity of communities to a PA influence to a significant extent their wellbeing levels. This paper explores further this argument by analysing data from approximately 800 respondents living inside or near four PAs of international importance in Greece. A Bayesian regression modelling approach testing which factors influence subjective wellbeing was applied. While wellbeing is explained by a combination of factors, the results of the study reveal that it is mainly PAs' social impacts that have an effect on subjective wellbeing levels followed by the geographical location. This finding suggests that more effort needs to be invested in the equal distribution of PAs benefits in order to increase wellbeing and public support for these areas.
Export citation and abstract BibTeX RIS

Original content from this work may be used under the terms of the Creative Commons Attribution 4.0 license. Any further distribution of this work must maintain attribution to the author(s) and the title of the work, journal citation and DOI.
1. Introduction
The key goals of Protected Areas' (PAs) designation have changed significantly in the past years in an attempt to adopt a more holistic approach and re-establish the relationship between people and nature within their boundaries (Palomo et al 2014). Initially PAs were designed based on an 'island' approach often excluding or restricting people from the use of protected natural resources (Karanth and Nepal 2012). However, PAs have now evolved taking into consideration the complexities of the socio-ecological system in which they are established (Palomo et al 2014, Cumming and Allen 2017).
Under this new approach PAs are recognized as the dominant policy in halting the loss of biodiversity while providing significant benefits for communities living near or within them. In this context the Millennium Ecosystem Assessment (2005) emphasized the idea that PAs can provide significant ecosystem services and that these services impact the level of human wellbeing. 20 years later the IPBES also adopted the term nature's contributions to people (NCP) referring to all the possible impacts from nature on people's quality of life (Pascual et al 2017, p. 9).
Social impacts of PAs may include a variety of aspects (Jones et al 2017) such as the effect on wellbeing (Naidoo et al 2019), poverty (Brockington and Wilkie 2015), mental and physical health (Buckley et al 2019), access to natural resources (Rees et al 2013) and cultural activities (Coad et al 2008). Social impacts are important because they influence the level of support for a PA (Bennett et al 2019, Jones et al 2020). These high levels of support are key for the effective management of a PA (Cudney-Bueno and Basurto 2009, Swemmer et al 2017) and the emergence of self-organisation initiatives by locals (Mcginnis and Ostrom 2014).
A large number of studies have been published recently capturing subjective social impacts of PAs (Ban et al 2019, Jones et al 2018, Bennett et al 2019). At the center point of this growing literature is the link with wellbeing (Pullin et al 2013, Mckinnon et al 2016). Recently Ban et al (2019) reviewed over 100 papers on marine PAs and found that half of them have reported a positive influence on wellbeing levels. Taking a step further, Naidoo et al (2019) proved that the proximity to a PA influences wellbeing by analysing data in over 600 PAs of the Global South.
In this paper we build on this recent literature and explore which factors have an effect on wellbeing levels of communities living near PAs. We focus on subjective wellbeing which is a crucial dimension (OECD 2013) that is rarely explored in the PA literature (Mckinnon et al 2016). Our key research question is whether it is the proximity to the PA that influences wellbeing or a combination of factors, including perceived socio-economic impacts of the PA, place attachment and socio-economic attributes. Our analysis is based on data collected through face to face interviews with 772 individuals living near or in close proximity to 4 PAs of international importance in Greece.
2. Methods
2.1. Research areas
Greece is one of the most important countries in Europe in terms of biodiversity including one of the highest numbers of endemic vascular plants in the region (Dimopoulos et al 2016). According to the latest NATURA 2000 Barometer (2020) 27.3% of terrestrial area and approximately 20% of the national marine area is protected under the Natura 2000 network. There is very limited evidence regarding the effectiveness of Greek PAs and their ecological and socio-economic outcomes. The most recent valuation of the effectiveness of Greek PAs was conducted in 2011 (Vokou et al 2014). The study showed that there is no effective management in several of the PAs. Maragou and Christopoulou (2012) have also suggested that NGOs have played a significant role in managing Greek PAs covering existing gaps in the legislative and monitoring framework. It should be noted that the Greek government has recently passed a legislation allowing multiple uses in certain categories of PAs such as the Habitat/Species Management Areas (Law 4685/2020, FEK 92/A/7-5-2020).
Our study explores for the first time how PAs in Greece have influenced wellbeing levels of people living inside or near PAs. In particular, we researched subjective wellbeing levels of local communities living inside or near four Greek PAs covering in total 409 021 hectares (table 1 and figure S1 supplementary material available online at https://stacks.iop.org/ERL/15/114030/mmedia): Prespes National Park (NP), Messolonghi NP, Samaria NP, Tzoumerka NP. These four areas were selected based on the following criteria: a) they are all designated as National Parks thus having a similar designation status; b) all research areas have communities which live inside or near their borders directly impacted by the PA designation and c) human activities within the four parks are similar allowing comparisons between the PAs (these activities are defined in the designation legislation for each area, see also section 2.2). Having similar human activities allowed the research team to use the exact same questionnaire in all areas, especially regarding perceptions of social impacts of the PAs.
Table 1. Description of the four PAs.
| Name of PA | Key designation | Size (ha) | Timeline of designations | Number of participants/total estimated population |
|---|---|---|---|---|
| Prespes | National Park including IUCN categories Ia, Ib, V, and VI | 32 700 | 1974: National Park 2009: establishment of new restrictions zones | 232/1275 |
| Samaria | National Park including IUCN categories Ib, IV, V, VI | 4 850 | 1962: National Park 2020: establishment of restriction zones is currently in process | 140/1343 |
| Messolonghi | National Park including IUCN categoties Ia, Ib, and VI | 33 471 | 2006: National Park | 227/45 048 |
| Tzoumerka | National Park including IUCN categories Ib, II, IV, V, and VI | 338 000 | 2009: National Park | 177/10 491 |
2.2. Survey and sampling
A questionnaire was developed and distributed in communities living inside the four PAs and the surrounding areas (maximum 20 km distance from the PA). Participants were selected randomly based on their location. Initially the total population living inside or near the PA was defined (within the 20 km distance) by identifying all villages in the area. The desired sample size from each village was subsequently determined in order the sample to be geographically representative of the actual population. Researchers visited each village and randomly selected participants to fill in the questionnaire until the defined sample quota was achieved (table 1). Demographics of the sample were checked throughout the selection process in order to ensure that the characteristics of the sample are similar to the ones of the sampling frame. The questionnaire was distributed during summers 2016 (Prespes, Samaria), 2017 (Tzoumerka,) and 2018 (Messolonghi) after it was tested in a small sample of respondents. A total of 818 questionnaires were completed through face to face interviews. Due to missing values in certain indicators the final sample retained for the statistical modeling was 772.
2.3. Questionnaire description
The questionnaire aimed to assess subjective wellbeing along with a number of indicators that may explain wellbeing levels according to existing literature (Pretty 2003, Ostrom 2009, Rollero and De Piccoli 2010, Hommerich and Tiefenbach 2018, Jones et al 2018, Bennett et al 2019) (table 2). The main categories of indicators are explained below.
- a)Subjective wellbeing was measured by asking respondents how satisfied they are with their personal quality of life in a 10-point Likert scale in accordance to the Organisation for Economic Co-operation and Development (OECD) guidelines (OECD 2013) and other large-scale surveys (ESS, 2018, Eurostat 2019) (indicator 1, table 2)
- b)Explanatory parameters included:
- Social impacts: In this paper we adopt the definition of social impacts used by Jones et al (2020) as the intended and unintended social consequences, both positive and negative, which occur because of the designation of a PA and any social change processes invoked by a PA. This definition focuses on the subjective assessment of social impacts and allows each impact to be potentially interpreted both as a cost and benefit depending on the perception of each individual. Three categories of social impacts were assessed in the study each one measured through three questions (indicators 2–4, table 2): impact on social aspects (recreation, social networking, cultural activities), impact on economic aspects (trading, employment and construction industry) and impact on activities directly linked with the use of natural resources (livestock, agriculture/farming and fishing). The final three indicators used in the analysis were calculated via a Principal Component Analysis (PCA) (using SPSS 26.0, see Table S1) reducing the initial nine questions to three factors. This was in order to facilitate the modelling process.
- Frequency of doing specific activities in the national park (e.g. recreation, hunting, fishing, indicator 5, table 2).
- Social networks (frequency of meeting other people, indicator 6)
- Perceptions regarding the environmental quality in the area (indicator 7)
- Socio-economic attributes (gender, age, years of residence in the area, occupation and educational level, indicators 8–11 - information on income was also collected but 50% of respondents refused to provide their details)
- Social trust referring to the level of trust to other people (indicator 12)
- Place attachment referring to how important is the area for the respondents (indicator 13)
- Information regarding the location of the respondents recorded through geographical coordinates of the village of residence (indicator 14)
Table 2. Questions and descriptive statistics.
| Indicator and scale | Question(s) and statistics |
|---|---|
| 1. Subjective wellbeing (10-point Likert Scale (LS), 1: lowest wellbeing, 10: highest wellbeing) | How satisfied are you with your quality of life at the moment? (Mean: 5.71) |
| 2. Impacts on social aspects (10-point LS, 1: Most negative impact, 10: Most positive impact) | How do you consider the PA has impacted you on the following: Recreational activities (Mean: 6.76), Social networking (Mean: 5.89), Cultural activities (Mean: 5.97) |
| 3. Impacts on economic aspects (10-point LS, 1: Most negative impact, 10: Most positive impact) | How do you consider the PA has impacted you on the following: Trading (Mean: 5.52), Employment (Mean: 5.69), Construction industry (Mean: 4.61) |
| 4. Impacts on activities directly linked with the use of natural resources (10-point LS, 1: Most negative impact, 10: Most positive impact) | How do you consider the PA has impacted you on the following: Agriculture (Mean: 4.84), Livestock (Mean: 4.78), Fishing (Mean: 5.13) |
| 5. Frequency of specific activities in the PA (for example for recreation, fishing) | How often do you use the PA? |
| Never (26.8%) | |
| Less than once a month (30.2%) | |
| Once a month (8.1%) | |
| Several times a month (12.6%) | |
| Once a week (2.7%) | |
| Several times a week (5.7%) | |
| Everyday (13.3%) | |
| 6. Social networks (Frequency of meeting) | How often do you meet friends and relatives |
| Never (0.5%) | |
| Less than once a month (5.6%) | |
| Once a month (7.2%) | |
| Several times a month (16.5%) | |
| Once a week (8.9%) | |
| Several times a week (24.9%) | |
| Everyday (36.2%) | |
| 7. Perceived environmental quality (10-point LS, 1: Totally dissatisfied, 10: Totally satisfied) | How satisfied are you with the environmental quality in the area (Mean: 6.66) |
| 8. Age (year of birth) | Year of birth (Average age: 50) |
| 9. Gender | Men (53.7%) |
| Women (46.3%) | |
| 10. Educational level | Up top 6 years (27.4%) |
| Up to 9 years (14.2%) | |
| Up to 12 years (29%) | |
| Up to 14 years (12%) | |
| Up to 16 years (13.8%) | |
| 16 + (3.7%) | |
| 11. Occupation | Farmer/Fisher (15.9%) |
| Private sector (39.9%) | |
| Civil sector (11.4%) | |
| Unemployed (4.6%) | |
| Homemaker (11.3%) | |
| Retired (14.1%) | |
| Student (18 +) (2.6%) | |
| 12. Social trust (10-point LS, 1: You cannot be too careful, 10: Most people can be trusted) | Would you say that most people can be trusted or you cannot be too careful? (Mean: 4.32) |
| 13. Place attachment (10-point LS, 1: Totally disagree, 10: Totally agree) | How much do you agree or disagree with the following statements: 'The area I live in means a lot to me' (Mean: 7.67) |
| 14. Location | Geographical coordinates of the participant's village |
2.4. Data analysis
We run Bayesian regression models using the WinBUGS software (Lunn et al 2000) to identify the parameters determining subjective wellbeing. All 13 explanatory parameters (indicators 2–14, table 2) were introduced in the models. Markov chain Monte Carlo (McMC) techniques were used for the Bayesian inference and parameter estimation. In order to explore whether the location of respondents also has an impact on wellbeing, a spatial component was introduced to the regression models. Suitable kernel functions (Duncan et al 2017) were used approximating the distance of the respondent's village from the centroid of each PA.
We adopted a g-prior type of approach for the specification of prior densities in the parameters of the covariates of interest. This was in order to avoid the assumption that fixed-effects covariates are independent. This allowed us to account for potential correlations among the covariates of the regression model when selecting statistically significant covariates. The Zellner's informative g-prior (Zellner 1986) was utilized, being appropriately adjusted for the generalized linear models (i.e. Poisson and negative binomial) (Bové and Held 2011).
A total of nine models were fitted to the data. These models compared three specifications under three variations. Specifications included the Gaussian distribution (suitable for continuous response variables), the Poisson distribution and the negative binomial (NB) distribution (the latter two being more suitable for Likert type data) (Lindén and Mäntyniemi 2011, Cameron and Trivedi 2013, Malesios et al 2018). The three variations included a model ignoring the spatial information (non-spatial), except for the categorical variable of the PA, a model with spatial component specification via an inverse distance power function (spatial 1) and a model with a spatial component specification via a negative exponential decay function (spatial 2). Since the inverse distance power function has a fatter tail when compared to the negative exponential function, these two alternative specifications allowed us to test longer vs. shorter distance effects on wellbeing, depending on which of the two candidate functions had better fit to the data. Model selection was carried through the use of the deviance and the deviance information criterion (DIC) (Spiegelhalter et al 2002). A detailed description of the modeling approach is included in the supplementary materials.
Finally, for the visual representation of potential spatial patterns in subjective wellbeing, an inverse distance weighting (IDW) methodology was used (i.e. a deterministic interpolation method that derives the value of a variable at a new location using values obtained from known locations) with the QGIS software (QGIS, 2015).
3. Results
3.1. Factors influencing subjective wellbeing
The best model was the one which assumed a normal distribution for subjective wellbeing (Gaussian) including a spatial component that accounted for longer distance effects (inverse distance decay function—spatial 1 model) (table 3). The evidence from applying the model comparison methodology in this paper suggests that a modeling strategy based on the use of the Gaussian distribution works well and provides robust results, when compared to the Poisson and NB specifications. This outcome comes in contrast with the widely accepted argument that the Poisson or NB models would probably work better for this type of data (Greene 2008). A possible explanation for this outcome is the presence and/or magnitude of skewness of the dependent variable (Malesios et al 2018).
Table 3. Goodness-of-fit statistics for alternative models (dependent variable: subjective wellbeing).
| Model | Mean deviance ( ) ) | DIC |
|---|---|---|
| Gaussian (non-spatial) | 3156.24 | 3218.13 |
| Gaussian (spatial 1) | 3155.23 | 3147.49 |
| Gaussian (spatial 2) | 3157.54 | 3219.34 |
| Poisson (non-spatial) | 3384.98 | 3426.85 |
| Poisson (spatial 1) | 3384.58 | 3391.15 |
| Poisson (spatial 2) | 3384.55 | 3425.03 |
| NB (non-spatial) | 3407.65 | 3448.32 |
| NB (spatial 1) | 3405.56 | 3437.08 |
| NB (spatial 2) | 3385.94 | 3426.41 |
Upon selection of the best fitted model, to test the quality of its fit we look at the normal probability plot (QQ-plot) of the residuals (see figure S2 in the supplement). Inspection of Figure S2 indicates that there are only few moderate deviations from normality. We also checked for autocorrelation through visual inspection of autocorrelation plots and found acceptable autocorrelation levels for all parameters.
The parameters estimates of the best selected model (Gaussian spatial 1), after the implementation of the g-prior selection process, are described in table 4 (including also the corresponding 95% credible intervals, see also figure 1). Similar results in terms of covariate selection have been observed in all remaining fitted candidate models. The most important indicators determining wellbeing are perceived impacts on social aspects (indicator 2) and perceived impacts on activities directly linked with the use of natural resources (indicator 4) (table 4). Other indicators that explain wellbeing, but to a lower extent, are the impact on economic aspects (indicator 3), place attachment (indicator 13) and social trust (indicator 12).
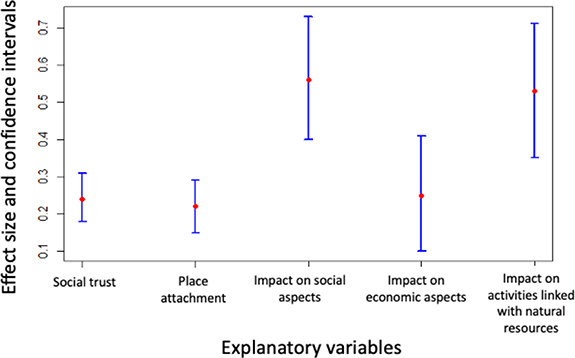
Figure 1. Effect size along with 95% credible intervals for the estimated parameters of explanatory variables in the Bayesian regression model.
Download figure:
Standard image High-resolution imageTable 4. Parameter estimates for the best selected model [Gaussian, Spatial Model 1] (5% level of significance) and 95% credible intervals.
| Covariate | Estimate | 95% credible intervals |
|---|---|---|
| Intercept | 2.84 | (2.17, 3.45) |
| Region (Ref. category: PRESPES) | ||
| Samaria | 1.30 | (0.52, 2.08) |
| Tzoumerka | −1.67 | (−2.19, − 1.18) |
| Messolonghi | n.s. | – |
| Social trust | 0.24 | (0.18, 0.31) |
| Place attachment | 0.22 | (0.15, 0.29) |
| Impact on social aspects | 0.56 | (0.40, 0.73) |
| Impact on economic aspects | 0.25 | (0.10, 0.41) |
| Impact on activities directly linked with the use of natural resources | 0.53 | (0.35, 0.71) |
| Random effect (village of respondent) | 0.50 | (0.18, 1.03) |
| Lambda | 6.35 | (0.22, 22.16) |
n.s.: non-significant
Regarding the role of the geographical location on wellbeing levels (indicator 14), the statistical significance of the Spatial 1 variation in all three specifications is an indication of positive effect on wellbeing levels of those residing closer to the center of the PA than for those further apart. The comparative better fit of the spatial component models including the inverse distance specification, in comparison to the alternative inverse exponential component, suggests that the spatial distance effect is stronger in long distances, in comparison to shorter distances.
3.2. Wellbeing and geographical location
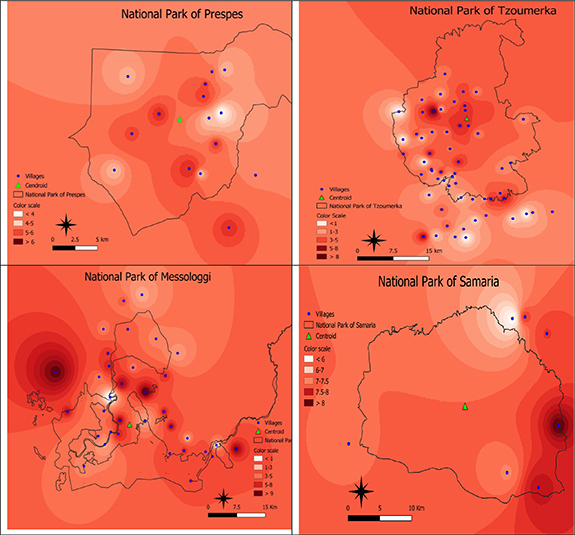
According to the IDW methodology spatial dependence exists between subjective wellbeing and the location of the respondent in relation to the PA. The obtained estimates are visualized via heatmaps for each PA in figure 2. They include the locations of the villages of respondents along with the exact location of the PAs' centroid. Darker colour in the maps represent higher wellbeing levels. The results reveal that in all research areas the location of the individual in relation to the PA plays a significant role in subjective wellbeing. This connection is particularly evident in Prespes and Tzoumerka where wellbeing levels are reduced as participants live further out of the center of the PA.
Figure 2. Spatial mapping of magnitude of responses on wellbeing for the 4 PAs.
Download figure:
Standard image High-resolution image
3.3. Perceived socio-economic impacts of the PA
Perceived impacts are the most significant predictor for subjective wellbeing (table 4). People who consider that they have benefited more from the PA (perceived positive impacts) also feel that they have a better quality of life compared to those who regard that the PA has impacted them in a negative way. The strongest connection is noted with the impact on social aspects, such as cultural and recreational activities, and the impact on activities directly linked with the use of natural resources. When exploring differences between the research areas these impacts differ significantly (supplementary material tables S2–S3). In Messolonghi people perceive impacts in a more positive way compared to other PAs. Highest scores are observed for the impact on recreational activities in Tzoumerka and Samaria revealing that the PA has been successful in protecting local cultures. The impact on activities directly linked with the use of natural resources is the one that has the lowest scores with two of the PAs (Tzoumerka and Prespes) being particularly negatively affected.
3.4. Socio-economic attributes
Regarding factors which are not directly connected with the PA social trust is positively associated with wellbeing levels (beta = 0.24, p-value < 0.05, table 4). People who tend to trust others have higher levels of wellbeing. Place attachment has also a positive effect (beta = 0.22, p < 0.05) meaning that those who are more 'attached' to the area they have higher levels of wellbeing. The socio-economic profile of the respondent does not play a significant role in explaining variations in wellbeing levels.
4. Discussion and policy recommendations
This study contributes in current debates regarding the impact of PAs on human wellbeing (Naidoo et al 2019, Bennett et al 2019). It goes beyond the state-of-the-art testing whether it is the proximity to the PA that influences wellbeing (Naidoo et al 2019) or a combination of factors, including location, socio-economic impacts from the PA and a person's demographic profile. The results also emphasize the importance of subjective measurements both with regards to wellbeing levels (OECD 2013) and perceived impacts (Jones et al 2018, Allendorf et al 2019).
Our data analysis reveals that people who live near a PA report higher subjective wellbeing levels confirming the findings of Naidoo et al (2019). However, the impact that the PA has on certain socio-economic aspects is an ever more important indicator in explaining wellbeing. A number of other factors not connected with the PA also influence wellbeing including place attachment and social trust. This result raises the issue of variations in terms of PAs' socio-economic impacts at individual level. People who consider that they have received higher positive impacts (benefits) report a higher quality of life. This finding highlights the unequal distribution of social impacts of a PA across individuals and social groups (Ward et al 2018).
The paper also emphasizes the importance of subjective assessments in relation to the link between PAs and wellbeing. Although the argument for the importance of capturing perceptions of local communities has been recently reiterated (Jones et al 2018, Allendorf et al 2019, Bennett et al 2020) existing large-scale studies are mainly focused on objective indicators of wellbeing (Naidoo et al 2019) and secondary data (Bonet-García et al 2015). Thus, there is significant lack of evidence regarding the impact of PAs on subjective wellbeing and how this relation may influence the level of support for PAs.
For practitioners, our findings lead us in two main propositions. First, perceived impacts can be used to understand wellbeing levels across communities living near PAs. Although it is costly to undertake subjective assessments through surveys and face to face interviews this study shows that they are key in order to understand how a PA impacts local communities and design future policies. Second, of equal importance is the distribution of impacts (Ward et al 2018). Several tools exist that aim to capture aspects of social impacts and wellbeing such as SAPA (Franks et al 2018). However, capturing the distribution of impacts is not currently the main focus of these methodologies. Developing new tools exploring issues of social equity (Zafra-Calvo et al 2019, Bennett et al 2020) should be a key aim for practitioners in the future. Capturing the distribution of impacts can facilitate the process of identifying parts of the society who are receptors of higher negative impacts allowing practitioners to put in place mitigation measures and achieve a balance in wellbeing levels across different social groups.
5. Conclusions
High levels of wellbeing across communities living near PAs is a key issue in order to meet biodiversity conservation targets while protecting people's livelihood. This paper proves that wellbeing of people near PAs can be explained by a combination of socio-economic parameters. However, the location in relation to the PA and perceived impacts from the establishment of the PA on socio-economic aspects are the most important predictors for subjective wellbeing. This result reveals that exploring the distribution of PAs social impacts should be a priority for practitioners as it has an effect on wellbeing levels which in turn play a significant role for public support. The paper makes the suggestion that large scale studies should be focused also on subjective measurements assisting in the co-production of knowledge for optimum ways of co-managing PAs across the world.
Acknowledgments
Part of the work in this paper has received funding from the European Research Council (ERC) under the European Union's Horizon 2020 research programme (Project FIDELIO, grant agreement no. 802605) (https://.fidelio.landecon.cam.ac.uk). The authors would also like to thanks the following researchers contributing in the collection of empirical data: I. Baltouna, A. Frantzeskou, E. Ioannidou, R. Kanakaraki, and I. Kazana. The collection of data was completed in accordance to the ethics regulations regarding social data gathering of the institutions involved in this research.
Data availability statement
The data that support the findings of this study are available upon reasonable request from the authors.