

Abstract
We explore the social, ecological, economic, and technical dimensions of sustainable river infrastructure development and the potential benefits of coordinating decisions such as dam removal and stream crossing improvement. Dam removal is common practice for restoring river habitat connectivity and ecosystem health. However, stream crossings such as culverts are often 15 times more abundant than dams and may pose similar ecological impacts. Using multi-objective optimization for a model system of 6100 dams and culverts in Maine, USA, we demonstrate substantial benefit-cost improvements provided by coordinating habitat connectivity decisions. Benefit-cost efficiency improves by two orders of magnitude when coordinating more decisions across wider areas, but this approach may cause inequitable resource distribution. Culvert upgrades improve roadway safety and habitat connectivity, creating cost-effective opportunities for coordinating and cost-sharing projects between conservationists and safety managers. Benefit-cost trends indicate significant overlaps in habitat and safety goals, encouraging flexible stakeholder collaborations and cost-sharing strategies.
Export citation and abstract BibTeX RIS
1. Introduction
There is a growing recognition of the need for infrastructure development practices that promote sustainability, global prosperity, human well-being, and healthy natural systems (United Nations 2015, Thacker et al 2019). To achieve this goal, we need to develop an integrated framework for assessing trade-offs and synergies among social, ecological, economic, and technical goals (Grabowski et al 2017, Markolf et al 2018). For example, Palmer et al (2015) identify the benefits of sustainable river infrastructure design for addressing ever growing social and environmental water management goals, including flood risk mitigation and freshwater habitat connectivity. It can be challenging to develop coordinated frameworks that address these water goals because they require interdisciplinary, systems-based knowledge of river infrastructure decisions and their dynamic, multifaceted effects within watersheds (Poff et al 2016, Neeson et al 2018, Roy et al 2018, Song et al 2019). One promising strategy for evaluating coordinated frameworks is to focus on data-rich, regional-scale model systems in which potential trade-offs and synergies among these needs can be examined (Sun and Scanlon 2019).
Here we assess the potential benefits of coordinating river infrastructure decisions informed by stakeholder engagement, big data analytics, and scenario analysis using multi-objective optimization methods. Dams and road culverts are particularly common river infrastructure features in developed watersheds, providing different societal benefits but with potential ecological impacts (Neeson et al 2018). Dams harness river flow to produce hydropower and water storage. Though many dams contribute to social and economic well-being (Hunter 1979), even small dams obstruct the natural flow of rivers and fish migration. This adversely impacts freshwater and marine ecosystems in ways that also diminish cultural, sustenance, and economic benefits to local communities (Limburg and Waldman 2009, Hall et al 2012, Fox et al 2017, Lange et al 2019). Dam removal has therefore proven to be an ecologically effective, large-scale component of river restoration (Gosnell and Kelly 2010, Opperman et al 2011).
Culverts are prevalent features that often co-occur with dams, particularly in upstream tributaries. Unlike dams, culverts are designed to safely pass surface water downstream, under road networks, to prevent flooding and bank erosion. While some dams can persist in a landscape for centuries, culverts typically have an operational lifespan of 50 years or less and may be more susceptible to washout failure during extreme flooding (FHWA 2012). Culverts that are poorly placed, constructed, or undersized for local hydrologic conditions (figure 1(a)) may underperform and limit freshwater connectivity, particularly if the culvert hangs above stream grade (Jackson 2003, Poplar-Jeffers et al 2009, Thorne et al 2014). However, a serious societal issue with underperforming culverts is road traffic safety and compromised access to critical services (e.g. hospitals, schools) caused by flooding and structural failure (Perrin and Dwivedi 2006). Current federal and state policies may mitigate these impacts by requiring replication of natural flow conditions through culverts, removing artificial flow barriers by upsizing culvert diameter, maintaining local stream grade, and embedding circular culverts (FHWA 2012). However, there is a backlog of underperforming culverts yet to be replaced by these policies (Perrin and Dwivedi 2006).
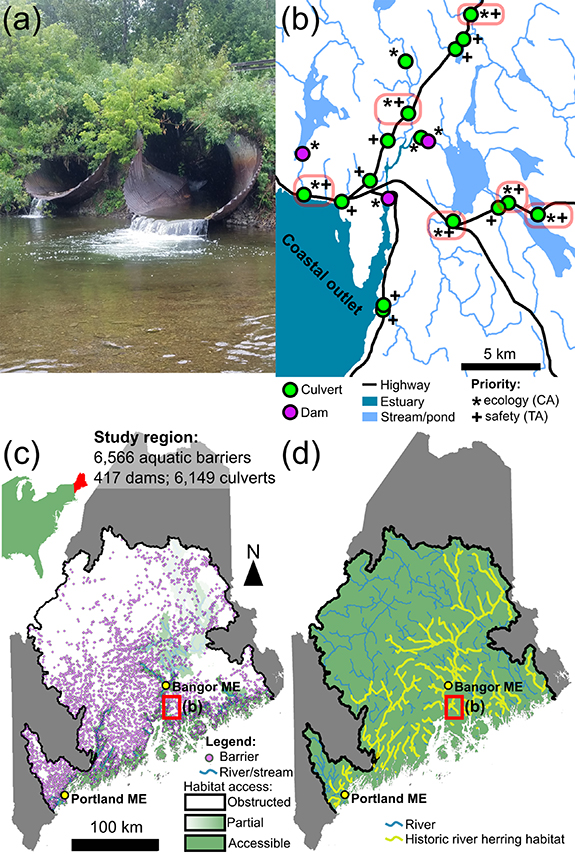
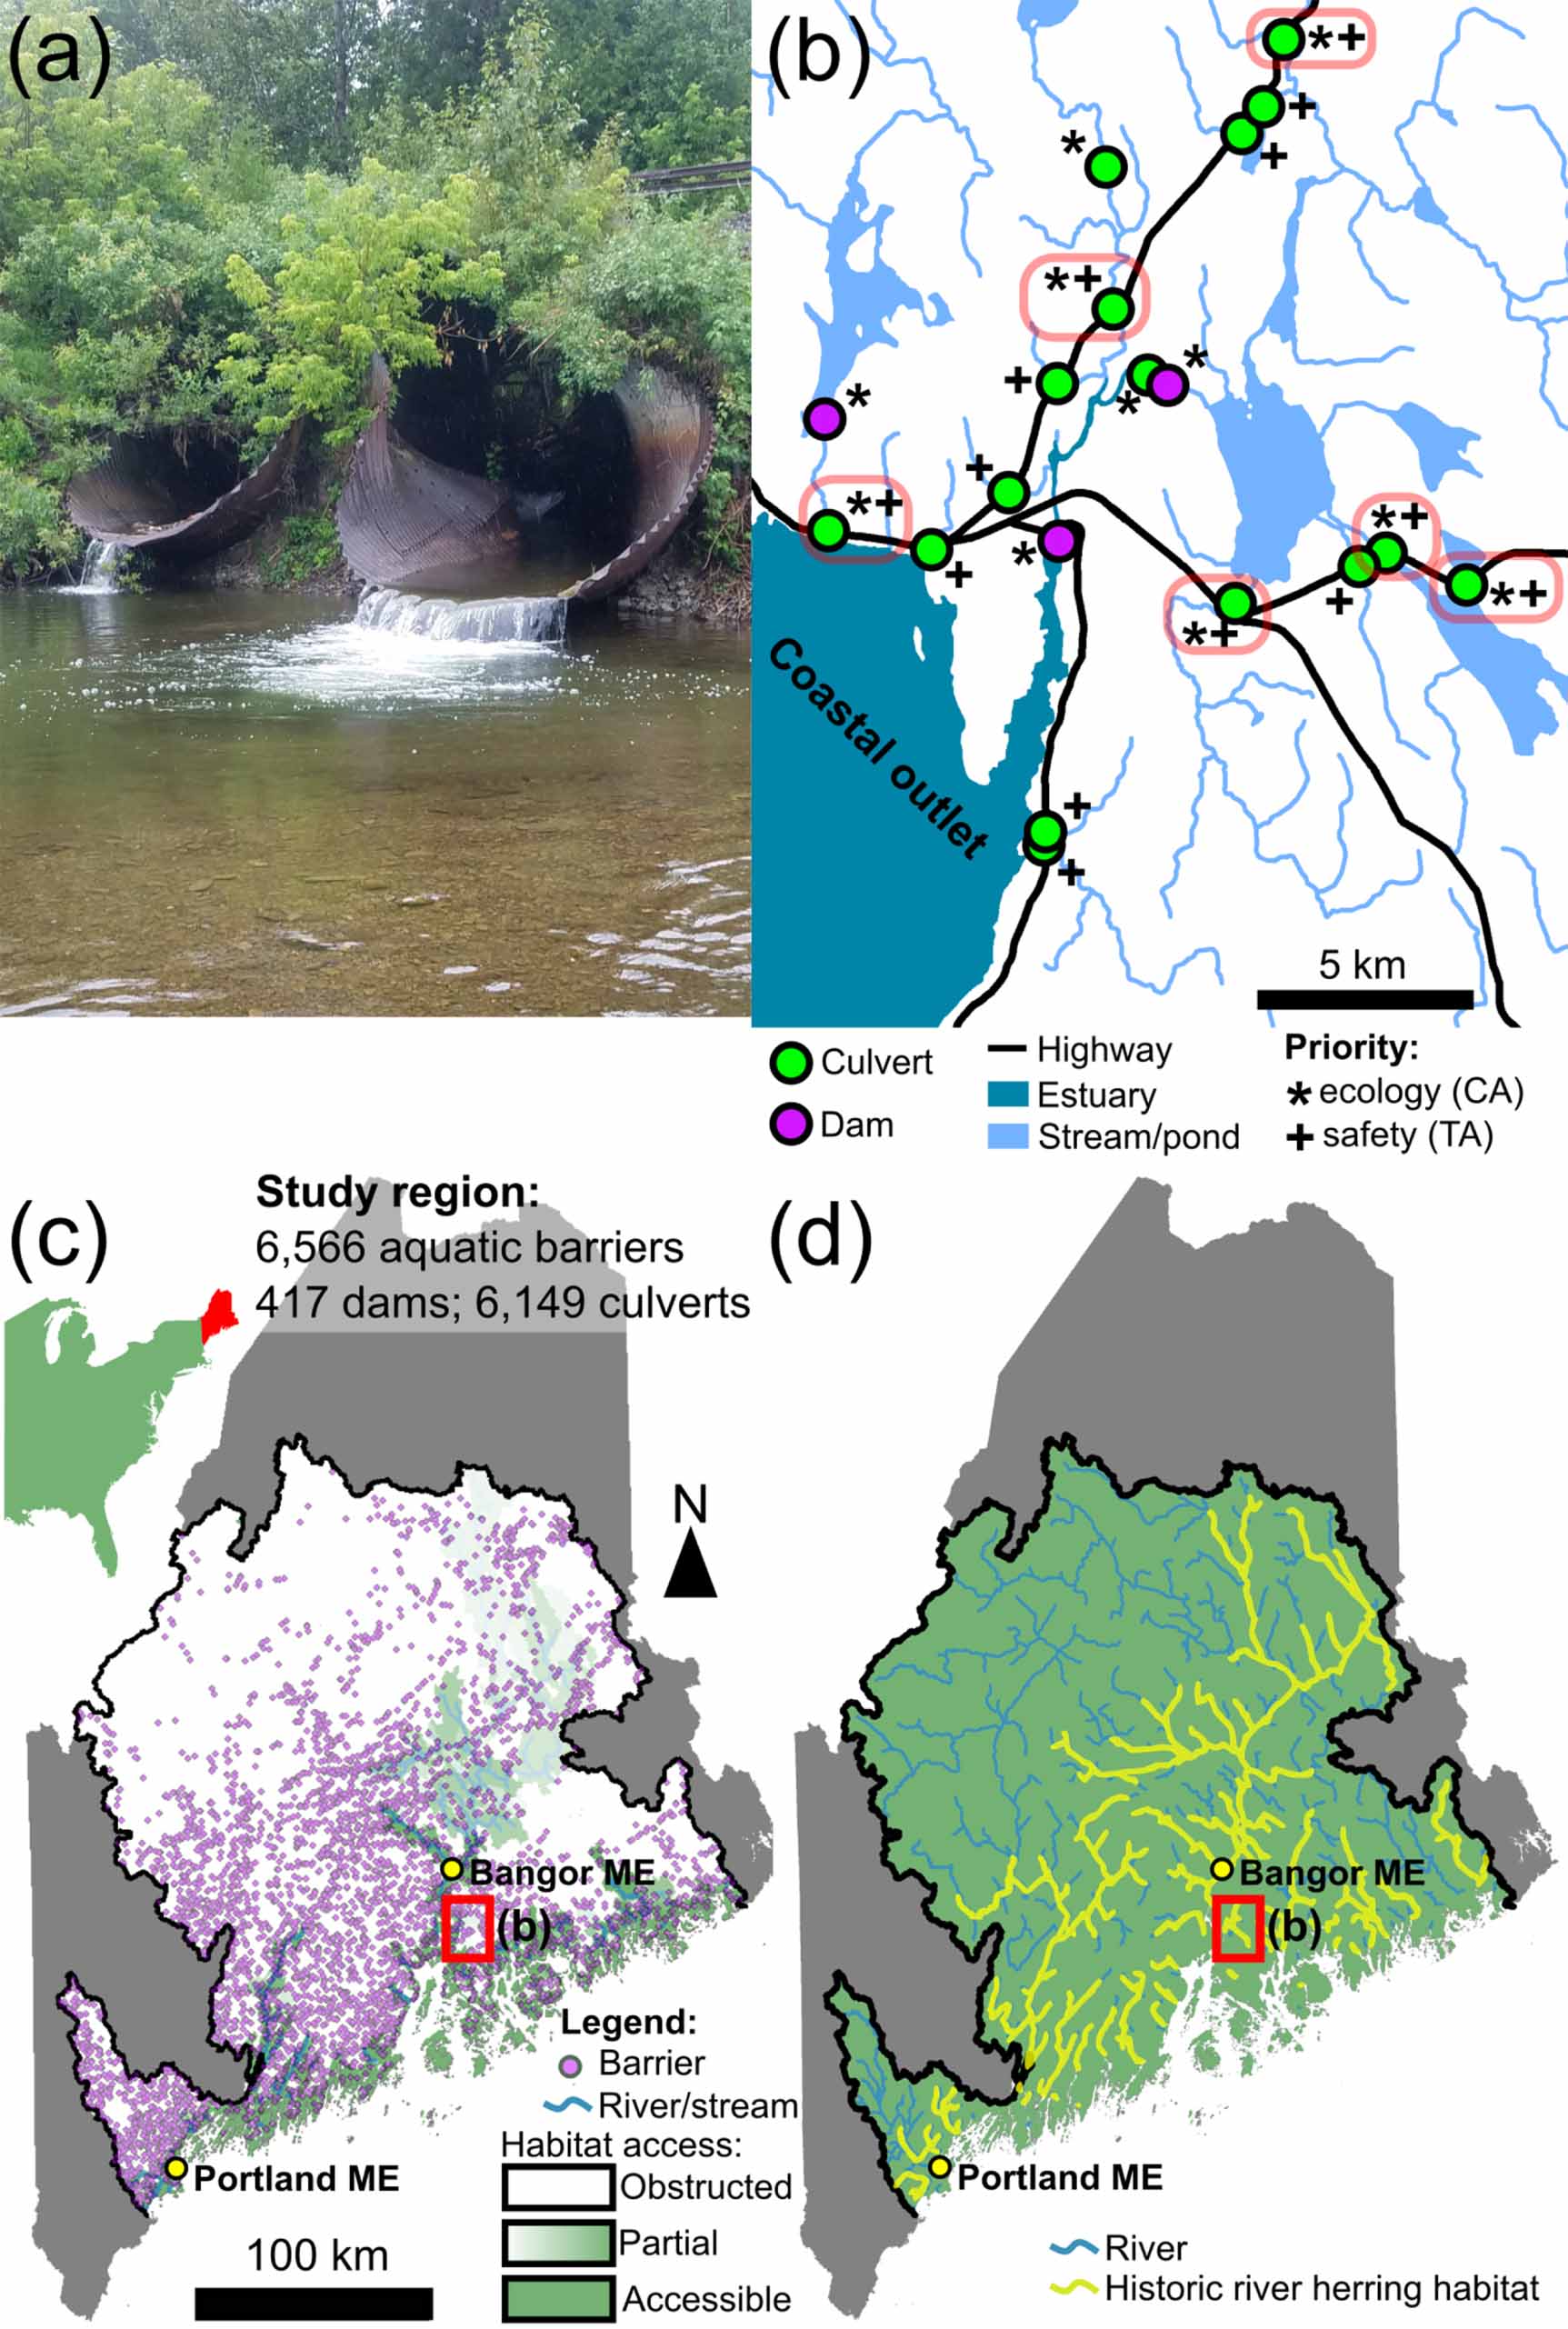
Figure 1. (a) underperforming culverts block migration and pose safety risks (photo credit: Sean Smith). (b) Closeup of coastal streams (center coordinates: 44.58−68.78); dams tend to occur downstream or at pond outlets, culverts are more abundant and occur along tributaries, occasionally blocking historic habitat. Culverts located on priority highways are more likely to be replaced by TSMs (+), while culverts with abundant upstream habitat are more likely to be replaced by FCMs (*), and there are instances where both priorities overlap (red ovals). Culverts with low ecology/safety priority are hidden. (c) Current barriers and habitat connectivity in study region. (d) River herring habitat extent.
Download figure:
Standard image High-resolution imageTransportation safety managers (TSMs such as state Departments of Transportation) generally assign culvert replacement projects on public roads based on needs for road safety improvements that maintain access to critical services and minimize traffic incidents. Culvert failure disrupts transportation networks and negatively impacts a region's abilities to meet time-sensitive needs for trade, commerce, and social services (Espinet et al 2016). The additional benefits for river restoration are acknowledged by TSMs and are used to guide necessary permitting processes (FHWA 2012) but are not used as priority selection criteria for replacement projects. The total number of culverts replaced each year by TSMs depends on budget size within a jurisdiction. To a lesser extent, freshwater conservation managers (FCMs such as environmental agencies and non-governmental organizations) supply funding for specific culvert replacements that prioritize habitat connectivity restoration.
Restoring habitat connectivity is a proven approach to facilitate the migration of sea-run fish. Dam removal and culvert replacement practices can be central to freshwater conservation initiatives. Previous modeling work indicates that coordinating these decisions across watershed scales provides greater resource efficiency than individual decisions (O'Hanley and Tomberlin 2005, Neeson et al 2015, Roy et al 2018, Martin 2019), with a growing number of examples in practice (Gosnell and Kelly 2010, Opperman et al 2011, Chesapeake Executive Council 2014). Further, such coordinated approaches may also encourage broader investment in sustainability solutions to infrastructure planning through policy change in general (Endo et al 2018). But despite the synergistic safety and ecological benefits that culvert replacements provide (figure 1(b)), coordination of these replacements with dam removal is still uncommon, or poorly reported, due to potentially contrasting management practices governed by different authorities. Standard collaborative methodologies between TSMs, FCMs, or other potential stakeholders are noteworthy exceptions to the norm (Poff et al 2003, Januchowski-Hartley et al 2013, Owen and Apse 2014, Neeson et al 2018, Rees et al 2018, Linke et al 2019). Further, few policy incentives exist that encourage watershed-scale decisions, posing further logistical challenges (Owen and Apse 2014). Another challenge is in collecting, validating, and aggregating large, diverse datasets necessary to explore the benefits of coordinated decisions (Roy et al 2018).
Here we analyze how river restoration efforts can be more cost-effective when dam and culvert management decisions are coordinated over watershed scales and when TSMs and FCMs together account for feasible safety/ecology cost-sharing synergies. Combining culvert improvements with dam removal may help align and streamline funding and planning practices by FCMs and TSMs. Merging theory provided by Neeson et al (2018) and Roy et al (2018) we use a series of benefit-cost curves to explore the potential for reconnecting historic habitat based on hypothetical dam and culvert decision scenarios. We then use benefit-cost and multicriteria trade-off analyses to identify potential cost-sharing opportunities based on watershed-scale decision coordination. Further, we address the scale-dependency of benefit-cost trends and mitigation of potential equity challenges associated with heterogeneous resource distribution.
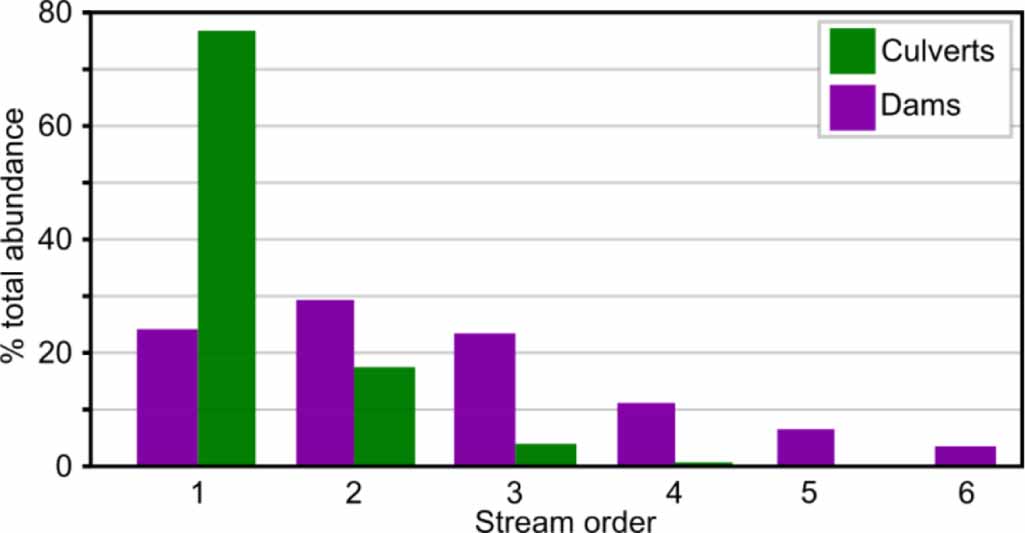
We explore development of these strategies using a model system in Maine, USA and develop general observations for other regions and systems-based applications with similarly diverse physiographic and social-ecological conditions. Infrastructure density varies significantly in Maine, ranging from one dam or culvert every 0.4 stream km in the south to one every 6.5 stream km in the north (figure 1(c) and (d)). Local dam removals suggest ample potential for further improving habitat connectivity in this region. For example, dam removals and modifications in the Penobscot and Kennebec Rivers (Crane 2009, Opperman et al 2011) led to population increases in diadromous species of river herring (i.e. alewife (Alosa pseudoharengus) and blueback herring (A. aestivalis)) from a few thousand to several million (Hall et al 2012, MDMR 2019). However, this region exhibits a dominant spatial trend where culverts are often 15 times more abundant than dams but located in upstream tributaries (figures 1(b), 2), limiting the true extent of habitat connectivity gained by downriver dam removal. The diverse conditions in northeastern USA are generally applicable to other geographies with similar social-ecological contexts and limited resources, from historically overdeveloped landscapes to new infrastructure projects in developing countries (Thacker et al 2019).
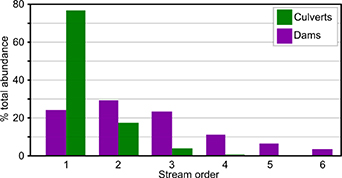
Figure 2. Relative abundance of culverts and dams categorized by Strahler stream order; culverts are most common on lower order streams, generally upstream of dams that are distributed more broadly. Though stream order scaling may vary between natural and urbanized stream corridors, culverts remain a dominant headwater feature.
Download figure:
Standard image High-resolution image2. Methods
We sought to optimize coordinated dam and culvert decisions by modeling responses of three criteria: functional habitat area for river herring (measured as connected habitat in km2), road safety (years of remaining service life), and project cost ($USD 2016). River herring populations are often a reliable indicator of freshwater and marine ecosystem resilience due to their sensitivity to habitat connectivity (Limburg and Waldman 2009). A multi-objective genetic algorithm is used to identify the set of efficient decision scenarios for each analysis (Deb et al 2002). We account for changes in criterion values based on decisions to keep or remove dams and replace culverts, but do not consider dynamic responses to these decisions (Song et al 2019). See supplemental (available online at https://stacks.iop.org/ERL/15/104054/mmedia) for detailed explanations of all numerical methods and data.
We estimate functional habitat area for returning river herring as the product of habitat area and degree of accessibility compounded for downstream dams/culverts (Roy et al 2018): ![$Habitat = \mathop \sum \limits_{i \in {n_{dc}}} \left[ {{h_i}\mathop \prod \limits_{j \in {n_{dci}}} \left( {{p_j}} \right)} \right]$](https://content.cld.iop.org/journals/1748-9326/15/10/104054/revision2/erlabad58ieqn1.gif) ; where
; where  is the set of all dams/culverts, indexed by
  ;
;  is the set of all dams/culverts downstream and including
  , indexed by
  ;
;  is the amount of habitat segmented above dam/culvert
  ; and
; and  is the product of upstream and downstream passage probability through downriver dam/culvert
  . Our model assumes that all dam removals and culvert replacements completely reconnect habitat up to the next upstream dams, culverts, and/or natural barriers. We report functional habitat area in km2 and measure improvement as a percentage relative to current functional habitat. We base habitat calculations on expert accounts of historic river herring spawning and rearing habitat (Houston et al 2007). For dams we use information on the type of fish passage design and empirical estimates of passage for upstream and downstream migration (Noonan et al 2012). For culverts, we first determine if it is passable based on field surveys, indicating if the culvert hangs above stream grade (figure 1(a)) (Martin 2019). For passable barriers, we estimate probability of passage by modeling spawning season flow velocity through the length of each culvert barrel and calculating the percentile of river herring with swimming capacities exceeding flow conditions (Haro et al 2004).
We estimate road safety as the operational lifespan for each culvert, weighted by the priority level of the overlying road. We do not include dams in our assessment of road safety. The mean weighted operational lifespan (WOL) is calculated using all culverts in the analysis. Our analysis limits WOL by one of two possible reasons. First, failure may occur due to poor structural condition of the culvert. Second, stream discharge may frequently exceed the maximum discharge capacity for the culvert, leading to overtopping events that flood roads and heighten the potential for road washout/failure (Truhlar et al 2020). We estimated WOL using the equation  ; where
  is road priority, based on average daily traffic and access to critical services;
  is the annual recurrence interval of an overtopping flood event; and
  is the predicted remaining operational lifespan of the culvert based on structural condition surveys (Perrin and Dwivedi 2006). Road priority and structural condition are reported by Maine Department of Transportation. The recurrence of overtopping events is based on relating peak flow regressions to the maximum discharge capacity of the culvert, calculated assuming submerged inlet flow control (FHWA 2012). This approach uses available data on culvert dimensions to estimate a common, conservative mode of flow through submerged culverts. Though numerous other factors influence flow conditions, this simple approach supports our focus on general watershed-scale trends. We take the minimum of these values to provide a conservative WOL estimate. We refer to high-risk culverts as those with WOL ≤5 years and are likely to be replaced by TSMs. Our model assumes that each culvert replacement is adequately designed to restore operational lifespan to 50 years under current flood recurrence trends. Though these statistical approaches tend to overestimate flows (Rees et al 2018) with standard error potentially reaching 48% (Hodgkins 1999, Lombard and Hodgkins 2015), our objective is to demonstrate the efficacy of our benefit-cost approach using available data, with future opportunities to incorporate robust physical studies.
We calculate costs for replacing culverts based on the required diameter, length, road type, and additional material and construction costs (NEEFC 2011). Costs are reported in US dollars for the year 2016. New public road culverts are designed with a diameter 1.2 times local bankfull width at stream grade (FHWA 2012). Private or municipal culverts have relaxed requirements. We estimate dam removal cost using the Blachly and Uchida (2018) linear regression model. However, we recognize these infrastructure costs may be highly variable in practice.
3. Results
3.1. Coordinated ecosystem and infrastructure decisions
We show results of coordinated ecosystem and infrastructure decisions in figure 3(a). Despite significant restoration efforts in northeastern USA (Opperman et al 2011), accessible river herring habitat is still less than one-sixth of total historic area (S0). Under a hypothetical scenario in which all underperforming culverts are replaced to eliminate passage barriers, habitat connectivity increases by 39% relative to current conditions (S1). Removing all dams while leaving culverts in their current condition increases connectivity by 364% (S2). Combining all dam removals and culvert upgrades increases connectivity by 594% (S3). These results suggest that, though dam removal effectively restores habitat connectivity, ignoring culvert replacements in this process reduces net benefit by approximately one third of all historic habitat. However, coordinating all dam removal and culvert replacement projects nearly doubles cost. Under a more conservative $10 M budget scenario, coordinating dam and culvert decisions would increase connectivity to 147% (S4), or 33 percentage points greater than decisions restricted to dam removal (S5). Increasing this budget to $100 M increases connectivity to 421% (S6), or 96 percentage points above decisions restricted to dam removal (S7). In addition to fewer habitat benefits, dam-limited management decisions provide no benefit for road safety, with no potential collaborative opportunities with TSMs.

Figure 3. (a) Cost-benefit curves for river herring functional habitat, efficiency is greatest when coordinating infrastructure decisions. Scenario S0 represents current conditions; all other scenarios are hypothetical as described in the text. (b) Plot of three-dimensional trade-offs between habitat (y-axis), safety (x-axis), and cost (color contours), developed from 17 765 unique management scenarios (see supplemental). Diminishing marginal returns indicated by cost contour spacing. Scenario S0 represents current conditions; all other scenarios are hypothetical as described in the text. Black dots indicate path of habitat prioritization by coordinated dam removal and culvert replacement from figure 2(b). Green dots indicate path of safety prioritization by culvert replacements.
Download figure:
Standard image High-resolution imageDecisions that coordinate dam removal and culvert replacement provide synergistic ecosystem, safety, and cost benefits, as shown in figure 3(b). Our analysis indicates that ecosystem and safety improvements are linearly and positively related (Pearson correlation of 0.763), while marginal improvements diminish as cost increases. Cost contours are convex, and each apex represents a relatively even balance between habitat and safety at different budget amounts. For example, a $100 M even-balance decision (S8) would increase connectivity by 267% and improve mean WOL by 124% relative to current conditions, because of 30 dam removals and replacement of 1252 high-risk culverts (2484 total culverts).
There are multiple decision scenarios that shift away from the even-balance trend and may be advantageous depending on the degree of preference between ecosystem and safety goals (figure 3(b)). We return to our scenarios that optimize habitat connectivity and cost minimization but lack safety prioritization. Under our $100 M budget scenario (S6) this again restores 421% habitat connectivity but only improves mean WOL by 26%, facilitated by 68 dam removals and replacement of 294 high-risk culverts (593 total culverts). In contrast, safety-limited prioritization with the same budget (S9) improves mean WOL by 141% while habitat restoration is limited to 11%, covering 0 dam removals and 1494 high-risk culvert replacements (2918 total culverts).
There are many additional scenarios providing trade-offs between these single-priority examples with gradients between habitat, safety, and cost. For our $100 M scenarios, the upper limb of this curve has an average gradient of 7 km2 habitat per 1 year of mean WOL improvement. The average opportunity cost increases along the lower limb of this curve to 115 km2 habitat per year of mean WOL improvement. Equal-preference scenarios occur at the threshold between these gradients. As these curves become more convex at higher cost levels, equal-preference management scenarios begin to provide greater cumulative benefit, or greater combined improvements in safety and habitat, over single-priority scenarios. However, single-preference management decisions invariably provide greater individual improvement for the criteria of interest. Further, the true value of these trade-offs depends primarily on how they are interpreted by decision-makers.
3.2. Multiscale benefit-cost
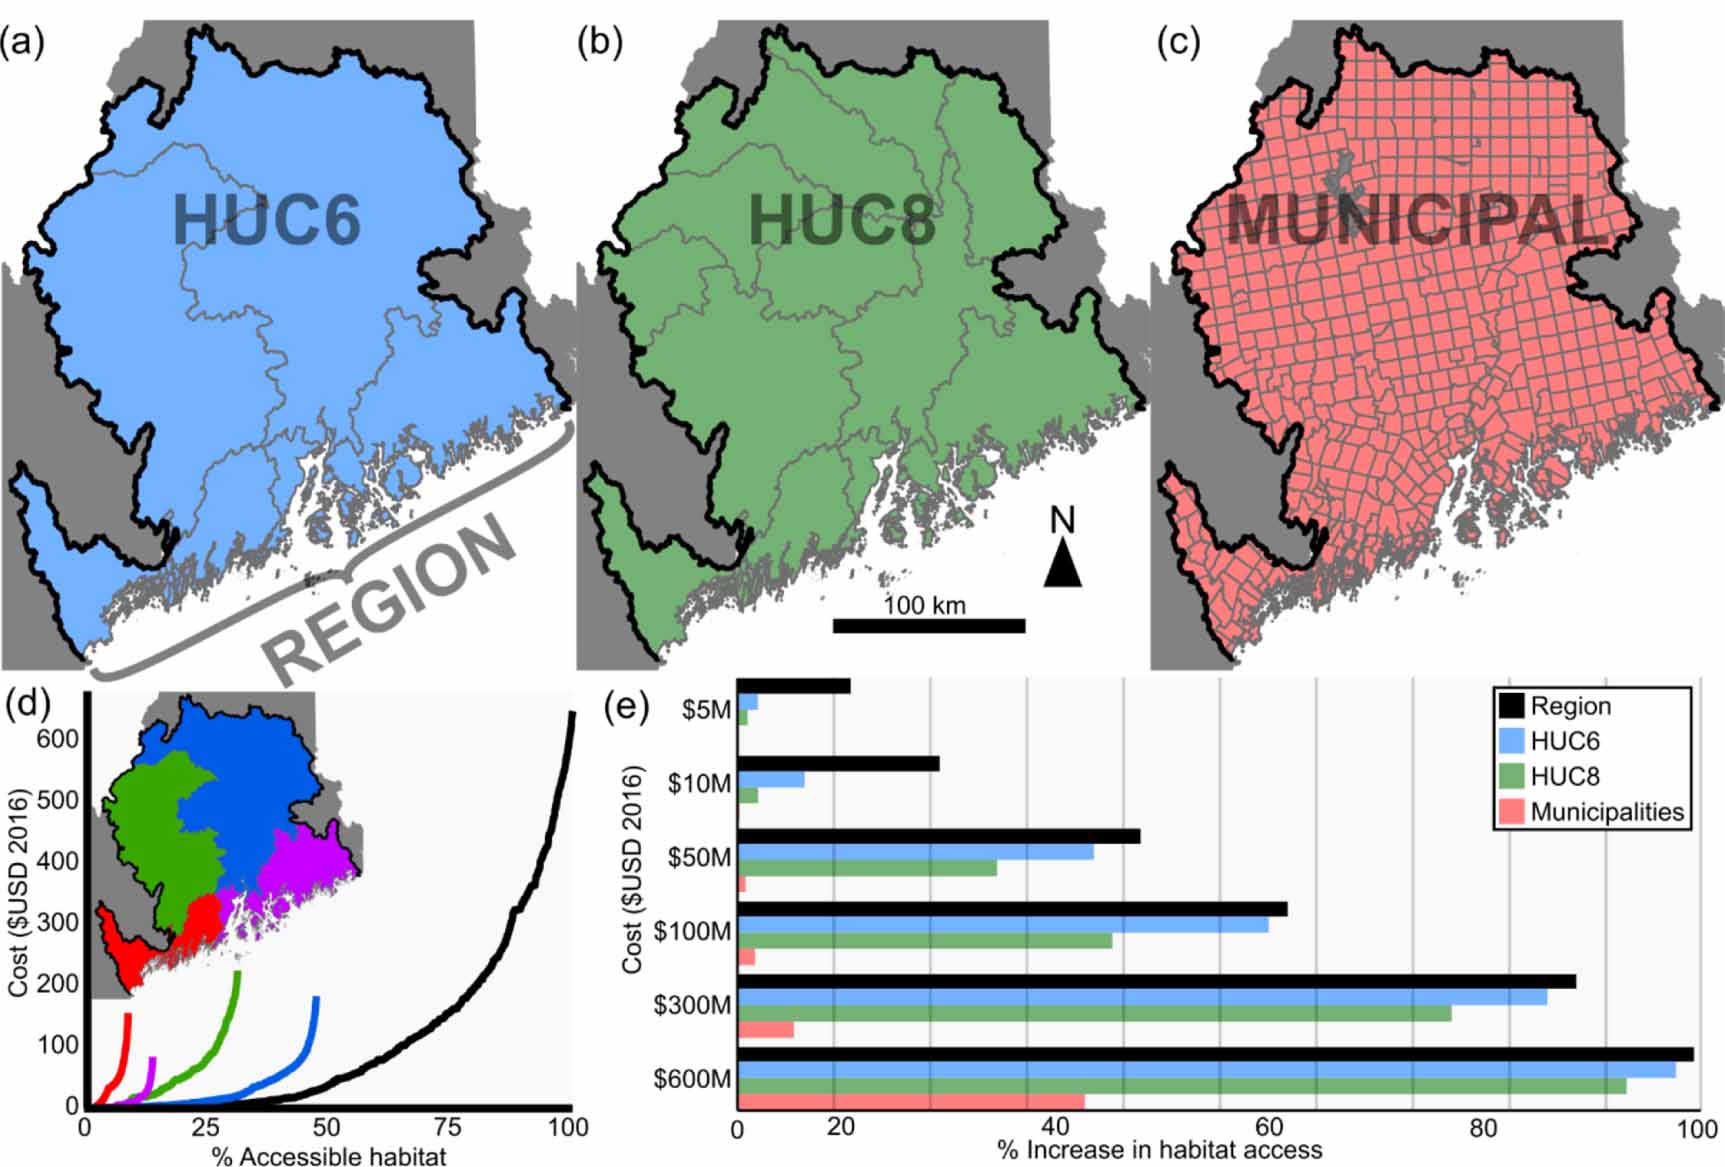
Much like coordinating dam and culvert decisions for greater net benefits, increasing the spatial scale of decision-making to include a larger number of dams and culverts may also significantly improve the net benefits of the project (Neeson et al 2015, Roy et al 2018). We explore the impact of decision scale on cost-benefit, focusing specifically on habitat connectivity restoration, by comparing the efficiency of decisions across four spatial scales (figure 4(a)–(c)): our entire study region, watersheds delineated by Hydrologic Unit Code (HUC) 6, sub-watersheds delineated by HUC8, and subregions divided by municipalities. We assume for this experiment that all funds are evenly distributed across each subregion. For example, a $100 M budget distributed evenly across four sub-watersheds provides $25 M for each, while 375 municipalities would each receive $0.27 M.
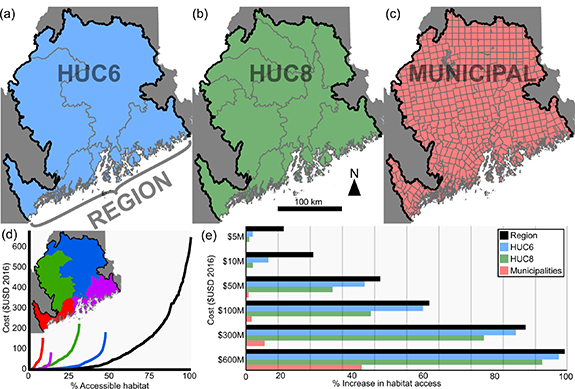
Figure 4. Efficiency gains met by increasing the scale of coordinated barrier decisions. Decision scales: (a) regional, HUC6, (b) HUC8, (c) municipalities. (d) Comparison of cost versus habitat production possibility frontiers (PPFs) modeled for HUC6 watersheds indicated by colored map versus regional-scale coordination (black line). Colors denote Penobscot (blue), Kennebec (green), eastern coastal (purple), and western coastal (red) watersheds. (e) cost versus % increase in habitat access across scales indicates substantial benefit-cost advantages for regional planning at the lowest cost levels.
Download figure:
Standard image High-resolution imageWe first explore scale-dependent efficiency by comparing regional versus HUC6 watershed marginal cost curves (figure 4(d)). Short, steep HUC6 trends indicate that when decisions are intentionally separated by smaller boundaries, there are fewer opportunities to maximize habitat access at lower cost and therefore lower efficiency versus regional coordination. For example, if decision makers were to focus all habitat access restoration efforts in the Penobscot, the cost would reach $200 M, whereas a regionally coordinated decision for the same restored connectivity (i.e. ∼50% habitat relative to current conditions) is estimated to cost less than $30 M. This gap in efficiency grows larger for efforts focused on even smaller watersheds, such as in the Kennebec and coastal watersheds (figure 4(d)).
Efficiency scales proportionately with the spatial scale of decisions (figure 4(e)). For different cost levels, we calculated the cumulative increase in habitat access at each scale. Regional scale provides the greatest increase in habitat at all cost levels, while decisions separated by municipalities are substantially less cost-effective. This disparity is most apparent at the lowest cost levels. For example, given a $5 M budget, regional coordination could lead to 11.9% improvement in habitat access relative to the historic level, while municipal-scale coordination provides approximately two orders of magnitude less with ∼0.1% improvement. Decisions coordinated at the HUC6 scale provide the second-largest improvement with a 2.3% gain relative to current conditions. This efficiency gap diminishes as budget levels increase due to funding of larger-scale decisions that intersect and eventually connect more of the independently managed sub-areas. For example, decisions coordinated at the HUC6 scale come within 5 percentage points of regionally coordinated decisions given a $50 M budget, and decisions coordinated at the HUC8 scale come within 7 percentage points of regionally coordinated decisions given a $600 M budget.
4. Discussion
Our approach provides a basis for understanding the broader impacts of river infrastructure decisions and potential synergies and trade-offs among habitat connectivity restoration, road safety based on culvert failure susceptibility, and the monetary cost of decisions. Model results demonstrate the potential value of an integrated approach to balancing the social, ecological, economic, and technical trade-offs involved in sustainable infrastructure development (Grabowski et al 2017). Here we discuss specific details for river infrastructure decisions, including benefit-cost trends for coordinated decisions, scale-dependent cost efficiency and potential stakeholder equity challenges, and opportunities for cost-sharing between decisionmakers with varied objectives.
Though available data indicate that dams generally have a far greater impact on river herring migration, culverts are often prevalent upstream features that may substantially reduce potential habitat connectivity benefits of dam removal. Other diadromous species with stronger preference for headwater habitat, such as American eel, are expected to be even more responsive to coordinated dam and culvert decisions. Coordination provides substantial benefits for the resilience of diadromous species and larger freshwater/marine ecosystems (Jackson 2003, Ames and Lichter 2013, Dias et al 2019). Other important biophysical, ecosystem/species, and socio-economic criteria could be incorporated and expanded in future studies using similar frameworks (Roy et al 2018).
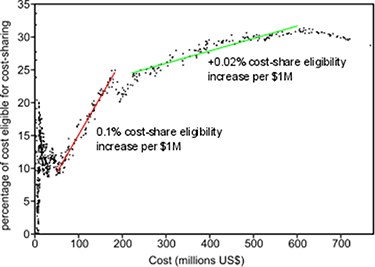
In addition to improved cost-effectiveness, we identify overlapping benefits between ecosystem, safety, and cost criteria that align with the priorities of FCMs and TSMs. These benefits may be useful for encouraging synergistic cost-share strategies that avoid redundant efforts (Neeson et al 2018). For example, FCMs may negotiate cost-share strategies with TSMs to help fund replacement of culverts that are of critical habitat and safety concern. Our coordinated habitat strategy includes management scenarios that highlight the influence of replacing several high-risk culverts (WOL ≤5 years) eligible for replacement based on TSM safety priority. In other words, cost-sharing contributions by TSMs may encourage external funding contributions that would otherwise be covered entirely by FCMs (figure 5). Cost-sharing fractions vary for budgets below $30 M, stabilize at 11%, then generally increase following a linear trend. This trend shifts to a relatively shallow linear trend at ∼$180 M and reaches a maximum cost-share eligibility of 31% for a $615 M budget. In general, the degree of synergism between FCMs and TSMs steadily increases as a function of the amount of funds being spent, excluding dam removal. These trends indicate that cost-sharing could account for nearly one third of habitat connectivity restoration budgets due to the prevalence of underperforming culverts. Unexpended funds gained from TSM/FCM cost-sharing could be reinvested toward other projects ineligible for cost-sharing, such as dam removal. Additionally, FCMs could plan opportunistic and affordable projects around pre-existing TSM culvert replacements.
Figure 5. Percentage of management cost eligible for cost-sharing for different budget levels, assuming TSMs will fund replacement of culverts with WOL ≤5 years. Each point represents a particular combination of dam removals and culvert replacements. Eligibility for management decisions below $50 M are scattered, ranging from 0%–100% (results below 35% displayed only). Above $50 M, trend is generally linear (red), slope breaks at ∼$180 M (green), and apexes above 31% cost-share at ∼$625 M.
Download figure:
Standard image High-resolution image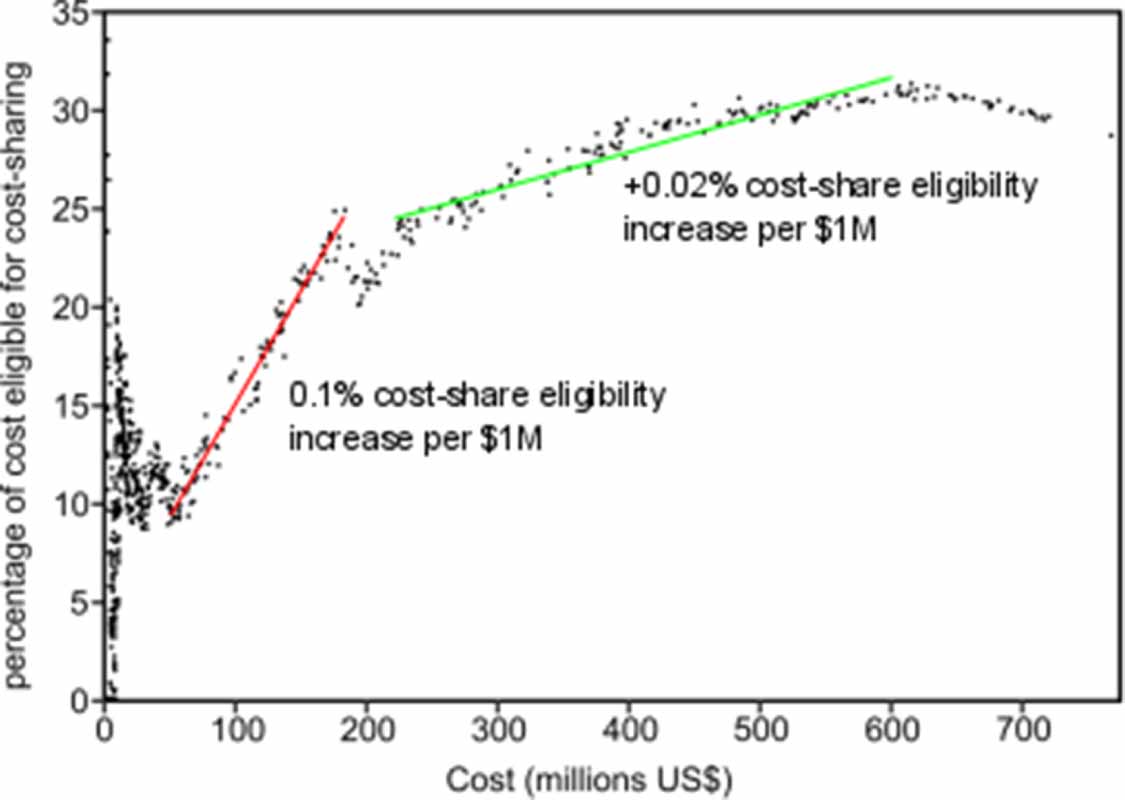
Though we demonstrate that watershed-scale management practices are more efficient than municipal-scale management practices, greater efficiency can come at the expense of equity, or the even distribution of benefits and costs (Roy et al 2018). In general, efficiency increases at greater scales based on the heterogeneous allocation of resources to local projects providing the greatest total net benefits. However, such an approach can create potentially inequitable spatial distribution of benefits and costs (Paetzold et al 2010, Pascual et al 2010). Furthermore, this strategy may not necessarily overlap with local stakeholder preferences for how their streams and rivers are managed (Mcdermott et al 2013), including equity in the distribution of other social values and decision criteria that the most efficient option provides (Chan et al 2007). A more equitable approach may be to compare these efficient, watershed-scale decisions with more feasible decisions organized by groups concerned with smaller-scale issues or who wish to consider other objectives beyond maximizing the amount of habitat restoration (Gilvear et al 2013).
Introducing policy mechanisms to facilitate equitable distribution of impacts, such as financially compensating residents in areas with limited restoration potential, can also enhance public acceptability of a given restoration project (Daigneault et al 2017). Regardless, selecting projects based on efficiency is typically objective while incorporating equity into the decision framework is more subjective so long as decision criteria represent public participation (sensu Sarewitz 2010). One compromise may be to build public approval of regional management plans by limiting their use to guide selection and funding of municipal-scale infrastructure improvement projects.
A further challenge is management decisions that involve other far-reaching trade-offs impacting entire social-ecological systems. For example, dam removal may influence additional criteria from hydropower production (Lange et al 2018, Roy et al 2018) to property values (Lewis et al 2008) and their relations to potential stakeholder groups often guides management decisions (Stanley and Doyle 2003, Fox et al 2016). Roy et al (2018) identified potential decision scenarios with equally balanced preferences similar to Scenario S8 (figure 3(b)) but also indicated that the cumulative benefits decrease with an increasing number of decision criteria. Therefore, accounting for all costs and benefits of these decisions may lead to different or subdued outcomes. There are also multiple alternatives to dam removal that may be more broadly acceptable for decision makers, such as construction of fish passage facilities (Song et al 2019) or operating dams to provide suitable environmental flows (Poff and Olden 2017).
Future climate-related flooding is projected to increase in northeastern USA (Howarth et al 2019) with implications for the pre-existing safety, economic, and ecosystem challenges explored here (Schweikert et al 2014). Extreme flooding events can damage culverts and dams with significant in situ and downstream safety, economic, and ecological implications. Larger, more frequent floods put more culverts at greater failure risk, requiring more resources to maintain, improve, or remove damaged infrastructure (NEEFC 2011). Larger fluctuations in stream discharge, flow velocity, and water depth may also reduce suitable diadromous fish habitat for spawning and rearing and make passage more difficult (Haro et al 2004). Reduction in annual snowpack and seasonal shifts in peak spring discharge may advance the timing and intervals of adult and juvenile fish migrations (Dhakal et al 2015). We suggest that the watershed-coordinated management approach explored here may improve infrastructure and ecosystem resilience and reduce the negative impacts of these climate-related implications. However, further analysis is necessary to assess how these benefit-cost trends will respond to climate change.
Incorporating diverse decision criteria into multi-objective optimization approaches may be crucial for informing decision makers of broadscale social-ecological impacts of future infrastructure decisions. The methods presented in this paper can be replicated at a range of geographical and geopolitical scales, thereby helping facilitate decision-making from local to national scales. More comprehensive trade-off assessments may help identify proactive opportunities for high benefit-cost infrastructure development, where they can be reconciled in contemporary environmental management policy (Owen and Apse 2014, Roy et al 2018). We focus here on river infrastructure decisions but encourage others to adapt an approach for exploring and connecting other related multi-objective optimization challenges emerging in sustainable conservation (Markolf et al 2018, Linke et al 2019), sustainable urban development and roadway design (Gosse and Clarens 2013, Thorne et al 2014), resource management practices (Cavender-Bares et al 2015), and many other sustainability issues facing societies around the world (Clark et al 2016). Such challenges require interdisciplinary collaboration among researchers and close partnerships with stakeholders to better understand their position within a larger system and the potential trade-offs of different decision scenarios.
Acknowledgments
We thank B Matthews, C Hebson, J Gates, E Martin, and J Royte for their constructive comments and provision of public data. We thank two anonymous reviewers for constructive comments. Experiments were simulated with the UMaine Advanced Computing Group High Performance Cluster. Support for this project is provided by the National Science Foundation's Research Infrastructure Improvement NSF #IIA-1539071. The U.S. Geological Survey Maine Cooperative Fish and Wildlife Research Unit provided logistical support. We acknowledge the support and collaboration of the Department of the Interior, U.S. Geological Survey and the Senator George J Mitchell Center at the University of Maine, under Grant No. 5407766. This project was supported by the USDA National Institute of Food and Agriculture, Hatch (or McIntire-Stennis, Animal Health, etc.) Project number ME0-41825 through the Maine Agricultural & Forest Experiment Station. Maine Agricultural and Forest Experiment Publication Number 3772. Any use of trade, firm, or product names is for descriptive purposes only and does not imply endorsement by the U.S. Government.
Data availability statement
All data that support the findings of this study are included within the article (and any supplementary information files).