

Abstract
Droughts in tropical South America have an imminent and severe impact on the Amazon rainforest and affect the livelihoods of millions of people. Extremely dry conditions in Amazonia have been previously linked to sea surface temperature (SST) anomalies in the adjacent tropical oceans. Although the sources and impacts of such droughts have been widely studied, establishing reliable multi-year lead statistical forecasts of their occurrence is still an ongoing challenge. Here, we further investigate the relationship between SST and rainfall anomalies using a complex network approach. We identify four ocean regions which exhibit the strongest overall SST correlations with central Amazon rainfall, including two particularly prominent regions in the northern and southern tropical Atlantic. Based on the time-dependent correlation between SST anomalies in these two regions alone, we establish a new early-warning method for droughts in the central Amazon basin and demonstrate its robustness in hindcasting past major drought events with lead-times up to 18 months.
Export citation and abstract BibTeX RIS

Original content from this work may be used under the terms of the Creative Commons Attribution 4.0 license. Any further distribution of this work must maintain attribution to the author(s) and the title of the work, journal citation and DOI.
1. Introduction
Hydrological extremes in tropical South America have great effects on regional ecosystems as well as devastating socio-economic ramifications [1, 2]. Droughts increase tree mortality and the risk of fires, while prolonged episodes of enhanced rainfall can lead to floods. Moreover, while tropical rainforests commonly serve as important global carbon sinks, this can be reversed during droughts. The severe Amazon drought in 2010, for instance, had a total biomass carbon impact of 2.2 PgC with an affected area of 3.0 million km2 [3]. Because of these tremendous effects, developing advanced strategies for multi-year lead drought forecasting is key to an appropriate anticipation, mitigation and management of their potential impacts on ecosystems, agriculture, and urban water management. However, especially in the Amazon basin, as a key hotspot of biodiversity, terrestrial carbon storage and continental moisture recycling, establishing reliable predictions of incipient droughts poses an ongoing challenge.
Rainfall in South America, and especially in the Amazon basin, crucially depends on moisture inflow from the Atlantic ocean and positive feedbacks related to latent heating over the Amazon [4]. During austral summer, the Intertropical Convergence Zone (ITCZ) and the associated easterly trade winds are shifted southward. After crossing the Amazon basin, these low-level winds are blocked by the Andes and are redirected southward, forming the South American Low-Level Jet [5]. During austral winter, the ITCZ is shifted northward, leading to enhanced moisture inflow towards northern South America, but simultaneously to a substantially reduced flow to the South American subtropics [2]. The core season of the South American monsoon, with high rainfall values in the southern tropics and subtropics, takes place during austral summer. This pattern is reversed for the northern parts of the continent, where the highest rainfall values are observed during austral winter [6]. Rainfall in South America is thus strongly affected by the position of the ITCZ and the amount of water vapor coming from the Atlantic ocean. Therefore, a shift of the ITCZ, or significantly less evaporated water from the ocean, can have drastic effects on rainfall sums over the South American continent. Figure 1 shows continental rainfall rates in South America and SSTs of the adjacent ocean regions, averaged over the time span from 1981 to 2016, as well as the typical ITCZ positions in January and July.
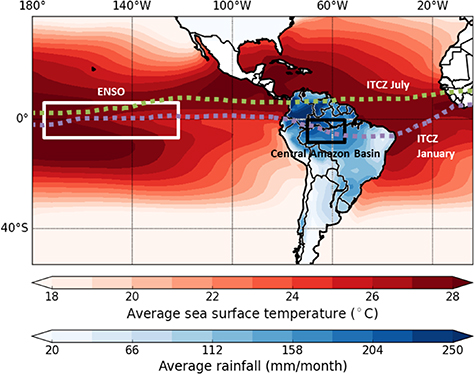
Figure 1. Climatic parameters. Mean monthly sea surface temperatures (in °C, red scale) and mean continental rainfall over South America (in mm/month, blue scale) for the time period from 1981 to 2016. Sea surface temperatures and rainfall are generally higher around the equator. The spatial center of the El Niño–Southern Oscillation (ENSO) pattern and the typical positions of the Intertropical Convergence Zone (ITCZ) in January and July are indicated by the white box and dotted lines, respectively. The black box marks the continental study area referred to as the Central Amazon in this study (10°S to 0°S, 70°W to 55°W).
Download figure:
Standard image High-resolution imageAlthough the tropical Atlantic ocean is the major source of moisture inflow into South America [5], it has long been thought that droughts in the Amazon basin are caused mainly by anomalies of the El Niño–Southern Oscillation (ENSO) and associated longitudinal displacements of the atmospheric Walker circulation. Only more recently, it has been suggested that SST anomalies in the Atlantic ocean could provoke hydrological extremes in the Amazon as well [7, 8], which is supported by marked correlations between tropical Atlantic SSTs and Amazon rainfall [9, 10].
Recent findings indicate that rainfall sums in the southern Amazon are mainly controlled by SST anomalies in the northern tropical Atlantic ocean (NTAO) [11], with anomalously warm SSTs in the NTAO being associated with droughts in the Amazon basin [12, 13]. In addition, southern tropical Atlantic ocean (STAO) SSTs also exhibit significant correlations with rainfall in the Amazon basin, with droughts often coinciding with negative STAO SST anomalies [14–17]. Opposite anomalies in both regions have likewise been associated with the occurrence of very wet periods. Taken together, the gradient between SST anomalies in the NTAO and STAO could serve as an indicator for conditions favoring hydrological extremes in the southern Amazon basin [18–21]. Specifically, the combined effect of strong positive SST anomalies in the NTAO along with negative SST anomalies in the STAO can trigger a significant northward displacement of the ITCZ, leading to markedly reduced rainfall in the Amazon basin [22, 23]. This mechanism is exemplified by the severe 2010 Amazon drought, along with which the NTAO exhibited the strongest warming since 1903, causing a significant ITCZ shift [24].
In this study, we investigate to what extent the latter mechanism can be exploited for multi-year lead statistical forecasting of incipient drought events in the central Amazon basin. For this purpose, we analyze the relationship between SST anomalies and rainfall in tropical South America by means of complex network techniques [25, 26] to highlight the strongest statistical associations among corresponding time series from different locations. Recent work has demonstrated that key spatiotemporal variability patterns associated with the spatial organization of rainfall in South America can be conveniently studied and quantitatively characterized by such methods [6, 27, 28]. Here, we extend the application of this approach to study the functional connectivity [29] between monthly rainfall anomalies in South America and SST anomalies in the adjacent Atlantic and Pacific oceans for the time period from 1981 to 2016 in a two-variable coupled network setting [30]. In combination with a sliding window approach, the temporal evolution of the identified key correlation patterns is examined and linked to specific climatic events (e.g. [28, 31]). Our analysis confirms the existence of two distinct tropical Atlantic ocean regions with SST anomalies that are strongly correlated with the central Amazon basin rainfall. Subsequently, we exploit the time-dependent correlations between SST anomalies in those two regions alone and show that they provide a possible early-warning indicator for drought events in the Amazon basin. By successfully hindcasting past drought events, we demonstrate the potential of the proposed framework to provide skillful forecasts of incipient drought events at lead times up to 18 months.
2. Data and Methods
2.1. Data
We utilize monthly SST data retrieved from the Extended Reconstructed Sea Surface Temperature data set (ERSST Version 3b) [32] with a resolution of  . For the continental precipitation the Climate Hazard Group InfraRed Precipitation with Station (CHIRPS) data [33] is used at a monthly resolution. The data is interpolated from the native
  grid to
  to match the resolution of the SST data and to reduce computational efforts. Both data sets are considered for their common time period from 1981 to 2016. We compute monthly anomalies with respect to the long-term mean annual cycle by subtracting the respective mean values for each month (Supplementary Notes section S1 (available at stacks.iop.org/ERL/15/094087/mmedia)).
As a drought indicator, we use the standardized precipitation index for a three-month period (SPI-3) [34], averaged over the central Amazon basin. Here, server droughts correspond to SPI values below −1.5. SPI-3 has been shown to provide similar drought characteristics as more complex multi-variable integrated indices like the Palmer Drought Severity Index (PDSI) [10], so that we restrict our attention here to this conceptually simpler index exclusively based on rainfall sums.
2.2. Static unweighted climate networks
In order to conveniently represent the strongest negative and positive correlations between SST and rainfall time series at different locations, we construct unweighted two-variable coupled networks [30]. This approach allows simultaneously investigating the dominating correlation patterns within the individual climate fields as well as between them. Here, we restrict ourselves to the analysis of cross-linkages between two spatially distinct sub-networks, representing the oceanic SST and continental rainfall anomalies, respectively.
For measuring the association between each pair of time series, Spearman's rank-order correlation coefficient is applied. To obtain a coupled network representation, each grid point is identified with a node of a spatially embedded network, and only those pairs of grid points with the strongest correlations are represented as links. Thereby, statistical associations below a certain threshold are not taken into account. Here, we choose this threshold such as to represent the 10% strongest positive and negative correlations as links in two distinct networks. A detailed discussion of this choice, along with the robustness of the obtained results for different values, is provided in the Supplementary Notes section S2. In general, we find that the overall spatial patterns of links remain very similar even when the employed link density of 10% is substantially modified. The resulting network structure is fully described by the unweighted adjacency matrix
where ρij denotes Spearman's rank-order correlation coefficient between the time series at node i and node j, and ρth the correlation threshold. To identify the strength of cross correlations between a specific grid cell and the other sub-network (variable), the local cross degree [30]
is used, where Vl and Vm denote the node sets of the two respective sub-networks.
2.3. Evolving weighted climate networks
While the previous static network approach allows identifying regions with SST anomalies markedly co-varying with central Amazon basin rainfall anomalies, the inter-dependency between the observed (rainfall or SST) variability in those different regions requires further study. For this purpose, weighted two-variable coupled networks are constructed. Unlike for the unweighted network representation as described above, the correlation coefficients between each pair of nodes are used here as coefficients of the weighted adjacency matrix 
and analogously using absolute values for negative correlations.
For studying the temporal evolution of the correlations between different regions, a sliding window approach is applied. Here, for each month within the observation period, except for the first two years, an individual network is constructed based on the data of the previous 24 months. To quantify the magnitude of connectivity between two regions of choice, we employ the average cross correlation  with i ∈ Vl and j ∈ Vm. Note that this measure takes the entire cross-correlation matrix between the two fields into account, i.e. no correlation threshold is needed. We associate each ACC value with the end point of the time window for which it has been computed. Thus, only data from the past enter each particular value.
2.4. Drought forecast
We finally examine the capability of ACC values between SST anomalies in the NTAO and STAO to provide a binary (yes/no) early-warning indicator of incipient Amazon droughts. For this purpose, the monthly ACC data are smoothed using a Chebyshev type-I low-pass filter with a cutoff at 24 months, since we are only interested in longer time-scale variations of these correlations. Then, a threshold to the filtered ACC values is chosen such that the obtained threshold crossing events coincide as much as possible with the observed Amazon droughts. To quantify the skill of the proposed forecasting scheme, we use the Heidke Skill Score (HSS) [35, 36]
which compares the performance of our scheme with that of a random forecast. Here tt represents the number of cases with a correct forecast of a subsequent event, ff the number of instances of no forecast and no event, ft stands for the number of times where no forecast was issued but an event occurred (missed hits), and tf stands for the number of forecasts with no following event (false alarms). A value of  corresponds to the skill of a random forecast, while a score of 1 indicates a perfect forecast.
3. Results
3.1. Functional connectivity between continental rainfall and sea surface temperatures
We first construct two unweighted static two-variable coupled network representations of strong positive and negative correlation patterns between monthly SST and continental rainfall anomalies. This allows identifying continental and oceanic regions with high cross degree (Supplementary figure S2), which represent coherent spatial patterns of relevant correlations between rainfall and SST that on average persist on inter-annual time scales and beyond.
Instead of exploiting the full cross degree patterns, we focus on rainfall anomalies in the central Amazon basin (0°–10°S, 55°–70°W, see figure 2(a)), neglecting regions north of the equator because of their opposite seasonality. This restriction identifies four distinct ocean regions comprising the highest 20% of all cross degree values in the SST field, among which two regions are positively and two negatively correlated with rainfall anomalies in the central Amazon. For positive correlations, the highest cross degrees are observed around the equator in the southern tropical Atlantic (STAO) and in the southern Pacific ocean (SPO) (figure 2(a)). The highest values for negative correlations are found in the tropical Atlantic north of the equator (NTAO), as well as in the equatorial central Pacific ocean (CPO) most likely related with ENSO (figure 2(b)). In what follows, we will restrict our attention to these four regions regions and their relationship with rainfall variability in the central Amazon basin.
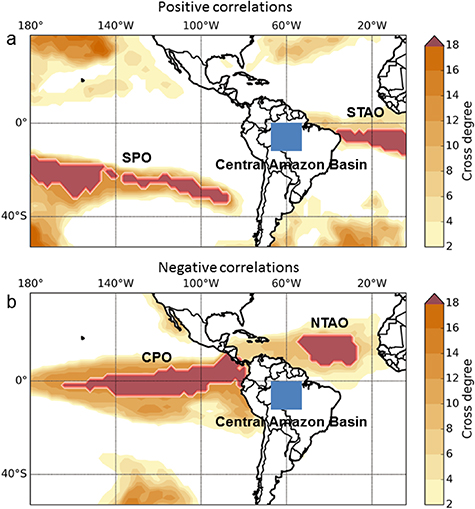
Figure 2. Cross degree between sea surface temperature and continental rainfall anomalies. For each sea surface temperature grid cell of the Atlantic and Pacific Ocean, the cross degree towards rainfall in the Central Amazon Basin (blue box) is shown, for a positive correlations and b negative correlations. Darker shading indicates a larger cross degree, implying a larger number of links, and thus significant correlations with rainfall at more grid points in the Central Amazon Basin. Red areas outline coherent oceanic regions with a the 20% highest cross degrees for positive correlations, found in the Southern Pacific Ocean (SPO) and Southern Tropical Atlantic Ocean (STAO), and b the 20% highest cross degrees for negative correlations, found in the Central Pacific Ocean (CPO) and Northern Tropical Atlantic Ocean (NTAO).
Download figure:
Standard image High-resolution imageIn order to further study the mutual dependency between SST anomalies in the four identified ocean regions and the rainfall anomalies in the central Amazon basin as a function of time, we generate weighted complex networks between the corresponding variables shrinked to the respective pairs of regions for sliding 24-month windows (see Supplementary Notes section S3 for detailed results and a corresponding in-depth discussion). The temporal variability of the respective ACC values between the two Pacific regions and the central Amazon basin indicates no significant correlations during most of the times. In turn, the temporal evolution of the ACC between the NTAO and central Amazon rainfall exhibits generally negative values, especially during periods with marked water shortages. The ACC between the STAO and the central Amazon, on the contrary, is mainly close to zero. However, it exhibits markedly negative correlations during drought conditions. This dynamical correlation structure is consistent with previous findings based on a different approach for detecting SST-rainfall coupling [37].
3.2. Early-warning indicator for droughts based on Atlantic SST correlation structure
The above results, along with other several other studies [9, 10, 37], demonstrate that droughts in the central Amazon and strong SST anomalies in the tropical Atlantic ocean can be expected to often occur simultaneously (see also Supplementary figure S3). This supports recent suggestions that droughts in the Amazon basin are triggered by an emerging gradient between the northern and southern tropical Atlantic (see Supplementary figure S4) [2]. Instead of just looking at the instantaneous SST gradient between NTAO and STAO, we follow the highly non-stationary nature of correlations as reported above and study the mutual relationship between the SST anomalies in both tropical Atlantic regions in more detail. We again construct evolving weighted coupled climate networks; this time, however, between the SST anomalies in the two mentioned regions. The temporal evolution of the resulting ACC (figure 3) reveals generally positive values, indicating that the SST anomalies in both Atlantic regions proceed largely in phase. However, prior to drought events, the ACC typically decreases and becomes negative, indicating that SST anomalies in the NTAO and STAO develop a dipolar relationship. This signal precedes the SPI of the central Amazon basin by, on average, about one year.
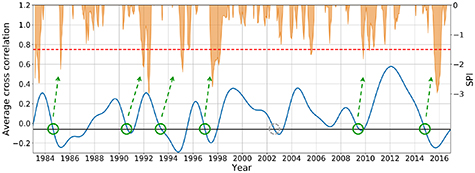
Figure 3. Early-warning signal for droughts in the central Amazon basin. We compare the time evolution of the average cross correlation of the Northern Tropical Atlantic Ocean (NTAO) and Southern Tropical Atlantic Ocean (STAO), given by the blue curve, with the standardized precipitation index (SPI, orange) of the central Amazon basin. Orange dips indicate a negative SPI with a threshold for severely dry periods (SPI  , dotted red line). We expect a drought event within the following one and a half years whenever the average cross correlation between NTAO and STAO SST anomalies falls below an empirically found threshold of −0.06. Green circles indicate a matching forecast based on the Atlantic SST correlation structure, with one false alarm in 2002 indicated by a grey circle, where the threshold is crossed but no drought took place in the direct aftermath (see Discussion). The temporal evolution of the average cross correlation shown here is smoothed using a Chebyshev type-I low-pass filter with a cutoff at 24 months (see Methods).
Download figure:
Standard image High-resolution image
Along with the occurrence of a drought in the Central Amazon, the ACC reaches a minimum before increasing again. During a drought in the central Amazon, the dipole between NTAO and STAO thus reaches its maximum strength, before diminishing again in the aftermath. We emphasize that the dipole between these two regions—with maximum strength indicated by the minimum in the ACC between the SSTs of NTAO and STAO—is associated with, but should not be considered the same as, the SST gradient between the two Atlantic regions that has been proposed to cause droughts in former studies [2, 20]: During the development of the dipole, SST anomalies in the two regions evolve in opposite directions, leading to an increased gradient between them (Supplementary figure S4).
To establish an early warning method for droughts in the central Amazon basin, we therefore focus on the emergence of the SST dipole pattern between the NTAO and the STAO. Specifically, we expect a shortage in rainfall within the following one and a half years whenever the ACC between the NTAO and the STAO becomes significantly negative, with the peak of the drought occurring around the time when this correlation reaches its minimum. Empirically, crossing a threshold at −0.06 from above is found to provide an optimal early-warning signal of a drought event based on the considered study period and data sets (see Supplementary figure S5). For the time period between 1981 and 2016, in which high quality rainfall data are available, the SPI indicates seven severely dry periods (i.e. SPI  ) in the Amazon basin. Out of these seven droughts, our method is able to correctly hindcast six (all but the one taking place in 2005), while we would have also issued one false alarm in 2002 (for possible reasons of the false alarm and missed hit see Discussion section). This leads to a HSS of 0.82 (equation (4)). Extensive robustness tests of this hindcast are provided in the Supplementary Notes section S4. Because it occurred at the very beginning of the study period, we did not include the drought of 1983 in our analysis (as we do not know whether the ACC had crossed the threshold before). Note that to comply with the size of our sliding windows, droughts which occur in close succession are counted as one, e.g. 1991 − 1992 and 2009 − 2010. Furthermore, all droughts except the one in 1995 occurred within one year after the threshold was crossed, while the one in 1995 occurred only after one and a half years.
During very wet periods in the central Amazon basin, we often observe a positive SST gradient between NTAO and STAO (Supplementary figure S4). Accordingly, the ACC between these two Atlantic regions is close to zero or even positive during such periods (Supplementary figure S6). In this spirit, we find indications that shortly before very wet anomalies, the dipole diminishes and the SST anomalies of the two Atlantic regions rather vary in phase. The fact that this behavior appears less regular and—taken alone—more unreliable for establishing a robust early warning suggests that the mechanisms leading to the occurrences of very wet conditions are more complex and depend on additional parameters associated with the formation of extensive positive rainfall anomalies, such as orography, ENSO, or other atmospheric processes. Given that the relationship is more concise for dry conditions in the Amazon, we focus on the prediction of droughts in this study.
While we have only presented here the results for the filtered ACC time series, corresponding findings for the non-filtered data, shown in Supplementary figure S7, indicate that the high forecast skill of our method does not critically depend on the smoothing. Details on the corresponding analysis can be found in the Supplementary Notes section S5.
4. Discussion
The development of SST-based statistical forecasting schemes for droughts in the Amazon basin has recently attracted interest. Most notably, Lima and AghaKouchak [10] considered the prediction of the first three empirical orthogonal function (EOF) modes of the Amazon PDSI field, achieving considerable spatial correlations between forecasted and observed spatial fields at lead-times up to 9 months.
In both, Lima and AghaKouchak [10] and our present work, the essential background for establishing a reliable drought forecasting scheme has been provided by the detection of influential SST patterns. For the Amazon basin, previous studies already suggested that particularly high SST anomalies in the northern tropical Atlantic ocean could trigger droughts in the Amazon. Often, this phenomenon co-occurs with an El Niño event (e.g. [7, 8, 11]). Corroborating the well-known impact of ENSO on rainfall anomalies in tropical South America, we also observe anomalies in the correlation structure between rainfall in the central Amazon and the central Pacific ocean (CPO) whenever hydrological extremes occur. Note that the CPO region that we have identified in this study is similar to the area upon which ENSO indices are typically defined.
Along with this possible constructive effect of tropical Atlantic and Pacific SST anomalies, most previous studies have considered both ocean basins together with the Amazon basin as study regions in their entirety. Indeed, while this work has developed an early warning indicator for central Amazon droughts solely based on Atlantic SST patterns, the inclusion of other covariates (like characteristic SST patterns in the tropical Pacific or relevant patterns in other climate variables) in a more complex statistical forecasting model could further improve the predictive skill of our approach. Developing and testing a more complex scheme would, however, require much longer reliable data sets of SST and continental rainfall variability. In turn, given the limited data available, adding additional predictors might have easily rendered a corresponding forecast model overdetermined, or have resulted in a loss of sensitivity due to the spatial averaging of data from regions affected by essentially different climate variability patterns. Nevertheless, we outline corresponding further extensions of the present work as a subject of future studies.
Our proposed early-warning method differs from previous drought forecasting schemes [10] in that it is solely based on SST anomalies in the northern and southern tropical Atlantic ocean (NTAO and STAO). Although regression analyses between tropical Atlantic SSTs and rainfall in the Amazon have been performed before [13], an early-warning method based on this idea alone has—to our knowledge—not been introduced so far. In our approach, a decrease of the average cross correlations between NTAO and STAO SST anomalies below zero indicates the development of an SST dipole between both regions, which provokes a northward shift of the ITCZ position, causing reduced rainfall amounts in the central Amazon. The relationship between the dipole formation and subsequent drought occurrences is so distinct that an early-warning system with high predictive skill can be established solely on this basis.
While the present study has exclusively focused on the correlation pattern between the two Atlantic regions, this does not imply that we disregard the large-scale impact of El Niño events on droughts in the Amazon basin (corresponding results for the two Pacific regions can be found in the Supplementary Notes section S6). Both El Niño and La Niña events are associated with strong SST anomalies in the Pacific ocean, which have in turn been found to induce significant SST anomalies in the NTAO [13, 37].
Regarding our missed hindcast of the 2005 drought, we note that the SPI-3 exhibited values between −1 and −1.5 for a considerable time interval before it finally dropped below −1.5 in 2005, indicating the drought onset. Considering this period as a prolonged build-up phase of drought conditions, the early-warning signal observed in 2002 and attributed to a false alarm could in fact be linked to the 2005 drought. Future work should examine the specific conditions associated with the 2005 drought to support or falsify this hypothesis and further unveil the associated specific climatological processes.
Unlike the method by Lima and AghaKouchak [10], our approach issues a binary forecast of an incipient drought, without paying attention to its specific spatiotemporal pattern and magnitude, at common lead-times of the order of one year and even longer (i.e. beyond those considered in [10]). Moreover, the presented hindcast skill indicates its considerable potential to be employed in combination with other existing strategies focusing on complementary aspects. Specifically, an issued warning could be used to initiate further, more computationally expensive multi-model ensemble forecasts with coupled atmosphere-ocean general circulation models, to study in more detail the expected spatiotemporal features of an incipient drought. Moreover, since SST projections of climate models are considered to be more reliable than rainfall projections, our results could also be used to estimate future drought frequencies in the Amazon.
Acknowledgments
We thank Henrique M J Barbosa and Jasper Franke for helpful discussions. This paper was developed within the scope of the IRTG 1740/TRP 2011/50 151-0, funded by the DFG/FAPESP. C C and R V D acknowledge support by the German Federal Ministry for Education and Research (BMBF) via the Young Investigators Group CoSy-CC2 (grant no. 01LN1306A) and the Belmont Forum/JPI Climate project GOTHAM (grant no. 01LP1611A). N B acknowledges funding by the Volkswagen Foundation, the German Federal Ministry for Education and Research, and the German Science Foundation (DFG, Reference BO 4455/1-1). The present paper is TiPES contribution #24; the TiPES (Tipping Points in the Earth System) project has received funding from the European Union's Horizon 2020 research and innovation program under grant agreement No. 820 970. R W acknowledges support by the Leibniz Association project DominoES.
Author Contributions
C C and N B conceived the study. L R and C C performed the analysis. C C, N B, and R V D prepared the manuscript. All authors discussed the results and contributed to editing the manuscript.
Competing Financial Interests
The authors declare that they have no competing financial interests.
Supplementary Information
This manuscript is accompanied by supplementary information including eleven supplementary figures and six supplementary notes.
Data availability statement
All data that support the findings of this study are included within the article and any supplementary information files.