

Abstract
Increasing concentrations of dissolved organic carbon (DOC) have been identified in many freshwater systems over the last three decades. Studies have generally nominated atmospheric deposition as the key driver of this trend, with changes in climatic factors also contributing. However, there is still much uncertainty concerning net effects of these drivers on DOC concentrations and export dynamics. Changes in climate and climate mediated snowfall dynamics in northern latitudes have not been widely considered as causal factors of changes in long-term DOC trends, despite their disproportionate role in annual DOC export. We leveraged long-term datasets (1988–2013) from a first-order forested tributary of Lake Superior to understand causal factors of changes in DOC concentrations and exports from the watershed, by simultaneously evaluating atmospheric deposition, temperature, snowmelt timing, and runoff. We observed increases in DOC concentrations of approximately 0.14 mg C l−1 yr−1 (mean = 8.12 mg C l−1) that were related with declines in sulfate deposition (0.03 mg  l−1 yr−1). Path analysis revealed that DOC exports were driven by runoff related to snowmelt, with peak snow water equivalences generally being lower and less variable in the 21st century, compared with the 1980s and 1990s. Mean temperatures were negatively related (direct effects) to maximum snow water equivalences (−0.71), and in turn had negative effects on DOC concentrations (−0.58), the timing of maximum discharge (−0.89) and DOC exports (indirect effect, −0.41). Based on these trends, any future changes in climate that lessen the dominance of snowmelt on annual runoff dynamics—including an earlier peak discharge—would decrease annual DOC export in snowmelt dominated systems. Together, these findings further illustrate complex interactions between climate and atmospheric deposition in carbon cycle processes, and highlight the importance of long-term monitoring efforts for understanding the consequences of a changing climate.
Export citation and abstract BibTeX RIS

Original content from this work may be used under the terms of the Creative Commons Attribution 4.0 license. Any further distribution of this work must maintain attribution to the author(s) and the title of the work, journal citation and DOI.
1. Introduction
Long-term studies of brown-water fed freshwater bodies have revealed increasing concentrations of dissolved organic carbon (DOC) over the last three decades across North America and Europe (Roulet and Moore 2006, Stottlemyer and Toczydlowski 2006, De Wit et al 2007, Monteith et al 2007a, Erlandsson et al 2008, Zhang et al 2010, Urban et al 2011, Couture et al 2012, de Wit et al 2016, Strock et al 2017). Mechanisms explaining increases in stream DOC concentrations have converged on changes in atmospheric deposition (De Wit et al 2007, Erlandsson et al 2008, Strock et al 2014), the timing and amounts of precipitation (Stottlemyer and Toczydlowski 2006, Erlandsson et al 2008, de Wit et al 2016), and responses to changing climate (Tiwari et al 2018). Changes in these factors together with climate mediated snowfall dynamics in northern latitudes have not been widely considered as causal factors of changes in long-term DOC trends, despite the disproportionate role of snowmelt in annual DOC export (Coble et al 2016). Exactly how increases in DOC concentrations relate to DOC exports from watersheds are uncertain, as isolating factors controlling hydrologic connectivity within watersheds is difficult (Hood et al 2003, Couture et al 2012).
Winter snowpack is a dominant source of annual runoff in northern regions, and as such determines the dynamics of nutrient and DOC export (Buffam et al 2001, Coble et al 2019, Marcarelli et al 2019). Therefore, changes in climate that alter the patterns of precipitation are likely to change the timing and amount of melt and runoff in snowmelt-dominated systems, potentially changing stream DOC concentrations and/or exports (Erlandsson et al 2008, Oni et al 2016). Shorter winters accompanied by lower snowmelt runoff peaks and slower spring snowmelt rates are expected to be the largest effects of changing climate on snowmelt dynamics (Hayhoe et al 2010, Musselman et al 2017, Byun et al 2018). Given these predictions, total runoff is expected to decline as the relative amount of total precipitation contributed as snowfall declines. While there could be an increase in the frequency of autumn storms (e.g. Small et al 2006), it can also be expected that snowmelt will occur earlier with a longer snowmelt runoff hydrograph. Exactly how these factors are likely to correspond with changes in solute export from watersheds are uncertain.
Hydrologic flowpath variability has direct and indirect impacts on DOC export that may be countervailing under changing climate (Stottlemyer and Toczydlowski 2006). For example, if there is extensive and persistent snow water equivalent (SWE) contributing to a late onset of melt, this could lead to more DOC export through shallow carbon-rich soil flow paths, and higher variation in runoff and DOC export (e.g. Sebestyen et al 2008). Diminished SWE and early melt, which is increasingly likely in the future (Ågren et al 2010, Musselman et al 2017, Byun et al 2018), should be coincident with less DOC export owing to reduced runoff. Moreover, a diminished or variable snowpack results in very different soil thermal gradient and decomposition environment, which also affects soil DOC concentrations (Li et al 2019). Given these complexities, changes in both DOC concentrations and the timing and amounts of runoff are likely to vary with peak SWE in ways that make understanding patterns of DOC export difficult. Furthermore, it is unclear how potential changes in DOC concentrations in different flow paths could manifest as total DOC export, as disentangling the many factors governing hydrologic connectivity between soils and aquatic systems are also complex (Stottlemyer and Toczydlowski 1991, 2006).
Long-term changes in precipitation chemistry are also likely affecting DOC concentrations in streams. For example, sulfate ( ) deposition in precipitation increases the ionic strength in soils, which inhibits the release of organic acids (Krug and Frink 1983, Evans et al 2008). After amendments to air pollution legislation in the early 1990s–2000s (e.g. US Clean Air Act (1990); European Environment Agency, National Emission Ceilings Directive 81/EC (2001)), the rate of
  deposition has declined (Strock et al 2014). The decline in
  deposition and corresponding changes in soil ionic strength provides an explanation for the increased DOC concentrations observed in surface waters (Monteith et al 2007a), but does not directly inform mechanisms controlling runoff and DOC export dynamics. Moreover, field studies observing interactive effects of
  deposition and changes in runoff patterns over time are rare for snowmelt-dominated watersheds (De Wit et al 2007, Erlandsson et al 2008).
We examined the influence of snowmelt dynamics and climate on DOC concentrations and exports through analyses of long-term monitoring data for a small forested tributary of Lake Superior (Stottlemyer and Toczydlowski 2006). Because these factors are not easily isolated, long-term monitoring provides useful insight into the dynamics of DOC concentrations and exports in response to climatic forcing and changes in atmospheric deposition. Specifically, we investigated changes in snowmelt runoff, temperatures,  deposition, and their interactive effects in explaining the variation in DOC concentrations and DOC exports over 26 years. We hypothesized that while peak snowpack runoff should primarily determine quantity of DOC exports, the timing of snowmelt would explain year-to-year variation in DOC export, with later peak melt events driving higher levels of DOC export. These analyses address our over-arching question: Given that long-term changes in
  deposition have likely influenced DOC concentrations, do changes in snowmelt patterns and climate explain additional variation in DOC concentrations and DOC exports from snowmelt-dominated watersheds?
2. Methods
2.1. Study site
The Calumet watershed is a first-order tributary of Lake Superior in the Upper Peninsula of Michigan, USA (Latitude: 47.278, Longitude: −88.515), previously described in detail by Stottlemyer and Toczydlowski (2006). Briefly, the watershed is 176 ha, has uniform slope (5%), moderate topographic relief and is vegetated by mixed northern hardwood forest. Soils are Typic Haplorthods with an ortstein layer at 1.5–2.0 m depth (Stottlemyer and Toczydlowski 1991). The climate is modified by Lake Superior, which moderates autumn and winter temperature extremes (Stottlemyer and Toczydlowski 2006). The National Atmospheric Deposition Program (NADP) site (MI99) is located 16 km south of the watershed, and received a mean of 803 mm in annual precipitation over the study period (supplemental figure; figure S1 (available online at stacks.iop.org/ERL/15/104034/mmedia)). The annual hydrograph is dominated by snowmelt and can be highly variable in timing and duration. The transitional spring climate has a large impact on the timing and duration of the spring snowmelt hydrograph (figure 1).
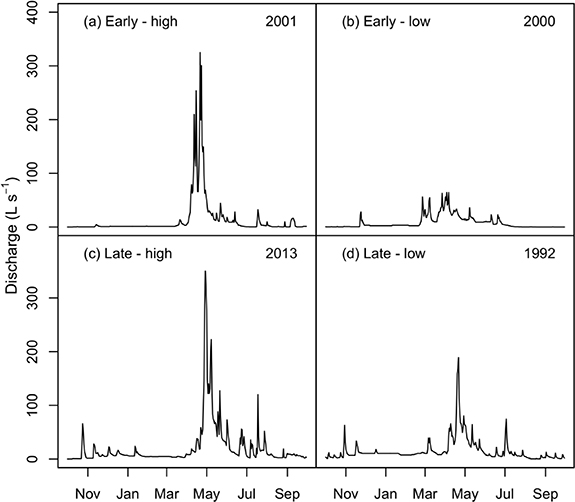
Figure 1. Four representative hydrographs of the stream at Calumet. (a) Early melt with high maximum SWE, (b) early melt with low maximum SWE, (c) late melt with high maximum SWE and (d) late melt with low maximum SWE. These four hydrographs correspond with the four melt scenarios proposed in table 1.
Download figure:
Standard image High-resolution imageTable 1. The 26 snowmelt hydrographs from this study, binned by melt timing and peak SWE. There has been large variation in seasonal snowpack and melt dynamics over the last 26 years, with a general trend of high SWE with late melts and low SWE associated with early melts.
| Likely future | |||
|---|---|---|---|
| Melt timing | Peak SWE (# in last 26 years) | change | Likely DOC export |
| Early | High (1 year) | (?) | Variable. High has punctuated export whereas |
| Low (10 years) | (+) | low has stormflow influences. | |
| Late | High (10 years) | (-) | Generally high. |
| Low (5 years) | (?) | Variable. |
2.2. Field procedures
Snow cores were measured weekly typically from mid-December to mid-April across four transects spanning the elevation gradient at Calumet, 1988–2013 (Stottlemyer and Toczydlowski 1991). The transects consisted of five sampling points and were measured weekly using a Federal sampler for snow moisture content (Stottlemyer and Toczydlowski 2006). These transects were averaged for a watershed SWE estimate. Continuous stream discharge was monitored using a 30 cm wide Parshall flume equipped with a Li-Cor datalogger and Stevens pressure transducer. Continuous data were integrated by day to calculate a daily measurement of runoff. Stream water samples were collected approximately weekly except during snowmelt, when samples were collected multiple times per week to capture the leading and trailing edges of the hydrograph. Water samples were collected in amber polyethylene 500 ml bottles and frozen for later analysis. Precipitation chemical composition data was acquired from the NADP monitoring site MI99 in Houghton, MI and was used to obtain monthly averages of  deposition (wet deposition) for the study period (1988–2013). Daily temperature data was collected from the National Oceanic and Atmospheric Administration (NOAA) station 3908 Houghton-Hancock County Airport 8 km south of the watershed.
2.3. Laboratory analysis
Water samples were immediately brought to Michigan Technological University for analysis. DOC sample analysis is described in detail by Stottlemyer and Toczydlowski (2006). Briefly, for the period (1988–1997) DOC was determined on filtered samples (0.45 μm) using a Dohrmann 180 (Teledyne-Tekmar-Dohrmann, Mason, Ohio) carbon analyzer. Post 1997, DOC concentrations were determined using a Shimadzu TOC-5000A analyzer (Shimadzu Scientific Instruments, Columbia, Maryland). Laboratory quality assurance procedures were previously described in detail (Stottlemyer and Toczydlowski 2006), and included analyses of split samples run as part of NADP, the Environmental Protection Agency's National Acid Precipitation Assessment Program (NAPAP) and continuous participation in the U.S. Geological Survey laboratory round robin program.
2.4. Data analysis
2.4.1. Snowmelt descriptors
Maximum SWE was calculated for each year. Maximum discharge date was defined as the date of the spring hydrograph peak. Traditionally, spring melt onset for river and stream discharge has been defined as the center of volume date (Hodgkins et al 2003). However, center of volume date does not necessarily reflect the onset of increased hydrologic connectivity with soils and snowpack. Therefore, we developed a metric based on the leading edge of the stream snowmelt hydrograph to identify the critical timing of the initial onset of spring (see for example, Contosta et al 2017). For this study, melt initiation was defined as the first day when a four-fold increase in stream discharge relative to winter baseflow was observed and sustained for a minimum of four consecutive days. Early and late melts were defined by the melt initiation date for a given year in relation to the median melt initiation date for the study period. To further characterize the duration of the spring freshet, we calculated the duration between melt initiation and peak runoff, hereafter referred to as steep time (days).
2.4.2. Statistical analysis
Because sampling was not conducted at a constant frequency, linear interpolation with respect to time was used to estimate DOC concentrations on a daily timestep, matching the temporal resolution of daily discharge measurements. One outlier (0.08 mg C l−1) was not leveraged for linear interpolation (see supplemental online material).
Linear regression analysis was used to test for significant trends in annual hydrologic and snowmelt variables for the time period (1988–2013; n = 26). Trends were reported if significant at p < 0.05. Bartlett tests were performed at three-year intervals on annual time series data to test for non-constant variance across years (Bartlett 1937). These trend analyses were conducted in R (version 3.3.2; R Core Team 2017). In our 26-year dataset, we examined broader changes in atmospheric  deposition, water year, mean annual air temperature, maximum winter SWE, and annual runoff, and tested for interactive effects on mean annual DOC concentrations and exports. We used a path analysis approach (Wright 1934) on annual descriptors, which enabled analysis of both direct and indirect effects on DOC concentrations and exports. We used the Calis procedure (LINEQS; SAS version 9.4, SAS Institute, Cary, North Carolina, USA) with the date of maximum stream discharge, maximum SWE, mean air temperature, and mean precipitation
  concentration as exogenous variables with paths to mean stream DOC concentration and mean DOC export; DOC concentration also had a path to DOC export. These exogenous variables were chosen to appropriately constrain the model without statistical redundancies (i.e. autocorrelation among variables, such as peak SWE and runoff). Error terms (STD statement) were estimated for DOC concentration and DOC export. The model was evaluated through examination of Standardized Root Mean Square Residual (SRMR) and the Bentler Comparative Fit Index (CFI; model accepted at <0.08 and >0.99, respectively; Hu and Bentler 1999). We report results from the covariance structure analysis (maximum likelihood estimation) for standardized direct and indirect effects (significant at p < 0.05).
3. Results
3.1. Changes in hydroclimate
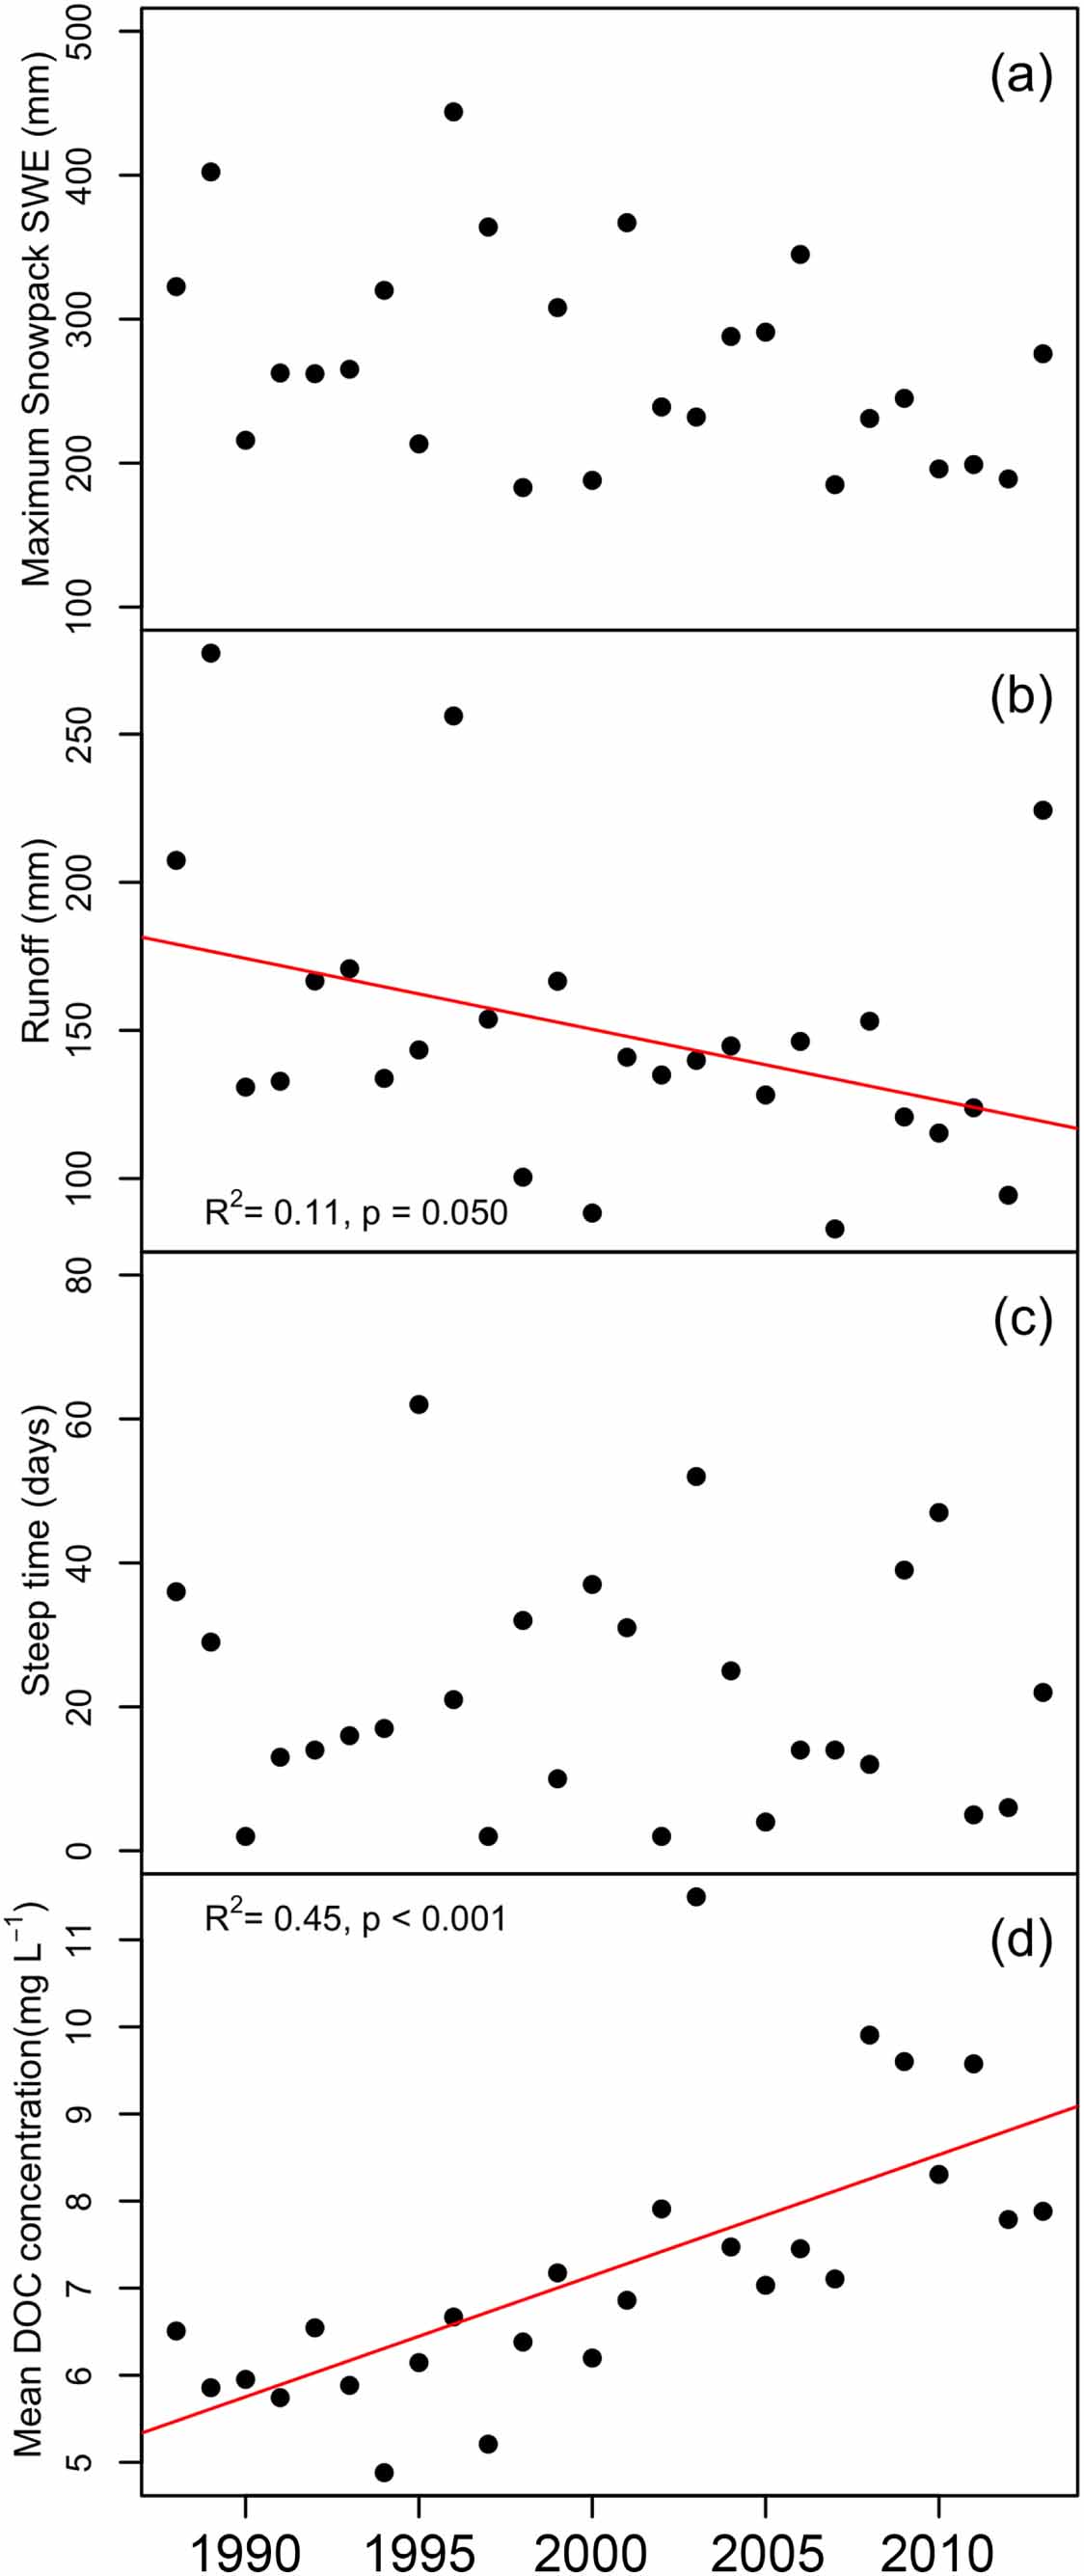
Variation in the onset of melt, and hence the duration of winter, as well as snowpack depth have changed over time. The occurrences of winters associated with high maximum SWE and extended snowmelt through the spring have declined over the study period (Bartlett test; p = 0.023; n = 26 years) (figure 2(a)). Annual cumulative runoff exhibited a marginally significant downward trend of 2.4 mm Y−1 (Standard Error, SE = 1.2 mm Y−1) (R2 = 0.11, p = 0.050; figure 2(b)). Steep time also showed decreasing variation through time, indicating spring climate is becoming more homogenous with less frequent extended snowmelt periods (Bartlett test; p = 0.033; n = 26 years) (figure 2(c)). There were no trends in temperature within the range of records reflected in this study (1988–2013). Temperature records extend beyond the solute records in this study (1948–2018), and there has been a long-term increase in air temperatures observed in August and September of 0.026 °C Y−1 (SE = 0.010 °C Y−1) and 0.034 °C Y−1 (SE = 0.009 °C Y−1), respectively (figure S2). However, annual mean temperature did not show a significant warming trend (mean of 4.5 °C).

Figure 2. (a) Variation in snowpack maximum SWE has declined over the study period (Bartlett test; p = 0.023; n = 26 years). (b) There has been a marginal decline in annual runoff at Calumet Watershed over the last three decades. (c) Variation in spring melt duration (steep time) has declined over the study period (Bartlett test; p = 0.033). (d) DOC concentrations have been increasing at Calumet when plotted continuously and as yearly means (slope = 0.14 mg C l−1 Y−1).
Download figure:
Standard image High-resolution image
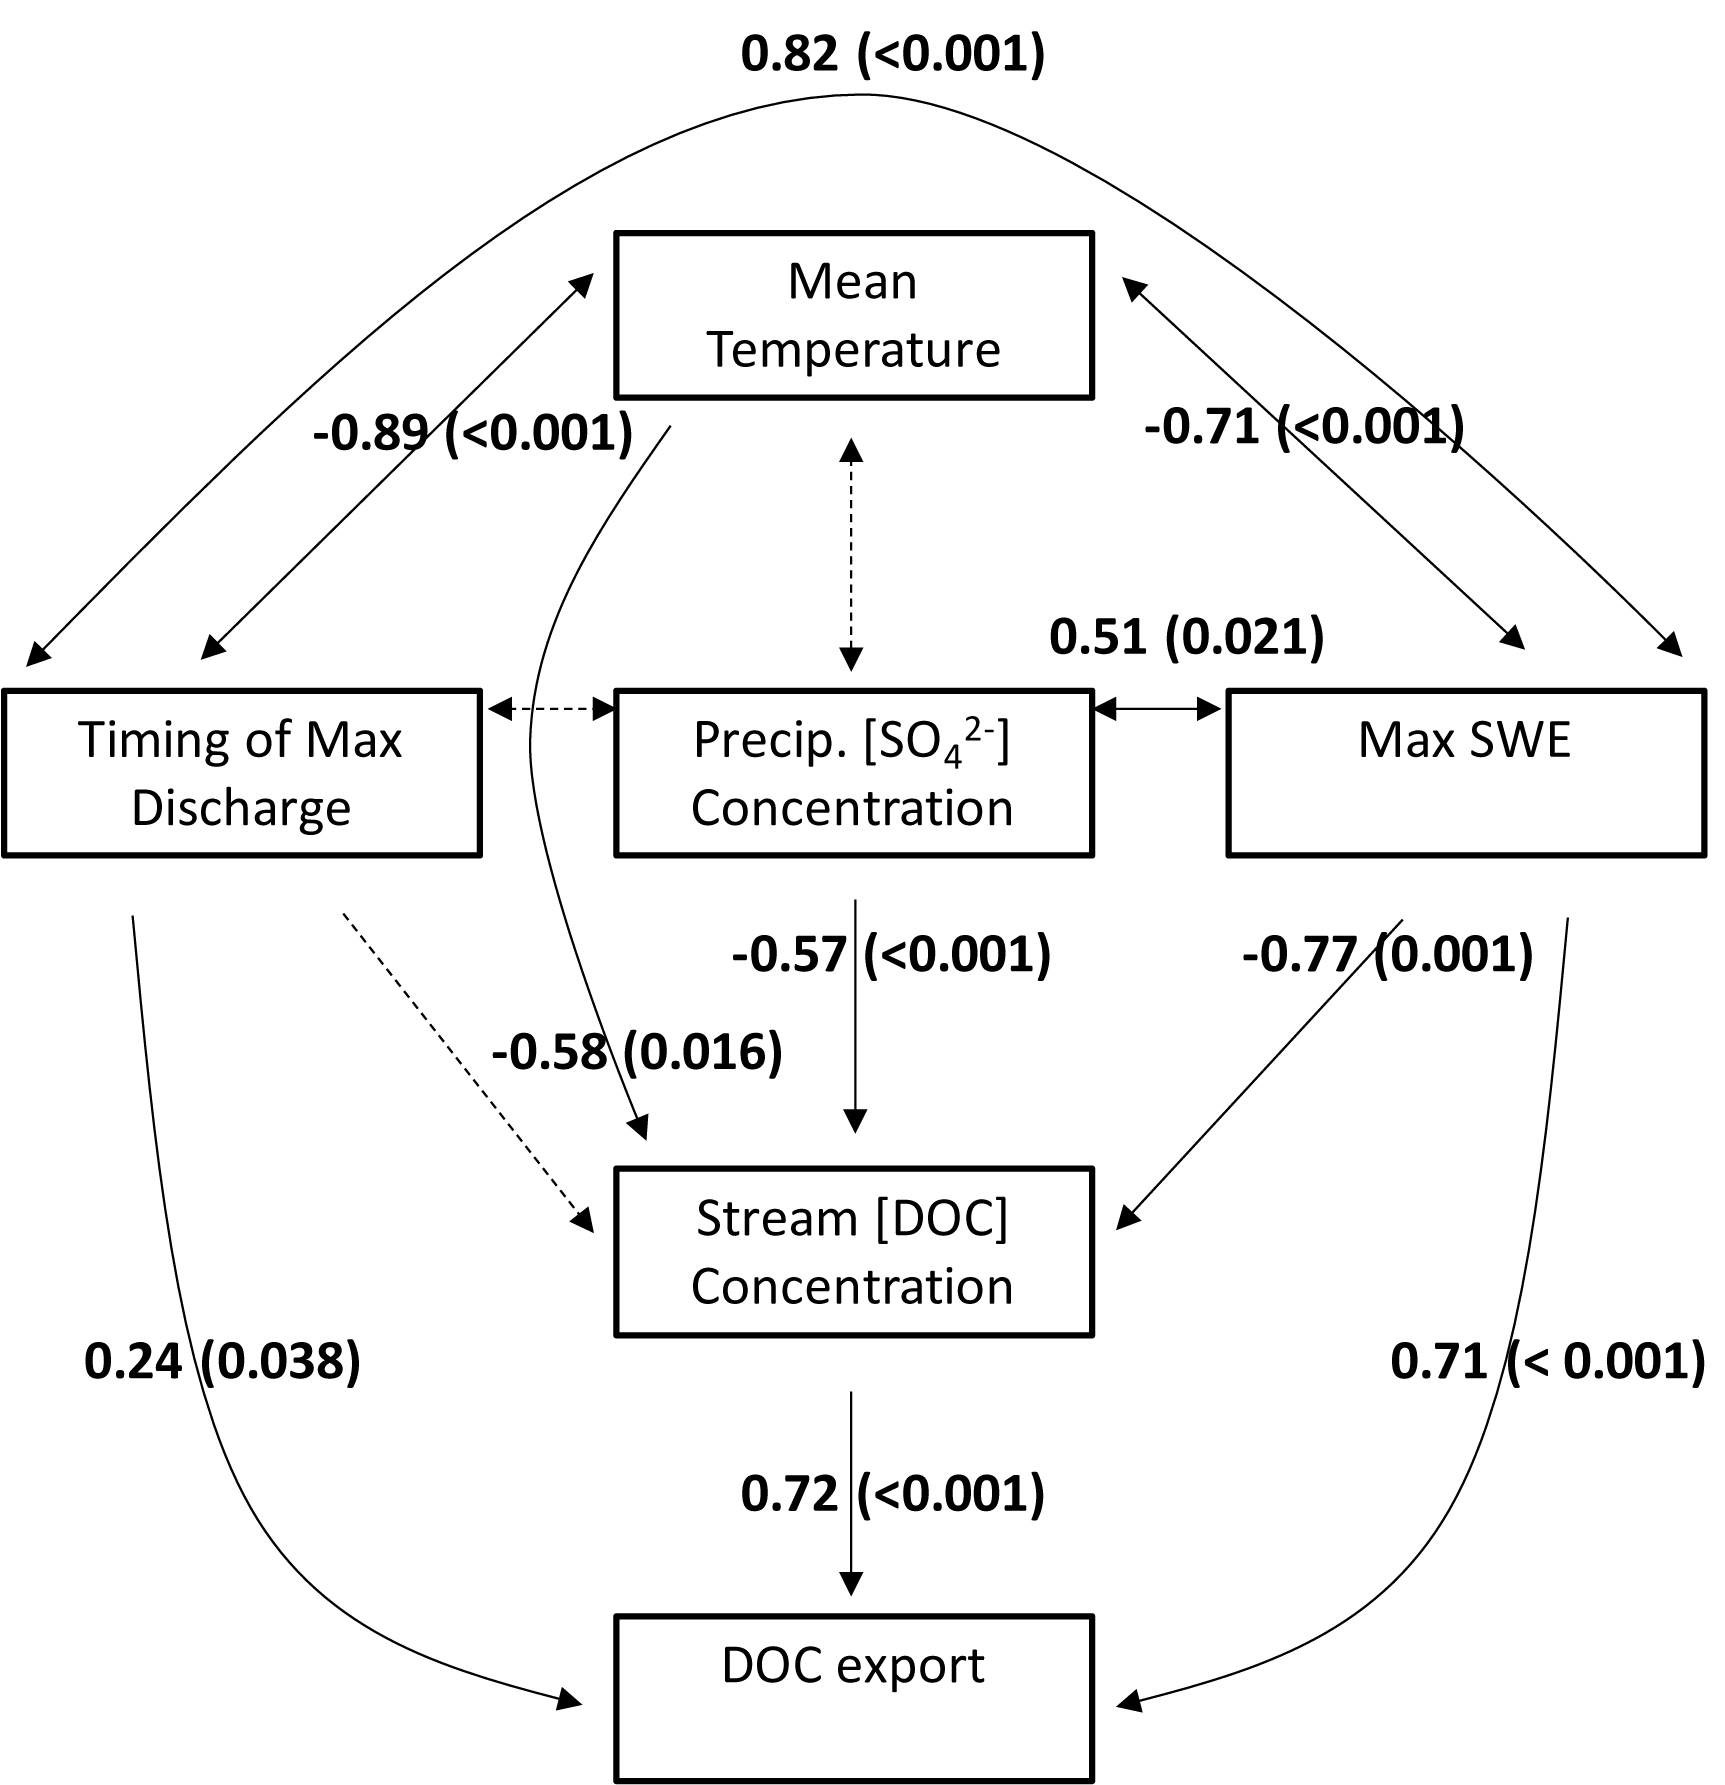
Figure 3. A path analysis used to test the effects of snowmelt dynamics, climate and atmospheric deposition on DOC concentrations and export (depicted here are direct effects). Bold text indicates significant effects (p value in parentheses; dashed lines are non-significant paths). Model Standardized Root Mean Square Residual (SRMR) = 0.004; Bentler Comparative Fit Index (CFI) = 0.994.
Download figure:
Standard image High-resolution image3.2. DOC concentrations and export
Stream DOC concentration ranged from 2.61 mg C l−1 to 20.00 mg C l−1 (mean = 8.12 mg C l−1 over the course of the study). Mean annual DOC concentrations increased significantly by 0.14 mg C l−1 Y−1 (SE = 0.03 mg C l−1 Y−1) (figure 2(d)).  concentrations in precipitation have been decreasing by approximately 0.026 mg l−1Y−1 (SE = 0.003 mg L−1 Y−1) in Northern Michigan (1988–2013; National Atmospheric Deposition Program; MI99; figure S3). Path analysis indicated that
  concentration had a direct negative effect (−0.57, p < 0.001) on DOC concentrations in the stream (figure 3). The path analysis also highlighted the negative effect of mean temperature on DOC concentrations (−0.58, p = 0.016), owing to the strong direct negative effects of mean temperature on maximum SWE (−0.71, p < 0.001) and in turn of maximum SWE on DOC concentrations (−0.77, p = 0.001).
Annual runoff showed a significant correlation with maximum SWE (R2 = 0.57, p < 0.001; figure 4(a)). Annual runoff also correlated with annual DOC export (R2 = 0.51, p < 0.001; figure 4(b)). There was a correlation between maximum SWE and annual DOC export (R2 = 0.18, p = 0.018) and maximum SWE had a positive direct effect on DOC export in path analysis (figure 3). Because maximum SWE was strongly negatively related to mean temperature, temperature also had a negative indirect effect on DOC export in path analysis (−0.41, p = 0.002; indirect path data not shown). Melt onset date and peak discharge date correlated strongly with annual DOC export (figure 5), and as such later maximum discharge corresponded to higher DOC exports (significant positive direct effect, 0.24, p = 0.038; figure 3). In addition, maximum SWE was also positively related to the timing of maximum discharge in path analysis (0.82, p < 0.001). Steep time, or the duration of melt, was not significantly related to annual mean stream DOC concentration or export (p = 0.338 and p = 0.451, respectively).
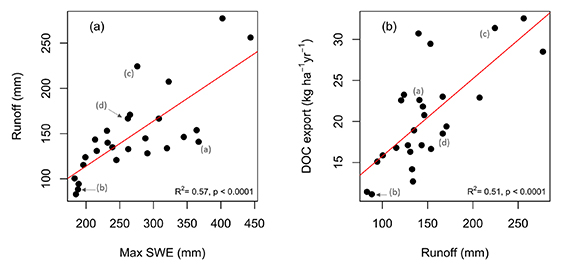
Figure 4. (a) Annual runoff (by water year) has been decreasing at the Calumet Watershed, which is correlated with changes in maximum SWE. (b) Runoff in turn is a major determinant of annual C export from this watershed. Grey letters correspond to representative water years in figure 1.
Download figure:
Standard image High-resolution image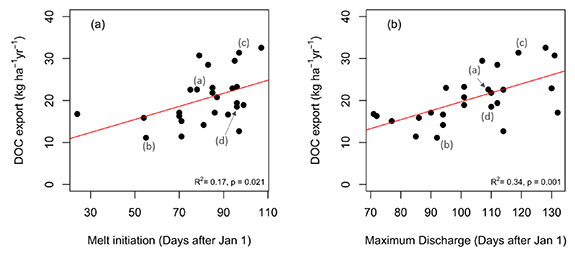
Figure 5. (a) Later onset of melt, a scenario which is predicted to occur less often in the future, has correlated with a greater export of carbon from Calumet Watershed. (b) The timing of maximum discharge is also correlated with DOC export, with later peak discharge resulting in greater carbon export (cf .figure 3). Grey letters correspond to representative water years in figure 1.
Download figure:
Standard image High-resolution image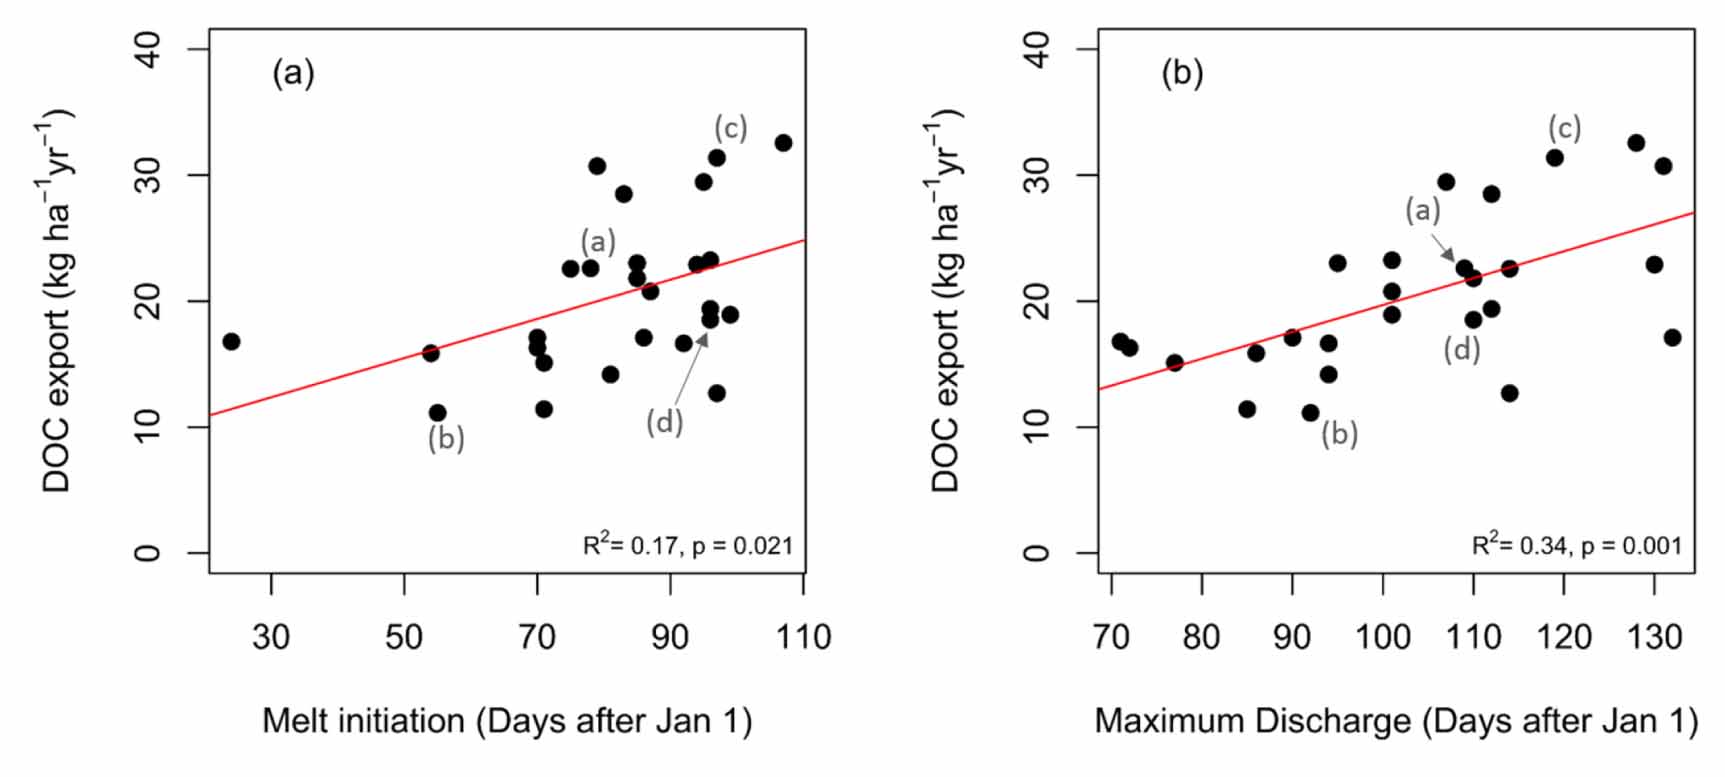
4. Discussion
4.1. DOC concentration
While snowmelt timing did not appear to directly influence annual stream DOC concentrations, factors related to snowmelt timing did correlate with DOC concentrations. Path analysis indicated that maximum SWE had a negative influence on DOC concentrations, likely through dilution effects (figure 3). However, the strength of this effect would be diminished if trends in maximum SWE continue to decline and if warming trends extend into the spring season. Mean temperatures had a negative effect on DOC concentrations in the path analysis conducted in this study. Prior research has observed an increase in DOC release in soils that experience freezing conditions, suggesting that the integrated effect of air temperature and winter snow cover duration drives soil frost formation and subsequently stream DOC concentrations (Haei et al 2010). The mechanism by which soil freezing increases DOC concentrations is likely a combination of increased solutes from root and microbial mortality (cell lysis) and solute concentration by freezing (Biederbeck and Campbell 1971, Fitzhugh et al 2001, Agren et al 2012). In addition to these mechanisms, we highlight here that soils in this study region typically do not freeze in the winter because of the depth and persistence of the snowpack; this effectively disconnects winter soil and air temperatures. It is possible that warmer fall temperatures (cf figure S2) could delay snowpack formation, which counterintuitively could permit freezing conditions in soils (Groffman et al 2001) and thus promote the release of DOC (Fitzhugh et al 2001, Haei et al 2012).
Stream DOC concentrations have been steadily increasing over the last three decades, while atmospheric  concentrations have declined. The steady decline in
  deposition offers a parsimonious explanation for the increase in observed DOC concentrations (Ledesma et al 2016). In addition, we highlight here that runoff appears to affect DOC concentrations and water delivery that drives export. Future work is needed to tease apart the complex role climate plays in mediating runoff, particularly in snowmelt dominated watersheds. These findings are in line with previous studies that have identified atmospheric deposition as the principal driver of increased DOC concentrations in surface waters, while highlighting the important influences of climate factors with strong seasonal effects on carbon concentrations (see Clark et al 2010, and references therein). For example, seasonal changes in snowmelt flushing and precipitation events create considerable variation in DOC concentrations (cf coefficients of variation ranging from 27%–39%; Creed et al 2003), with important implications for DOC export dynamics.
4.2. DOC export
Winter snowpack has the largest direct effect on DOC export through runoff (figure 4). Additionally, snowmelt timing shows a positive correlation with annual DOC export for the watershed, which is also influenced by snow water equivalences (figure 3). These results indicate that the amount of water in the snow is more significant than the timing of snowmelt in controlling DOC export. However, temperature appears to have a greater effect on timing than snow water equivalence (figure 3), which could alter the relative magnitudes of these effects in the future. The decline in runoff over time (figure 2(b)) along with the direct and indirect effects of snowmelt and temperature on export (figure 3) offer countervailing effects which result in no time trend for DOC export. Other studies of temperate zone streams have also identified an increase in stream DOC concentrations with no associated increase in export (Urban et al 2011, Coble et al 2018, O'Driscoll et al 2018). Our analysis suggests that slight changes in runoff combined with indirect controls of temperature and snowmelt can offset effects of increased DOC concentrations and attenuate DOC exports. However, this is further complicated by the co-occurrence of slow-melt and low snowpack years (denoted by subscript letters (b) and (d) in figure 1; table 1), which add considerable variation to interannual DOC exports (figure 5).
The large proportion of seasonal precipitation falling as snow is a distinctive characteristic of watersheds in the northern Great Lakes region like the Calumet watershed, as it consistently provides a baseline minimum amount of water in spring runoff capable of flushing a minimum amount of DOC each year. While variation in snowpack among years was quite high in the Calumet watershed, the record shows there was always at least approximately 180 mm of water in peak snowpack (figure 2(a)). As such, runoff contributions from rainfall would have to be very large events—around 180 mm of precipitation in a given storm—to significantly alter the shape of the snowmelt-dominated hydrograph (e.g. figure 1). While larger and more variable storms are expected to occur more frequently in the Great Lakes region (Kossin et al 2017), the spring freshet is likely to remain the largest pulse of DOC export from watersheds in this region. Late fall runoff was generally the second largest pulse of DOC from the watershed. Late summer baseflow has been related to maximum SWE in mountainous regions (Godsey et al 2014, Barnhart et al 2016). In this study, July and August runoff showed significant linear trends with both maximum SWE (R2 = 0.65; p < 0.001 and R2 = 0.38; p < 0.001 respectively; figures S4 and S5) and melt initiation (R2 = 0.64; p < 0.001 and R2 = 0.37; p < 0.001 respectively; figures S4 and S5). Although speculative, this suggests that snowmelt recharge is significant for late summer baseflow conditions and subsequent DOC export. This highlights the importance of winter snowpack in these regions on the annual hydrograph and subsequent DOC exports.
4.3. A changing hydrograph
Given climate change predictions for areas with high snowfall (e.g. Musselman et al 2017), we expect changes in the hydrographs of snowmelt-dominated tributaries, with consequences for solute export (cf Marcarelli et al 2019). Most notably, these predictions indicate earlier and slower snowmelt to prolong the hydrograph with an earlier melt onset. Although this 26 year study period contains more years in the late- than early-season melt scenario (15 and 11 years, respectively; table 1), our results indicate that both earlier and slower snowmelt may lead to decreased DOC exports. Exactly how climate-induced changes in the spring hydrograph affect DOC exports will depend on the persistence of increasing DOC concentrations, snowmelt dynamics and temperature. While trends to date are best represented as linear processes, we stress here that the increasing DOC concentrations and declining peak SWE may exhibit non-linear or threshold responses in the future. For example, runoff cannot continue to decline at the same rate indefinitely, and the increasing DOC concentrations should reach a new stable state over time (Monteith et al 2007b). As such, long-term monitoring efforts are invaluable for detecting novel patterns of DOC export.
Acknowledgments
The data that support the findings of this study are openly available at: (SWE, ancillary data) https://doi.org/10.1594/PANGAEA.910057; (discharge data) https://doi.pangaea.de/10.1594/PAN-GAEA.913484; and (DOC concentration data) https://doi.pangaea.de/10.1594/PANGAEA.913485. The authors would like to thank Dr. Robert Stottlemyer for original study design and purveyance of long-term data. This work was supported by the USDA-Funded McIntire-Stennis Program and with in-kind support from the USDA Forest Service, Northern Research Station. The NASA Earth and Space Science Fellowship supported Karl Meingast. We would also like to thank four anonymous reviewers for their helpful comments improving the analyses and flow of the manuscript.
Data availability statement:
The data that support the findings of this study are openly available at the following URL/DOI: https://doi.pangaea.de/10.1594/PANGAEA.913485.