

Abstract
Groundwater provides a vital source of drinking water for rural communities in many parts of Africa, particularly in the dry season when there are few safe alternative sources. This paper summarises results from a study (n = 428) assessing dry season water quality, both microbiological and inorganic chemistry, in handpump equipped boreholes (HPBs) across the Ethiopia Highlands (n = 142), Malawi (n = 162) and Uganda (n = 124) using a stratified, randomised sampling design. This study seeks to examine general water quality by randomly sampling rural groundwater supplies across larger areas with different geology and climate. The majority, 72%, of HPBs surveyed provide good quality dry season drinking water as defined by WHO drinking water quality criteria. Within this overall picture, the most notable constraints were from thermotolerant coliforms (TTCs), which exceeded the WHO drinking water guideline of zero colony forming units (cfu/100 ml) in 21% of sites (range 0–626 cfu/100 ml). TTC contamination was found to have a significant and positive correlation with annual average rainfall (ρ = 0.2, p = 0.00003). Across all three countries, WHO health based chemical drinking water quality values were exceeded at 9% of sites and were found for manganese (4%), fluoride (2.6%) and nitrate (2.5%); arsenic concentrations were below the guideline value of 10 μg l−1 (range < 0.5–7 μg l−1). The high percentage of Mn exceedances (14% ± 5.2% >400 μg l−1) found in drinking water sources in Uganda challenges the decision by WHO not to formalise a health-based guideline for Mn. While the overall level of microbiological contamination from HPBs is low, results from this study strongly suggest that at a national and regional level, microbiological contamination rather than chemical contamination will provide a greater barrier to achieving targets set for improved drinking water quality under the UN-SDG 6. Efforts should be made to ensure that boreholes are properly sited and constructed effectively to reduce pathogen contamination.
Export citation and abstract BibTeX RIS

Original content from this work may be used under the terms of the Creative Commons Attribution 4.0 license. Any further distribution of this work must maintain attribution to the author(s) and the title of the work, journal citation and DOI.
1. Introduction
Groundwater is the major source of drinking water in Africa (Foster et al 2008, Pavelic et al 2012, Gaye and Tindimugaya 2019) and use of groundwater for drinking water is increasing due to population and economic growth (Vörösmarty et al 2005, United Nations Department of Economic and Social Affairs Population Division 2019) and the search for climate resilient water supplies (Howard et al 2016). Boreholes equipped with handpumps (HPBs) are the main method by which people access groundwater in rural areas (JMP 2019). Household supplies of water come from a wide range of different sources including HPBs, shallow hand-dug wells, springs, ephemeral rivers, harvested rainfall and piped water supplies, depending on local/seasonal availability, hydrogeological conditions and the level of investment in water infrastructure (UNICEF and WHO 2015). Compared to surface water sources or shallow hand-dug wells, HPBs usually tap deeper aquifers that are more resilient to inter-annual climate variability (Chilton and Foster 1995, Macdonald et al 2009, Lapworth et al 2013, Taylor et al 2013). For many rural communities in Africa, HPBs are an integral part of household drinking water supply and are often the only source in the dry season, or longer periods of drought (Calow et al 2010, Macdonald et al 2019).
Understanding the quantity and accessibility of groundwater available for rural community supplies in Africa has been the primary focus of regional research to date (e.g. Macdonald et al 2012; Bonsor et al 2018, Cuthbert et al 2019). In contrast, the quality (both chemical and microbiological) of groundwater resources in Africa has tended to focus on areas with known natural water quality problems such as arsenic and fluoride (Reimann et al 2003, Edmunds and Smedley 2005, 2013, Rango et al 2013), contamination from mining (Smedley 1996, Von Der Heyden and New 2004) or urbanisation (Lapworth et al 2017a). Regional groundwater quality information is nevertheless essential for assessing the availability of safe drinking water across Africa (Bartram and Cairncross 2010, Hunter et al 2010, Parker et al 2010). HPBs are often reported to have better water quality compared to other groundwater sources (Parker et al 2010, Sorensen et al 2015a). However, the baseline water quality of HPBs sources in Africa remains understudied compared to other continents globally. Africa wide meta-analyses of groundwater quality have been undertaken for selected water quality parameters, including nitrate (Ouedraogo and Vanclooster 2016), fluoride (Kut et al 2016), arsenic (Ahoulé et al 2015) and faecal contamination (Bain et al 2014). These meta-studies have highlighted that the majority of published studies on groundwater quality in Africa have (i) limited geographical and geological scope, (ii) studies rarely consider paired observations of microbiological and chemical water quality, and (iii) results are often reported from a mixture of different groundwater source types (e.g. Smedley 1996, Reimann et al 2003, Parker et al 2010, Sorensen et al 2015b, Bretzler et al 2017).
Groundwater sources in Africa are commonly used for drinking water and cooking with no (or very limited) treatment and as such understanding the raw chemical and microbiological quality of these sources remains a key priority from a human health perspective (Bain et al 2014). HPBs are a critical component of 'improved' drinking water sources (JMP 2018). Therefore, characterising HPB drinking water quality is required to ensure the provision of safe drinking water in this region and contribute to assessing progress towards the UN Sustainable Development Goal (SDG) 6 (UN 2015). This type of information underpins future investment in HPB, and other improved infrastructure on the Joint Monitoring Programme (JMP) drinking water service ladder (JMP 2018), as well as aesthetic considerations, water treatment options and management of this finite freshwater resource.
The objective of this paper is to investigate the drinking water quality from HPBs in sub-Saharan Africa, specifically in eastern and southern Africa, using paired microbiological and chemical water quality data. A large subsample of rural HPBs from three countries (Ethiopia, Malawi and Uganda) were included in this study, which represent many of the major hydrogeological/climate settings found in populated Africa. As far as the authors are aware, this is the largest multi-country water quality survey of HPBs undertaken in Africa. Drinking water quality is compared against World Health Organisation (WHO) criteria to assess current performance against SDG6 (UN 2015) drinking water targets. This study aims to (i) quantify the key health-based water quality exceedances that may affect HPB users; (ii) assess the relative proportion of water quality exceedances from microbiological and inorganic chemical parameters; and (iii) investigate the relationship between HPB water quality and aquifer type, the length of the dry season and annual average rainfall.
2. Methods
2.1. Experimental design and study area
The three countries, Ethiopia, Malawi and Uganda, were chosen because they cover a range of the geological and climatic conditions found in Africa and also rely on HPBs for much of their rural water supply (JMP 2018). Both climate and geology may have an impact on the water quality of HPBs, i.e. the geochemistry of groundwater and likelihood of microbiological contamination. Using a stratified randomised approach, we anticipate that the results from this study are not constrained or unduly influenced by localised conditions or anomalies, for example natural variations in geology or localised climate anomalies. The planning for this study was undertaken through detailed consultation with national ministries and district level water officers to obtain the most comprehensive record of HPBs at the district and community level. Sampling was undertaken by a two-stage stratified random design. The primary sample units, which were stratified, were Woredas in Ethiopia and Districts in Malawi and Uganda. These primary units were determined largely by accessibility, but some primary units that were known to have very few HPBs were excluded. In Ethiopia the stratification was based on a combination of aquifer class (fractured igneous or porous igneous). The Woredas in each of these categories were then divided into poverty classes ('better off' or 'poorer'). In Malawi and Uganda the stratification was by poverty class (again, 'better off' or 'poorer'). Random selection of primary units within the strata was done without replacement using the Rao–Hartley–Cohran (RHC) sampling procedure (Cochran 1977). Within the selected districts or woredas, communities were then selected by simple random sampling and from each one a HPB was selected for examination.
Figure 1 shows the location of the HPB survey sites as well as the geology and climate of the study area. HPB sample sites were collected from four key aquifer types found in Africa (Macdonald et al 2012): crystalline basement, consolidated sediments, unconsolidated sediments, and volcanic rocks (both fractured and porous igneous rocks). Note that the known high fluoride areas of the rift valley in Ethiopia were not sampled, partly due to the low coverage of rural water supply handpumps in this area compared to other areas. Sites also encompassed a range of climates, spanning regions with zero dry months/years through to dry seasons of up to 6 months/years. Sampling was undertaken during dry periods to facilitate access to remote field areas. As a one-off survey, this also minimises seasonal impacts on water quality and characterises water quality under conditions when there are few alternative sources of drinking water. Annual average rainfall data (1901–2012) for each location was obtained from (Jones and Harris 2013).

Figure 1. Study areas: (a) location map showing HPB sampling sites in Ethiopia, Uganda and Malawi, (b) simplified aquifer geology based in (Macdonald et al 2012), (c) long-term annual average rainfall (mm) based on data (1951–2000) derived from CRU TS 3.21, University of East Angila.
Download figure:
Standard image High-resolution image2.2. HPB sampling and groundwater analysis
HPBs were purged, by a minimum of three borehole volumes, prior to sampling to obtain a representative groundwater sample from the aquifer. Field measurements of pH and specific electrical conductivity (SEC) were made and stable readings obtained prior to sampling. In-situ field measurements of turbidity and alkalinity were also undertaken. Two samples for dissolved inorganic chemistry, one for anions and one for cations, were filtered in the field (<0.45 micron) and stored in air-tight Nalgene bottles. Anion sample bottles were filled to the top to exclude air. Major anions were analysed by ion chromatography, samples for major cation and trace element analysis by ICP-OES and ICP-MS were preserved using analysis grade nitric acid (1%v/v) (e.g. Lapworth et al 2013). Inorganic chemical analysis was undertaken by CSIRO Land and Water Analytical Services, Adelaide, South Australia using accredited analytical methods. Total dissolved solids (TDS) was calculated by summing the major anion and cations. Field blank samples were collected using the same procedure. Samples were stored in a cool box in the field and then transferred to a field refrigerator the same day for storage during fieldwork prior to analysis.
We assess microbiological water quality using thermotolerant coliforms (TTCs), an indicator of faecal contamination (see Sorensen et al 2015a). HPB samples were collected in the field using sterilised 250 ml sample bottles and processed using a Delagua® incubator in the field within 7 h of sampling. Samples were stored in a cool box in the field prior to processing. TTCs were isolated and enumerated using the membrane filtration method and Membrane Lauryl Sulphate Broth (MLSB. Oxoid Ltd) as the selective medium. Processed samples were incubated at 44°C for between 18–24 h prior to counting of colony forming units (cfu). Typically, 100 ml of sample was filtered through 0.45 micron nitrocellulose membrane giving a detection limit of 1 cfu/100 ml. We examined incubation plates within 15 min after being removed from the incubator. All cream to yellow colonies with a diameter greater than 1 mm were considered to be TTCs and were counted. We carried out daily blanks and repeat samples for TTCs to check for cross-contamination and quantify precision. A few over-range TTC samples that were 'too numerous to count' were diluted and incubated within 24 h. A comprehensive water quality screening for TTCs and 13 potentially hazardous inorganic parameters (F, NO3, B, Se, Cr, Mn, Ni, Cu, As, Mo, Cd, Sb, and Pb) was undertaken in all HPBs.
2.3. Statistical analysis
The estimation of national mean values for the variables of interest, or for indicator variables which exceeded WHO health-based thresholds, was based on the two-stage cluster sample design described above. Stratum means and variances were combined to give an estimate of the mean at a national scale, and an associated error, based on stratum relative areas (see Cochran 1977 for a full account of how this is done for RHC stratified random two-stage sampling). In the first instance the stratum relative areas were computed from the number of water points in each stratum. This is the most straight-forward estimate, but it relates only to the original sample domain, i.e. to the set of Woredas or districts in each country deemed to be available for sampling. An alternative estimate was computed in each country (up-scaled country estimate), based on the estimated relative areas of the strata at a national scale (igneous aquifer types only in Ethiopia). This requires the assumption that the stratum mean for the sample domain is an unbiased estimate of the equivalent stratum mean at a national scale. The relative areas of the strata at the national scale were computed from information on shallow well numbers in Ethiopia, numbers of villages in Uganda, and numbers of rural enumeration areas from the Third Integrated Household Survey of Malawi (NSO 2012).
Box-plots used in the paper were generated using the 'cenboxplot' function from the NADA package in the open source software R v. 3.6.1 (R Core Team 2019). Percentiles in the grey area are estimated using regression on order statistics (ROS), box whiskers extend to 1.5 × interquartile range, and outliers are shown as small circles. Where insufficient data were available to generate a box-plot, dot-plots were used instead. Spearman's rank correlation coefficient and p values where stated were calculated using R.
3. Results
3.1. Health based water quality status of HPBs
The proportion of sites that exceed WHO health based chemical and microbiological guideline values (WHO 2017), as well as TDS (which has an aesthetic threshold) for both country sampling domains and up-scaled country estimates are summarised in figure 2. A summary of the results and exceedances (and standard errors) of WHO criteria for all water quality parameters investigated are presented in the supplementary information (table S1 is available online at "(stacks.iop.org/ERL/15/064020/mmedia)"). Overall, WHO health based chemical drinking water quality values were exceeded at 9% of sites and were only found for manganese (4%), fluoride (2.6%) and nitrate (2.5%). Rates of TTC detections above the WHO drinking water guideline value of zero cfu vary considerably between countries (range 13%–24%). However, they are higher than the rates for chemical exceedances of WHO drinking water guidelines (range 0%–14%) in all three countries (figure 2).
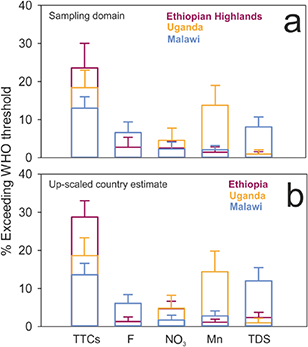
Figure 2. Summary exceedance of WHO drinking water criteria from HPB. (a) Comparison of exceedances based on sampling domain, (b) comparison of exceedances based on up-scaled country estimates. Health based thresholds for TTCs, F, Mn, NO3, as well as TDS based on a taste acceptability thresholds of 1000 mg l−1 (WHO 2017).
Download figure:
Standard image High-resolution imageHealth based chemical drinking water exceedances were only found for manganese, fluoride and nitrate (figure 2); arsenic was not detected above the WHO guideline value of 10 μg l−1. For sampling domain estimates, fluoride accounted for the largest proportion of chemical drinking water exceedances (>1.5 mg l−1) in Malawi (6.6% ± 2.8%). Manganese (>400 μg l−1) accounted for the largest proportion in Uganda (13.8% ± 5.2%) and nitrate (>50 mg l−1 NO3) the largest proportion also in Uganda (4.6% ± 3.2%). TDS was found to be >1000 mg l−1 at 8.1% ± 2.6% of sites in Malawi and 1% ± 0.6% and 1% ± 1% in Highland Ethiopia and Uganda, respectively. Overall, sampling domain estimates were comparable with up-scaled country estimates, within error, for each survey country. Sampling domain based exceedance estimates for Ethiopia were the highest (23.6% ± 6.5%) of any country, and were significantly higher than those from Malawi (13% ± 3%). However, they were within the standard error for Uganda. Malawi was found to have significantly higher fluoride and TDS exceedances compared to the other countries for both sampling domain and up-scaled country estimates. However, the national estimate for Ethiopia was based on data from Highland regions and specifically excluded the rift aquifer system. Uganda had significantly higher exceedance rates for manganese compared to Ethiopia and Malawi. Exceedances for nitrate were not significantly different for the three countries used in this study, for both sampling domain and up-scaled country estimates. In addition, zinc exceedances (on aesthetic grounds, i.e. >3000 μg l−1) were significantly lower (zero) for Malawi compared to the other countries (table S1), high Zn concentrations (>1000 μg l−1) were only observed in sites that use India Mark II pumps, this is due to a combination of the corrosive nature (pH < 6.5) of some groundwaters in this study and galvanised pump components used in this pump model (figures S1 and S3).
Figure 3 shows mean and standard error plots for each country, estimated using sampling domain, for water quality parameters which exceed the WHO health based drinking water criteria (TTC, F, NO3 and Mn) as well as TDS where aesthetic criteria are exceeded. With the exception of TTCs and Mn, mean estimates were all below WHO health and aesthetic guideline values. The differences in water quality issues, which dominate in each of the three countries are apparent in figure 3. Mean TTC values are higher for Highland Ethiopia (15 ± 3 cfu/100 ml) compared to Uganda (6.3 ± 6.5 cfu/100 ml) and Malawi (0.2 ± 0.4 cfu/100 ml). However, mean values are only significantly different between Ethiopia Highlands and Malawi due to the high standard error in the Uganda estimates (figure 3(a)). Mean fluoride concentrations are below 0.5 mg l−1 (500 μg l−1) in all three countries and were comparable for Ethiopia (402 ± 89 μg l−1) and Malawi (336 ± 87 μg l−1), and significantly lower for Uganda (116 ± 16 μg l−1). Mean nitrate concentrations were comparable for all three countries, and were below 15 mg l−1 NO3. Mean manganese concentrations in Uganda were significantly higher compared to Highland Ethiopia and Malawi (figure 3(b)). In Uganda, mean concentrations (150 ± 39 μg l−1) were below the current health-based WHO value of 400 μg l−1, but significantly above the aesthetic threshold of 100 μg l−1 (WHO 2017). Mean TDS concentrations were <500 mg l−1 in all three countries and were found to be significantly different in each country. Mean TDS concentrations were highest for Malawi (428 ± 45 mg l−1) and almost twice the mean concentrations for Uganda (266 ± 23 mg l−1); Malawi also had the highest outlier values and exceeded taste-aesthetic criteria of 1000 mg l−1.
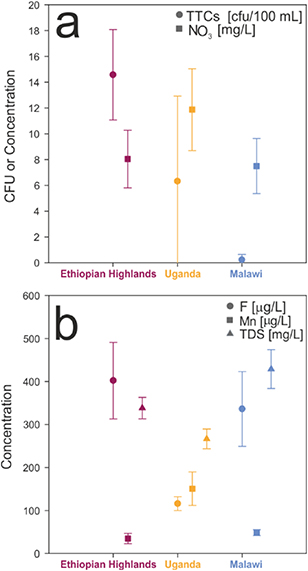
Figure 3. Distributions for key water quality parameters estimated for sampling domains. Mean and standard error for (a) TTC (cfu/100 ml) and nitrate (mg l−1), (b) fluoride (μg l−1), manganese (μg l−1), and TDS (mg l−1).
Download figure:
Standard image High-resolution image3.2. Variations in water quality with the number of dry months, annual average rainfall and aquifer type
Figure 4 summarises, as box-and-whisker plots and cross-plots, the variation in health based water quality parameters with the number of dry months, average annual rainfall and aquifer type. There are no obvious visible associations between the number of dry months and either microbiological or inorganic water quality or the number of sites that exceed WHO drinking water thresholds.
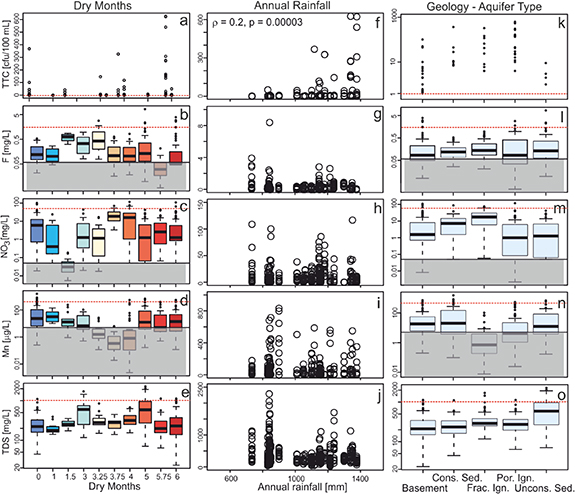
Figure 4. Box-plots of health based water quality parameters with exceedances grouped by number of dry months and aquifer type (hydrogeology classifications): Basement, consolidated sediments (Cons. Sed.), fractured igneous (Frac, Ign.), porous igneous (Por. Ign.), unconsolidated sediments (Uncons. Sed.). Dashed line shows WHO guideline value (health-based value, or aesthetic in the case of TDS) . Spearman's rank correlation coefficient and p value shown for results in plot f.
Download figure:
Standard image High-resolution imageLow numbers of high (outlier) values for TTC and other inorganic health based water quality parameters are distributed across the range of climate settings used in this study (figures 4(a)–(e)). There are, however, significantly higher TTCs (figure 4(f)) at locations with higher annual average rainfall totals (ρ = 0.2, p = 0.00003, Spearman's rank correlation), the relationship is particularly clear for sites where annual rainfall exceeds 1000 mm a−1, but no significant correlation for the other health based water quality indicators in relation to average rainfall totals were found (figures 4(g)–(j)). TTC exceedances are observed in all aquifer types, with overall lower counts found in unconsolidated sediments compared to the other aquifer types (figure 4(k)). Median F concentrations are comparable and below 0.5 mg l−1 for all aquifer types, whilst most of the outliers, which exceed the WHO threshold of 1.5 mg l−1 are from basement and unconsolidated sediments (figure 4(l)). Highest median nitrate concentrations are found in fractured igneous aquifers and are higher than those from porous igneous and unconsolidated sediments. However, outliers >50 mg l−1 are found in all aquifer types except unconsolidated sediments. Unconsolidated sediments have the highest TDS concentrations, with median values >500 mg l−1 (figure 4(o)).
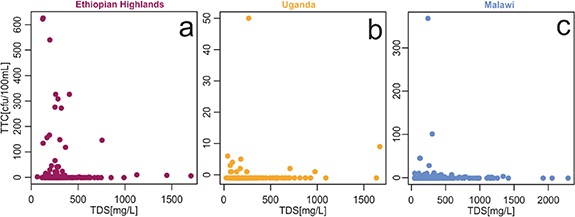
Figure 5 shows cross-plots of TTCs vs TDS for all three countries. It is apparent that in all three countries the highest TTC detections are found in samples with typically low TDS, and low values for TTCs were found in samples with higher TDS.
Figure 5. Cross-plot of TTCs vs TDS: (a) Ethiopia Highlands, (b) Uganda, (c) Malawi.
Download figure:
Standard image High-resolution image
4. Discussion
This study shows that the water quality in the majority of HPBs included in this survey is of acceptable drinking water quality based on WHO criteria. Health based exceedances were only found for TTCs, F, Mn and NO3 and rates for exceedances for individual inorganic parameters were <10% across all three countries. This contrasts with the more widely reported issue of high groundwater nitrate concentrations elsewhere globally due to leaching of anthropogenic N sources (USGS 1999, Shand and Edmunds 2008, Gu et al 2013, Ascott et al 2017, Padilla et al 2018). The majority of groundwaters with F concentrations >1.5 mg l−1 (9 out of 11 sites in this study) were found in Malawi, the other two sites were from the Ethiopian Highlands where the concentrations were below 4 mg l−1 for all but one sample. High F groundwater's are well documented in both countries and have been linked to hydrothermal sources (Bath 1980, Reimann et al 2003, Rivett et al 2019). They are also found in high concentrations in other parts of the East African Rift system (Malago et al 2017). Arsenic was not found above the WHO limit of 10 μg l−1 in any HPB in this study, even though As has been reported to be an issue in some other parts of Africa (e.g. Smedley 1996, Smedley et al 2007, Ahoulé et al 2015), including in some of the countries that were surveyed as part of this study (e.g. Bamuwamye et al 2017). This perhaps reflects the more purposeful nature of sampling designs in many published studies (i.e. targeting likely As hot-spots), which contrasts with the randomised design that was used in this study. However, overall the evidence from this study shows that As contamination is not likely to be a widespread issue across this region and is more likely associated with particular geological settings, for example F and As hot-spots in the Rift Valley (e.g. Rango et al 2017).
For a small but significant proportion of sites, manganese was found to exceed the WHO health based drinking water criterion of 400 μg l−1 in all three countries (figure 2). Highest manganese concentrations were found in Uganda, up to 1550 μg l−1 (95th percentile of 566 mg l−1, table S1) and these high concentrations are consistent with previous studies in Uganda and Malawi (e.g. Bath 1980, Taylor and Howard 1994). In this study, mean up-scaled country estimates were 34 ± 12 μg l−1, 48 ± 7 μg l−1 and 150 ± 39 μg l−1 for Ethiopia, Malawi and Uganda, respectively; all considerably lower than the WHO health based guideline value of 400 μg l−1. Manganese exceedance was significantly higher for Uganda (13.8% ± 5.2%) compared to 2.1% ± 1.1% and 1.5% ± 1.4% for Malawi and the Ethiopian Highlands, respectively. Elevated manganese has often been reported as a co-contaminant with high arsenic (Mitchell et al 2011), and is often linked to reducing and low pH conditions (e.g. Homoncik et al 2010). However, no association between high Mn and high As or Fe or low pH was found in this study (figure S1), in contrast to other studies globally (Edmunds and Smedley 1996, Buschmann et al 2007). For communities reliant on groundwater sources with values approaching or exceeding 400 μg l−1, the findings from this study challenge the decision by WHO (2017) that a formal drinking water guideline value for Mn (400 μg l−1) is not required. Since water is aesthetically poor at 100 μg l−1, and the mean concentrations in Uganda were found to be significantly higher than this aesthetic threshold (150 ± 39 μg l−1) and were being used as drinking water sources, some review of the guideline is required. Other studies in Ghana (Rossiter et al 2010) and elsewhere globally (e.g. Homoncik et al 2010) have also shown a high proportion (11% and 9%, respectively) of rural drinking water supplies above 400 μg l−1.
Occurrences of dry season microbiological contamination were found to be low for HPBs. Overall, 79% of HPBs were free from TTCs, and <10% of sites are classified as medium (10 to <100 cfu/100 ml) or high (100 to <1000 cfu/100 ml) risk, based on WHO classifications. Although the exceedances were low overall, HPBs were more than twice as likely to fail based on microbiological contamination (i.e. TTCs > 0 cfu) compared to inorganic (WHO) water quality criteria (figure 2). The occurrence of TTCs in HPBs varied considerably between country, with detection rates (>0 cfu/100 mL) in the Ethiopian Highlands (23.6% ± 6.5%) almost twice as high as Malawi (13% ± 3%). These results are in stark contrast to a recent survey by the Central Statistical Agency in Ethiopia that showed 85% of boreholes surveyed had TTCs > 0 cfu/100 ml (CSAE 2017), which may be due to differences in sampling methodology. (Parker et al 2010) found higher, but comparable, TTC detection rates (30%, compared to 18.4% ± 4.6% for this study) for HPBs as part of a large study in Uganda. The higher rates may be due to the fact that sampling by Parker et al 2010) was undertaken in May–July, which included the end of the long rainfall season in Uganda, rather than between June–August (the driest part of the year), which was the case in this study. However, it is also possible that the differences in sampling design account for the differences in rates of faecal indicators detected in HPBs in Uganda.
No significant relationship between TTC and/or inorganic health based water quality in HPBs and the length of dry season (range 0–6 months) was found in this study (figure 4). However, the highest TTCs were found for locations with highest total annual rainfall (figure 4(f)). The HPBs in this study typically draw water from <20 mbgl, and the relatively high (i.e. >30 years) mean residence times of HPBs (Lapworth et al 2013) in Africa and the degree of protection provided by HPBs to surface contamination are such that microbiological contamination levels are expected to be low compared to alternative groundwater sources. However, given that highest TTCs were observed in locations with highest total annual rainfall suggests that there may be a higher risk of contamination from TTCs under wetter conditions at selected sites, combined with the presence of a proximal source of contamination such as a pit latrine, or a faulty borehole sanitary seal (e.g. Back et al 2018). The reasons for this are uncertain, but could be linked to more intense rainfall and/or flooding under wetter conditions (Bridgman et al 1995, Wu et al 2016) and the activation of rapid recharge pathways and/or shallower groundwater tables under wetter climate conditions (Gotkowitz et al 2016, Cuthbert et al 2019). It has been previously suggested that under wetter climatic conditions, microbiological contamination may be higher (Gotkowitz et al 2016), and with higher contamination during the wet season (e.g. Sorensen et al 2015a, 2015b). However, the effects are highly uncertain (Macdonald et al 2009). While this study provides evidence to support the proposition that there may be a link between wetter climate and microbiological contamination in HPBs, further studies are required to better understand this relationship.
Sites with low TDS have the most TTC contamination (figure 5). This supports the hypothesis that higher TTC contamination is related to sites with a higher proportion of rapid modern recharge, and hence lower TDS due to more limited water-rock interaction. This finding was consistent across all three countries, which adds weight to the notion that this TTC contamination relates to rapid recharge pathways. In more arid regions it is also possible that evaporative enrichment during recharge, contributes to higher dissolved constituents and TDS in the unsaturated zone (Scanlon et al 2006, Green et al 2011, Gurdak et al 2012, Kløve et al 2014). The locations included in this study were not particularly arid, so this association between climate and TDS was not observed (figure 4). Equally, land use in the rural study areas was rain fed agriculture, where groundwater recharge is likely to be dominated by diffuse processes (Lapworth et al 2013). Therefore, the effects of evaporative enrichment from irrigation return flows would be limited (Foster et al 2018). Improved construction and maintenance of water points is critical but can be very challenging to monitor and undertake in this region, despite the more obvious benefits to HPB functionality to help reduce TTC contamination within HPBs.
No exceedances in health-based water quality were observed to be strongly associated with a particular aquifer type. Low level exceedances for TTCs, F, NO3, Mn and TDS were found for all the major aquifer types including those classed as basement, igneous and sedimentary (figure 4). HPBs in consolidated sediments and fractured igneous aquifers had no F concentrations exceeding the WHO of 1.5 mg l−1. However, a small number of exceedances were found in basement, porous igneous and unconsolidated sedimentary aquifers. In this study the higher median TDS values observed in unconsolidated sediments were largely accounted for by sites in the Lower Shire Valley in southern Malawi (see figure S2), which are likely linked to low hydraulic gradients and therefore higher residence times allowing mineral dissolution as well as evaporative enrichment in groundwater due to the combination of shallow groundwater tables and high surface temperatures (Bath 1980, Monjerezi et al 2011, Rivett et al 2019). Similarly, elevated TDS groundwaters have been reported in Namibia due to mineral dissolution processes (Li et al 2018).
A limitation of this study is the fact that uranium, a potential contaminant of concern (Brugge and Oldmixon 2005) was not quantified. Naturally high uranium concentrations have been found in both basement and sedimentary settings globally (e.g. Hess et al 1985, Smedley et al 2006, Lapworth et al 2017b, Coyte et al 2018). Several studies in Africa have found naturally occurring high uranium concentrations (Vogel et al 1999, Silliman et al 2007, van Wyk and Coetzee 2008), and further work on the distribution of U in groundwater in Africa is required.
5. Conclusions and future perspectives
This study provides an assessment of the baseline drinking water quality from rural HPBs in Sub-Saharan Africa across a range of different climates and aquifer geology. The results from this study across three countries in Africa show that the majority of drinking water from rural HPBs is found to be of good quality, based on health-based criteria, and certainly better quality than most alternative sources available in rural Africa which confirms earlier smaller scale assessments (Parker et al 2010, Pritchard et al 2016, Macdonald et al 2019). There are no strong links between either dry season length, aquifer geology and water quality based on an assessment of results using 14 parameters with health-based drinking water criteria. Significantly, faecal contamination, assessed using TTC indicators, was found to be the greater barrier to achieving good quality drinking water status under SDG 6 compared to inorganic chemical criteria, and affected 21% of HPBs surveyed overall, with considerable variability between countries (13%–24%). The highest TTC counts were found at sites with the highest total annual rainfall, supporting the idea that there may be a link between climate and increased contamination from faecal sources even in improved sources such as HPBs. High TTCs in low TDS waters also suggest that more attention should be given to the quality of HPB construction, and local land-use, to reduce contamination through rapid transit routes to the aquifer and the production zone of the HPB. The only inorganic health based water quality parameters found to exceed WHO guideline values were manganese, fluoride, and nitrate. The significantly higher number of excedances in Uganda (13.8% ± 5.2%), all used for drinking water supply, with Mn > 400 μg l−1, and the mean Mn concentration of 150 μg l−1, challenges the current proposition that water >100 μg l−1 is not used for drinking water due to aesthetic constraints, and highlights the need for a health-based formal guideline value for Mn. This study, carried out in 3 countries in Sub-Saharan Africa, shows that water quality challenges for meeting SDG 6 drinking water targets using rural HPBs do occur, but are constrained to a minority of sites and could be further reduced by better HPB construction and maintenance. In most cases HPBs are a source of drinking water of good status during the dry season, when there are limited options for alternative sources. Further work is needed to extend this type of assessment in terms of geographical coverage as well assessing other water quality parameters not included in this study (e.g. uranium). Although considerable effort is required to plan randomised studies effectively, given the significant cost of undertaking an assessment of equivalent scale, using a randomised approach will generate a more robust evidence base with which to assess drinking water quality status in HPBs in Africa.
Acknowledgments
This work is part of the Hidden Crisis project within the UPGro research programme, grant number NE/M008606/1, and is co-funded by Natural Environment Research Council (NERC), UK Department for International Development (DFID), and the Economic and Social Research Council (ESRC). DJL was also funded in part by HyCRISTAL (NE/M020452/1). BGS authors published with the permission of the Executive Director of the British Geological Survey (BGS-UKRI). Significant thanks go to the WaterAid Country programme staff within each of the three countries who were instrumental to facilitating the survey and ensuring sensitive mobilisation of communities: Gossa Wolde and Gashaye Chekol (WaterAid Ethiopia); Gloria Berochan and Jacinta Nekesa (WaterAid Uganda); and Sella Jumbo and Lughano Mogha (WaterAid Malawi). Thanks also go to the social science field researchers within each country who assisted with the survey work: Yehualaseshet Tadesse (Ethiopia), Katusiime Felece (Uganda).
The data that support the findings of this study will be openly available at DOI 10.5285/bca0d930-a10d-4ae8-9afc-ad1bf73de35a (UPGro 2022, Hidden Crisis Project, Survey 1 dataset: detailed functionality assessments of hand pump boreholes in Ethiopia, Uganda and Malawi) following a delay of 24 months from the date of publication.