

Abstract
Western United States snowpacks are generated by cold-season storms, yet the vast majority of snow trend studies utilize undifferentiated air temperature records. Previous studies do not distinguish between days with and without precipitation, which effectively dilutes temperature trends relevant for snowpack monitoring. We examined trends in cold-season precipitation and impacts on snow in nine mountain regions across the western United States. Using 33 years of daily meteorological data (1984–2016) from 567 Snow Telemetry (SNOTEL) sites and a homogenized daily temperature dataset (TopoWx), we investigated seasonal and regional trends in storm day temperatures, storm day frequency, and resulting snowpack fate. We found widespread warming of 0.4 °C–1.2 °C per decade, especially during the fall and in the Interior West using tests for statistically significant trends. Disaggregation showed that days with precipitation are warming nearly twice as fast as dry days in the fall and winter. We also observed increases in November dry days, increased melt on dry days throughout the accumulation season, spring cooling and declines in daily snowmelt during snow-depleting storm days. These findings demonstrate the importance of disaggregating temperature data to elucidate trends (in storm day frequency, accumulation and melt, and warming and cooling) and their impacts on snow in the western US.
Export citation and abstract BibTeX RIS

Original content from this work may be used under the terms of the Creative Commons Attribution 4.0 licence. Any further distribution of this work must maintain attribution to the author(s) and the title of the work, journal citation and DOI.
1. Introduction
Most snow that accumulates in mountainous watersheds across the western United States is generated by cold-season storms, but with strong evidence of warming temperatures and projections of increasing temperatures (Gergel et al 2017, Rhoades et al 2018), this seasonal snowpack is at risk for continued decline (Nolin and Daly 2006, Mote et al 2018). Warming projections of the western United States by Rupp et al (2017) indicate that by the end of the mid-21st century (a future period from 2030–2059), mean winter temperatures may increase 1.7 °C from a 1985–2014 baseline period under Representative Concentration Pathway 4.5. Under this emissions stabilization scenario, winter warming may affect precipitation regimes by intensifying extreme precipitation and shifting precipitation phase while contributing to declines in snow water equivalent (SWE) and accelerating snowmelt (Barnett et al 2005, Regonda et al 2005, Knowles et al 2006, Pavelsky et al 2012).
Previous work has suggested that the snowpacks most vulnerable to warming are located in mountain regions with a maritime snow climate where winter temperatures are already close to the melting point (Sturm et al 1995, Regonda et al 2005, Nolin and Daly 2006, Stewart 2009, Luce et al 2014, Safeeq et al 2015). The impacts of such warming winters are widespread and are already affecting hydrology and water resources (Dettinger and Cayan 1995, McCabe and Clark 2005, Luce et al 2013, Berghuijs et al 2014), ecosystems and phenology (Jones 1999, Steltzer et al 2009) and winter recreation and tourism (Burakowski and Magnusson 2012). These impacts make long-term snow and climate data especially valuable for understanding regional patterns and trends. In this work, temperature, precipitation, and SWE data are collected by the Natural Resource Conservation Service's Snow Telemetry (SNOTEL) network, an important monitoring resource for managers (Kapnick and Hall 2012).
Observed temperature trends across the western United States in the last 30–40 years show warming at the rate of approximately 0.5 °C/decade (Harpold et al 2012, Kapnick and Hall 2012, Harpold and Brooks 2018). However, similar to most snowpack studies that involve temperature, these studies do not disaggregate days with precipitation ('wet days') from days without precipitation ('dry days')—leading to potential muting of temperature trends relevant to snowfall accumulation and snowpack monitoring. Studies that have discriminated between wet and dry days have primarily used Cooperative Observer Program data (Knowles et al 2006, Knowles 2015)—'direct visual observations' (Harpold et al 2017) that suffer from observer-based inhomogeneities (Kunkel et al 2007) and are challenged by uncertainty in precipitation phase partitioning (Fassnacht and Records 2015).
Time series analyses of snow and climate have examined trends in SWE on 1 April, which is considered to be the time of maximum SWE. These studies show widespread declines in April 1 SWE (Serreze et al 1999, Hamlet 2005, Regonda et al 2005, Trujillo and Molotch 2014, Mote et al 2018), especially in the maritime snowpack of the Cascades (Mote et al 2005). Our work deviates from these studies by investigating trends in cold-season storm day frequency, temperature trends in storm days and dry days, and snowpack fate by daily snow accumulation and melt. A cold-season precipitation event may be cold enough to increase SWE through snow accumulation, or conversely, it may not be cold enough to produce snow and the warmer rain and accompanying energy balance impacts may lead to snowmelt. On days without precipitation, a snowpack may or may not undergo melt, depending on energy balance.
In this paper, we focus on spatially varying trends of temperature as related to snowpack fate (i.e. daily snow accumulation or melt) for days with and without precipitation. Specifically, we seek to answer the following questions:
- 1.How do station-based temperature trends vary by mountain region and time of year when disaggregated by snowpack fate?
- 2.How do station-based snow accumulation and ablation trends vary by region and time of year?
- 3.How do these disaggregated trends compare with previous work using aggregated temperature records?
2. Methods and data
2.1. Snow telemetry network and study area
This study used long-term daily precipitation and SWE data derived from the Natural Resources Conservation Service's Snow Telemetry Network (SNOTEL). SNOTEL stations are sited in mountainous watersheds in support of the Snow Survey and Water Supply Forecasting Program (https://wcc.nrcs.usda.gov/snotel/). Standard sites record air temperature with a shielded thermistor, precipitation with a storage-type gage, SWE with a snow pillow and pressure transducer, and snow depth with a sonic sensor. We chose to use only SNOTEL snow pillow data rather than SNOTEL snow depth data because the latter are affected by noisy and error-prone ultrasonic sensor data.
Sites were aggregated into nine different regions based on the SNOTEL regionalization of Serreze et al (1999). Figure 1 indicates the locations of individual SNOTEL sites used in this study, the nine regions, and the number of sites within each region.
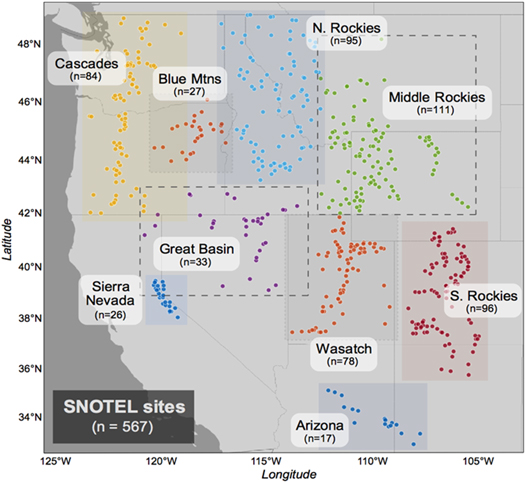
Figure 1. SNOTEL sites by physiographic region in the western United States. Sites with a minimum of 20 years of data coverage from WY 1984 to WY 2016 are displayed. Physiographic regions were adapted from Serreze et al (1999).
Download figure:
Standard image High-resolution imageAll existing SNOTEL sites within the contiguous United States that have been in operation for a minimum of 20 water years (WY) prior to the end of the study period (WY 2016) were used in this analysis (n = 567). The majority of SNOTEL records (>460 sites) possess records at the beginning of the study period in WY 1984. This year was chosen to curtail biasing trend analyses with the 'anomalously wet' years of the early 1980s that saw 'record or near record snowfall' in much of the study area (Harpold et al 2012). Trend analyses are especially sensitive to choice of starting year (Abatzoglou et al 2014), and shifting this analysis to start at a more representative year was a decision to moderate potentially spurious trends.
2.2. Topography weather (TopoWx)
Due to systemic artifacts within the SNOTEL temperature data that produced artificial warm-biased trends, temperature records were sourced from the Topography Weather (TopoWx) dataset. TopoWx is an 800 m resolution gridded dataset of daily minimum and maximum air temperatures for the contiguous United States (Oyler et al 2015).
Oyler et al (2014) compared annual temperature trends from SNOTEL air temperature records with trends from the homogenized US Historical Climatology Network Stations (USHCN), correcting SNOTEL inhomogeneities using a pair-wise homogenization algorithm as described in Menne and Williams (2009).
Unlike topoclimatic datasets such as PRISM (Parameter-elevation Relationships on Independent Slopes Model) and Daymet, TopoWx's homogenization accounts for non-climatic station variability (i.e. changes in station instrumentation, siting, and observation times), improving upon both complex spatial and temporal temperature trend representation. And as the other two gridded datasets remain subject to biases from the raw SNOTEL minimum temperature (Tmin) records, TopoWx was the best choice for this work's multi-decadal, station-based time-series analyses (Oyler et al 2015).
Daily average temperatures were computed as the mean of daily minimum and daily maximum temperatures. Daily values of minimum, average and maximum temperatures for each SNOTEL site were extracted using the nearest grid cell, identified by site coordinates.
2.3. Fate identification and metrics
Daily changes in precipitation and SWE values were used to identify snowpack fate. Days with measurable precipitation (>0 mm) were designated 'wet days' while days without precipitation were designated 'dry days.' Of these two types of days, fates were assigned as shown in table 1. Due to the SNOTEL snow pillow resolution limit of 0.1 inch (2.54 mm), we chose to double this value to 5.1 mm for use as a change detection threshold for accumulation and ablation.
Table 1. Fate classification by daily changes in precipitation accumulation and snow water equivalent.
| Fate | Daily change in precipitation accumulation | Daily change in SWE | |
|---|---|---|---|
| Wet (Storm) | Gaining | > 5.1 mm | |
| Neutral | > 0 mm | –5.1 mm ≤ x ≤ 5.1 mm | |
| Losing | < –5.1 mm | ||
| Dry | Melt | > 5.1 mm | |
| Neutral melt | 0 mm | 0 mm < x ≤ 5.1 mm | |
| No melt | 0 mm | ||
For the sake of expedience and from a hydrological standpoint, the term 'storm days' is used interchangeably with 'wet days' in this work. This differs from the more colloquial description of storms—characterized by strong winds and heavy precipitation. We acknowledge that this analysis did not investigate wind velocities, and did not focus on differentiating wet days by precipitation intensity as in Hu and Nolin (2019).
The following metrics were used to characterize fate days:
- 1.Number: the total number of fate days in a specified time period; measured in days.
- 2.Daily Change in SWE (∆SWE): the net positive (accumulation) or negative (melt) change in SWE over a 24 h period; measured in mm SWE/day.
- 3.Daily Minimum Temperature (Tmin): a fate day's minimum temperature; measured in °C.
- 4.Daily Average Temperature (Tavg): a fate day's average temperature; measured in °C.
- 5.Daily Maximum Temperature (Tmax): a fate day's maximum temperature; measured in °C.
2.4. Trend analysis
Each of the fate metrics was analyzed using the Mann-Kendall trend test for monthly, seasonal (fall—SON, winter—DJF, spring—MAM, accumulation—NDJFM), and annual water year (1 October–30 September) time periods from 1 October, 1984 to 30 September, 2016. This trend test was chosen over linear regression as data are not held to any particular distribution (Helsel and Hirsch 2002).
Magnitudes of statistically significant trends were derived from Sen's slope and presented in units per decade (i.e. number—days/decade, SWE impacts—mm SWE/day/decade, temperature—°C/decade). Trend magnitudes were computed as the average of all statistically significant trends and are accompanied by the standard deviation of significant trends. Non-statistically significant trends are depicted as 'no trend' in all figures. More information regarding significant and non-significant trends can be found in the supplementary section (figure S1, available online at stacks.iop.org/ERL/15/034059/mmedia).
3. Results
3.1. Fate day number and daily changes in SWE
West-wide, there are uniformly more dry days in November, averaging 1.9 days more per decade (114 out of 567 sites). This drying trend is primarily concentrated in the Cascades, the Blue Mountains (37% of sites within the region), the Middle (21%) and Southern Rockies (20%) and Wasatch (42%) regions (see figure 2(a)). November drying occurred across all elevation classes, with slightly more prevalence at higher elevation sites. Trends in fewer November SWE-gaining days (77 out of 567 sites, averaging 1.2 fewer days/decade) are concentrated in the Cascades (18%, 1.6 fewer days/decade) and the Middle and Southern Rockies (14%, 21%, ≈1 fewer day/decade).

Figure 2. (a)–(b) Number of November dry days (left) and accumulation season dry day melt (right) from WY 1984–2016. Red circles indicate sites with significant negative trends, blue circles indicate sites with significant positive trends, and white circles indicate sites without statistically significant trends.
Download figure:
Standard image High-resolution imageOn dry days throughout the accumulation season (NDJFM, ≈50% of sites, see figure 2(b)), seasonally (SON ≈24%, DJF ≈46%) and for each month of the accumulation season (monthly from November through March, see supplementary figure S1) across all elevation classes, we observe significant and West-wide trends of increased melt. The greatest average magnitudes of melt increase and melt variability (in terms of standard deviation, std) occurred in March, averaging −0.4 mm SWE/decade (std = 0.5 mm SWE/decade). Average melt magnitude was consistent with values ranging from −0.1 mm to −0.2 mm SWE/decade (std = 0.1 to 0.2 mm SWE/decade). The Northern and Middle Rockies, and Wasatch regions consistently possess the highest proportion of sites with increased melt.
3.2. Fate day temperature
Widespread warming was prevalent on monthly, seasonal, and annual timescales (see figures 3(a)–(d) and supplementary figure S1) and across all elevation classes. The greatest extent and magnitude of warming occurred during fall wet days, with 64% of sites warming an average of 0.9 °C/decade in daily minimum temperature (std = 0.3 °C/decade, see figure 3(a)). Warming trends were also observed for daily maximum temperatures on fall wet days with 69% of sites warming by an average of 1.2 °C/decade (std = 0.3 °C/decade, see figure 3(c)).
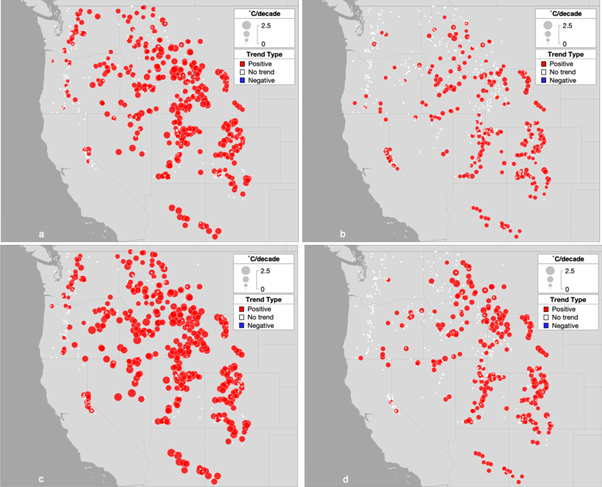
Figure 3. (a)–(d) Minimum (top) and maximum (bottom) daily temperature trends for wet (left) and dry (right) days in the fall from WY 1984–2016. Red circles indicate sites with significant warming trends and white circles indicate sites without statistically significant temperature trends. There were no statistically significant cooling trends in this time period.
Download figure:
Standard image High-resolution imageRegionally, warming trends in daily minimum temperature were most pronounced in the intermountain and continental regions (≥2/3 sites in all regions outside of coastal areas), with more limited warming along the coast (Cascades 37% of sites, 0.6 °C/decade; Sierra Nevada 19% of sites, 0.7 °C/decade). Similarly, warming trends in fall wet day daily maximum temperatures were widespread in the Interior West (≥70% of sites), but also included substantial warming along the coast (>1/3 of sites).
Temperature trends for dry days also reached their greatest extent and magnitude in the fall. Warming at 46% of sites averaged 0.5 °C/decade (std = 0.1 °C/decade) in daily minimum temperature (see figure 3(b)). Warming at 45% of sites averaged 0.7 °C/decade (std = 0.2 °C/decade) in daily maximum temperature (see figure 3(d)). Prevalent warming (35%–96% sites for both Tmin, Tmax) occurred in all regions outside of the Cascades, Blue Mountains and California Sierra Nevada.
Winter temperature trends were more limited in spatial extent and magnitude than fall temperature trends. Warming in winter wet days occurred at 25% of sites, averaging 0.9 °C/decade in daily minimum temperature (std = 0.4 °C/decade). Winter wet day warming in daily maximum temperature occurred at 36% of sites, averaging 0.7 °C/decade (std = 0.3 °C/decade). As in the fall, fewer sites in the Cascades and Sierra Nevada had warming trends when compared to interior regions. The Middle Rockies warmed the most (spatially and by magnitude), averaging 1.1 °C/decade at 40% of sites for daily minimum temperature, and 0.9 °C/decade at 62% of sites for daily maximum temperature.
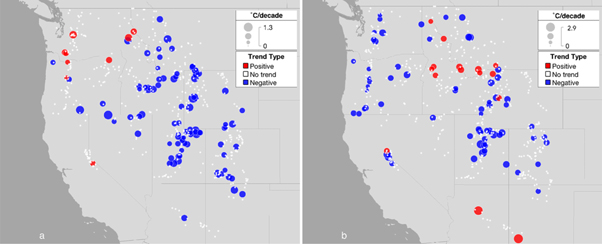
Limited springtime temperature trends existed primarily on melt days (see figure 4(a)) in the intermountain and continental regions and on losing days along the coast (Cascades, Blue Mountains, Sierra Nevada) and in the Wasatch region (see figure 4(b)). Cooling on spring melt days averaged 0.5 °C/decade in daily minimum temperature at 88 sites (std = 0.4 °C/decade) and cooling on spring SWE-losing days averaged 0.8 °C/decade at 68 sites (std = 1.1 °C/decade) in daily maximum temperature. Though approximately 10% of sites showed warming trends on SWE-gaining days during the spring (0.8 °C/decade, std = 0.4 °C/decade), there were no widespread warming trends in the spring for any of the nine regions or for any snowpack fate.
Figure 4. (a)–(b) Minimum (left) and maximum (right) daily temperature trends for melt and losing days, respectively, in the spring from WY 1984–2016. Red circles indicate sites with significant warming trends, blue circles are significant cooling trends, and white circles indicate sites without statistically significant trends.
Download figure:
Standard image High-resolution image
4. Discussion
Warming trends across the western US in the last half-century have been identified by numerous studies using a variety of datasets and methodologies (Mote et al 2005, Knowles et al 2006, Feng and Hu 2007, Kapnick and Hall 2012, Knowles 2015, Mote et al 2018). Our analysis broadly reaffirms many of these findings and documents extensive warming trends across the western United States from WY 1984–WY 2016. To our knowledge, there has not been a comparative analysis disaggregating trends in snowpack metrics by fate (e.g. wet day versus dry day, SWE-gaining day versus SWE-losing day). This fate-based perspective reveals and highlights trends that are otherwise muted or even entirely obscured in trend analyses using aggregated data.
Widespread temperature trends in snowpack can be described by differential warming by season, region and fate. These categories break down most readily into pairings: fall versus spring, coast versus interior, and dry days versus wet days, but when re-combined, can produce a myriad of more nuanced stories. In all regions studied, both dry days and wet days at SNOTEL sites have significantly warmed. More than half of all sites have observed annual dry day warming and more than 28% of all sites have observed annual wet day warming. But by far, the greatest extent and magnitude of warming has taken place during the fall, with wet days (68% of all sites, 1.0 °C/decade for Tavg) far outpacing dry days (48% of all sites, 0.6 °C/decade for Tavg). The fall season also shows a significant decrease in the number of storm days.
Declining snowpack due to precipitation phase conversion, snow-to-rain, is of greatest concern for regions with relatively warm SWE-gaining days. Even without this loss of snow accumulation due to phase conversion, warmer fall temperatures can change the composition of snowpack by potentially increasing the number of melt events (Mote et al 2005) and through snow densification (Colbeck 1987). Though some of these melt events may not register above the change thresholds denoting SWE-gaining or SWE-losing days, they still have implications for snowpack structure. Refrozen early-season melt layers can be buried by later season accumulation, resulting in weak or icy layers within the snowpack.
Fundamentally, snowpack retention or melt is a matter of energy balance. Higher temperatures increase incoming longwave radiation and sensible heat flux into the snowpack. This contributes to a reduction in cold content and decreases the time to the onset of melt. Pre-existing weak layers, rapid warming and rain-on-snow events, and warmer snowpacks in temperature-sensitive, geologically-predisposed mountains may contribute to destructive avalanches (Huggel et al 2010, Pielmeier et al 2013, Heffernan 2018).
Regions in the Interior West have warmed faster than regions along the Pacific Coast. This can be explained in part by elevation differences—SNOTEL sites located in the Interior West are generally much higher in elevation (mean elevation = 2046 m ∣ 6752 ft) compared to coastal regions (mean elevation = 1583 m ∣ 5224 ft). Amplified warming at higher elevations has been postulated as a matter of increased downwards longwave radiation resulting from decreases in snow cover and albedo (Rangwala et al 2013). Colder temperatures and lower humidity levels are typical of higher elevations and locations with greater continentality, so despite more rapid warming in the Interior West, Pacific coastal snowpacks with mild temperatures remain more vulnerable to potential phase conversion and snowpack melt (Trujillo and Molotch 2014, see supplementary figure S3).
Warming magnitudes for dry days and all days approximate previous findings by Harpold et al (2012). However, we found average fall and winter wet day warming rates are nearly double (0.8 °C–1.2 °C/decade) the rates of dry days and all days. Though the last few decades of the 20th century do show more intensive warming and snow reduction trends (Knowles 2015), wet day warming trends suggest that fate aggregation obscures the amount of warming.
Springtime trends contradict previous studies' findings. Though some springtime cooling trends have been noted (Kapnick and Hall 2012), the focus on spring temperature trends has primarily been on warming accumulation days (Knowles et al 2006). Musselman et al (2017) hypothesis of slower melt from decreased insolation (due to shallower snowpacks and earlier melt onset) could explain the observed trends of less melt and cooling temperatures on melt and losing days. As snowmelt is more likely to be sensitive to spring temperatures (Knowles et al 2006), spring cooling could also affect melt rates by reducing energy fluxes into the snowpack, and delaying ripening and subsequent melt.
Finally, though there were other statistically significant monthly trends (supplementary figure S1), no other monthly trends were as widespread as increases in November dry days. November drying and declines in snowpack-building days (gaining days) were observed at nearly 20% of SNOTEL sites. Combined with extensive fall warming trends and increases in December wet day accumulation, these findings support previous work documenting shorter snow seasons (Harpold et al 2012), shifting seasonality of precipitation (Regonda et al 2005), and delays in the start of the accumulation season (Knowles 2015).
A shorter snow season, warmer temperatures and less snow creates climatological challenges for the multibillion dollar winter recreation industry (Burakowski and Magnusson 2012). Beyond the impacts on winter recreation and tourism, fall drying and warming also contributes to lengthening and intensifying the fire season (Schroeder and Buck 1970). Wildfire costs the United States billions of dollars a year in fire suppression and economic losses (Doerr and Santín 2016).
While we have observed extensive warming and anticipate continued warming, energy fluxes, and topographic and physiographic characteristics make snowpack response to increased temperatures highly variable (Lundquist and Flint 2006, Harpold et al 2012). Trends focused on precipitation (i.e. the number of storm days, amount of snow accumulation) should be interpreted with the acknowledgement that precipitation totals and storm days themselves are highly variable in climate projections (Clow 2010, Rupp and Li 2017). The emphasis of this study is therefore on temperatures, which are in greater agreement across modeled climate projections. In terms of time-series analyses, it is important to restate that choice of start year can dramatically alter resulting trends (Abatzoglou et al 2014, Mote et al 2018) and that the 33 years covered in this work may not capture interdecadal variation occurring on longer timescales (Knowles 2015). Interpreting these trends in the context of interdecadal variability with respect to known climate patterns (e.g. Pacific North American pattern, El Niño/Southern Oscillation) is important for understanding longer term patterns of snowpack response and persistence.
5. Conclusions
Our findings indicate that distinguishing between dry and wet days reveals significant warming trends previously obscured by aggregating air temperature records for all days. Widespread cold-season warming took place at varying rates depending on region, season and fate, but the greatest and most extensive warming occurred on days with precipitation during the fall. These days warmed at twice the rate of dry days. Drying trends were also strongest in the month of November, with the greatest prevalence in the Wasatch region. Fall warming and drying have the potential to shorten the snow accumulation season, while simultaneously contributing to conditions that may lengthen the fire season and increase its severity. Overall warming trends in cold-season wet days can reduce snow storage and impact water management, power generation, and the winter recreation industry. Monitoring changes in cold-season temperature and precipitation (phase, seasonal timing, and frequency) is crucial for seasonal snow forecasting, resource management, and climate adaptation.
Acknowledgments, samples, and data
We would like to acknowledge the two anonymous reviewers of this manuscript, whose attentive and thoughtful comments substantially improved the clarity and readability of this work. This research was supported by the National Aeronautics and Space Administration under grant #NNX16AG35G. No conflicts of interest, real or perceived, financial or by affiliation, exist for any author. The data that support the findings of this study are openly available at https://ir.library.oregonstate.edu/concern/datasets/bc386q457. The TopoWx (Topography Weather) data can be obtained from http://scrimhub.org/resources/topowx/.