

Abstract
Large-scale agricultural expansion can influence near-surface climate by altering surface energy fluxes, water, and albedo. It is less clear whether such effects extend through the full troposphere and how such effects vary in time. Here we use a novel dataset documenting the massive land use and land cover change due to agricultural expansion in Northeast China from 1982 to 2010 to assess how such expansion has influenced climate over the full troposphere. Confronting our land classification and climate data with a number of statistical approaches (linear regression, correlation analysis, Granger-causality), we find that cropland significantly increased by ∼28% over the near 30 year period in Northeast China-an average rate of nearly a percentage per year. This massive 30 year agricultural expansion is tightly associated with near-surface cooling identified in station data during the late growing season (August to September). Assuming no cropland expansion over the 30 year period, surface temperature would have increased by 0.93 °C ± 0.4 °C. Furthermore, the fingerprint of cropland-associated cooling extends upward into the atmospheric column, influencing the vertical structure of the regional troposphere and potentially its circulation. For every 10 percentage points increase in cropland fraction over Northeast China, regional full-troposphere temperature and geopotential height significantly decrease by 0.2 °C–0.6 °C and 20 m–80 m, respectively. These observed relationships are remarkably coherent across datasets, methodological choices, atmospheric levels, and theory, suggesting that the observational effects we identify are robust and imply the possibility of detectable land use change effects on regional circulation, with potential consequences for the East Asian monsoon.
Export citation and abstract BibTeX RIS

Original content from this work may be used under the terms of the Creative Commons Attribution 3.0 licence. Any further distribution of this work must maintain attribution to the author(s) and the title of the work, journal citation and DOI.
1. Introduction
With vast fields of rice, corn, and soybean, Northeast China is a crucial agricultural region (Ye and Fang 2009), accounting for ∼20% of the country's total grain production (Yang et al 2014). Northeast China has suffered crippling growing season droughts recently, creating widespread agricultural impacts (Yi 2014). These droughts are recent manifestations of a much longer four-decade decrease in summer and autumn rainfall in the region (Piao et al 2010, Ye 2014, Wang et al 2015). In 2014, for example, a drought in Liaoning Province in Northeast China affected 1.8 million hectares of cropland (Yi 2014), leading to an 1.5% drop in country-wide corn production (Larson 2014). Yield and production declines in the face of growing demand have led to the widespread adoption of irrigation (Yin et al 2016, Chen et al 2018). Irrigated areas in the Northeast Chinese province of Jilin, for example, expanded some 24 times in one ten year period alone (from 27 000 ha in 1995 to 667 000 ha in 2005) (Li et al 2005). Such a massive expansion and intensification of agricultural practices in a confined geographic region has likely affected seasonal heat and moisture fluxes at the land surface with possible effects on regional climate conditions in China.
There is considerable evidence from both models and observations in other geographic contexts that cropland expansion (as well as intensification of irrigation and fertilization) can significantly impact climatological temperature, moisture, and circulation through biogeophysical and biogeochemical processes at the land-atmosphere interface (Mahmood et al 2006, Lobell et al 2008, Cook et al 2011, Lee et al 2011, Wei et al 2013, Zhao et al 2016). Intensified agriculture, for example, could serve to reduce surface air temperature by increasing energy partitioning towards latent, rather than sensible, heat (Han and Yang 2013, Zhang et al 2013). Modeling work with idealized regional land-atmosphere simulations of the US High Plains, showed that irrigation induced a 15% decrease in sensible heat flux and 36% increase in latent heat flux, causing a 1.2 °C decrease in the near surface temperature (Adegoke et al 2003). There is further evidence from model simulations suggesting that temperature response to irrigation can modify circulation and, by extension, precipitation (Douglas et al 2009), decreasing rainfall in the monsoonal regions like India due to a weaker inland temperature gradient (Puma and Cook 2010). Such agriculturally-driven cooling in the East Asian context could produce a similar effect, reducing the land-ocean heat contrast, thereby decreasing monsoon rainfall (Lee et al 2009) and thus the water available to transpire in rainfed fields.
In China, there is substantial observational evidence for recent agricultural activities having an influence on regional-scale climate. For example, Zhang et al (2013) showed that the wetting effects in changes of cropland greenness accounted for some 48% of the spatial variance of changes in springtime daily minimum specific humidity in the North China Plain. The climatology of China's daily and seasonal temperatures have been affected as well: in Xinjiang province in Northwest China, the warming trend in growing season daily average surface temperature among those stations adjacent to cultivation was smaller than those stations with little cultivated land nearby (Han and Yang 2013). In parts of Northeast China, a similar response has been documented, with the cooling effects of expanding irrigation (Kang and Eltahir 2019) being sufficiently large to dampen or fully-offset the warming signal from greenhouse gas emissions (Zhu et al 2012, Zhao et al 2016).
While much of this work has documented the influences of Chinese (or other regions') agricultural expansion on surface climate, it remains an open question whether such influences extend throughout the troposphere, and thus whether they influence larger-scale circulation. An additional limitation in these studies of Chinese agricultural and climate in particular is their reliance on static agricultural data (e.g. Zhu et al 2012, Han and Yang 2013, Zhang et al 2013) rather than multi-temporal data, which is required to detect both year-to-year and long-term variations in cropland cover. Consequently, previous studies are unable to accurately estimate changes in regional agricultural practices, such as cropland expansion or abandonment, thereby leading to uncertainties in estimating of the climatic effects of agricultural activities, potentially over- or under-stating their effects on climate. Therefore, observational studies with more realistic cropland variations derived from more robust data (e.g. remotely-sensed imagery) over longer temporal periods are needed to better detect and attribute the climatic effects of China's agricultural expansion.
To address some of these limitations, we use the cropland cover change information from our newly-developed 29 year dataset of annual-scale land use and land cover (LULC) from 1982 to 2010 in Northeast China. The region is the largest plain in the country and is surrounded by mountains: the Daxing'anling range in the west, the Xiaoxing'anling range in the north, and the Changbai range in the east. The isolation from the surrounding ocean that these mountains provide makes Northeast China an ideal place to explore land-atmosphere interactions associated with the massive agricultural expansion we identify here. We explore the impacts of Northeast China's expanding agriculture activities on full-troposphere conditions during the late growing season (August to September, AS). We focus on the late growing season for two reasons: firstly, because crop evapotranspiration is highly active during this time, thereby affecting surface energy partitioning and thus climate (Zhao et al 2008); secondly, the East Asian monsoon is retreating during the late growing season (T'u and Hwang 1945), thus mitigating its potential to confound our diagnosis of temperature and circulation changes. We find that cropland expansion in the region is statistically associated with full-troposphere decreases in temperature and associated declines in geopotential height (GPH) anomalies. These observed climatological changes are insensitive to our methodological choices and are consistent across data sources, variables, atmospheric levels, and with our expectations from theory. Such consilience suggests a clear fingerprint for cropland expansion impacting temperature and GPH over Northeast China. At the same time however, our results underscore the importance of model simulations for ensuring that potentially confounding effects, such as internal variability, global warming, or remote forcing are isolated from the effect of cropland expansion.
2. Materials and methods
2.1. Data
Annual-scale fractional maps of cropland are used to assess cropland change in Northeast China. We generate fractional maps of cropland from a time-series of LULC maps at 1/12° resolution from 1982 to 2013 produced by He et al (2017) (figure 1(a)). Our land cover classification relies on a random forest classification (Breiman 2001) based on 19 phenological metrics derived from AVHRR Global Inventory Modeling and Mapping Studies (GIMMS) third generation Normalized Difference Vegetation Index (NDVI)(NDVI3g) data. The overall accuracy of the 2012 LULC map was 73.8% (see He et al 2017 for full accuracy and validation statistics). Validations for other years are not available in He et al (2017) due to limited reference data. To address this limitation, we pursue several other comparisons with alternative remote sensing products to assess classification accuracy in other years (see He et al 2017 for details). Here we also validate our Northeast China regional-scale time series of total annual-scale cropland with fall crop and irrigation area data reported to the National Bureau Statistic of China (NBSC). These data are available for three Northeastern provinces: Heilongjiang, Jilin, and Liaoning (figure S1 is available online at stacks.iop.org/ERL/15/034032/mmedia). Our classified cropland time series over the three provinces from 1982 to 2010 shows increasing trends consistent with NBSC data and also correlates well with NBSC estimates of fall crop plantation area (0.54, p-value <0.01) and effective irrigation area (0.72, p-value <0.01). We stress, however, that direct comparison of the magnitudes of these data is not possible, as the fall crop and irrigation areas reported to the NBSC represent a subset of the full-calendar year cropland area we assess in this study. Furthermore, we would not expect our classification of cropland to perfectly correlate with the NBSC data, as those data are a political product based on local reporting, while ours is a satellite-derived product. We assess the relationship between climate and LULC in the region over 1982–2010 to maximize temporal overlap with the available period of meteorological data, described below. We aggregated the 29 year LULC maps from 1/12° to 0.5° over 1982–2010 using a fractional method following He et al (2018).
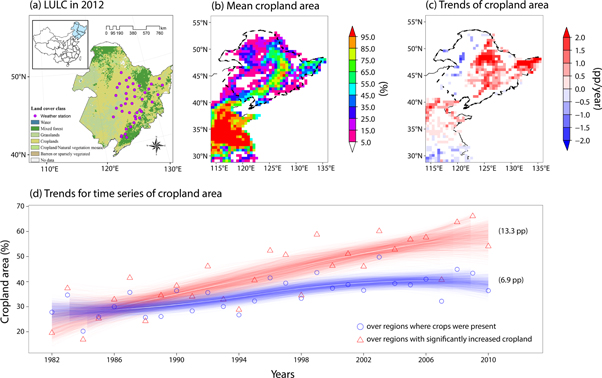
Figure 1. (a) Land use and land cover in 2012 for Northeast China, (b) mean cropland percentage averaged over the period from 1982 to 2010 (the color bar is the percentage of cropland in each 0.5° grid cell), (c) significant (p-value < 0.1) temporal trends in cropland fraction (color bar is the slope in percentage points (pp) per year) estimated from 1982 to 2010, and (d) spread in trends for time series of cropland area from 1982 to 2010 for regions with significantly increased cropland in Northeast China (red open triangles) and over all regions where crops were present (blue open circles). Fitted to each of the two series is a locally weighted (nonlinear) regression (see Methods). The shading (red for regions with significantly increased cropland and blue for regions where crops were present) represents 95% confidence interval around the median nonlinear regression estimate (white lines). The values in parentheses indicate the standard deviations (in pp) for the time series of cropland area. The black dashed polygon in (b) and (c) indicates the Northeast China study region.
Download figure:
Standard image High-resolution imageThe daily mean of surface air temperature (°C) comes from ∼120 meteorological stations in Northeast China archived by the China Meteorological Administration (CMA), which provides records from January 1954 to July 2011 (Meng et al 2014, Song et al 2019). We use these station data to calculate each year's average of the late growing season (August to September, AS) temperature. Gridded monthly latent and sensible heat fluxes for 1982–2011 are derived from FluxNet-Multi-Tree Ensemble (MTE). Fluxnet-MTE assimilates remotely-sensed, climate, and meteorological data to estimate land-atmosphere fluxes at a 0.5° resolution (Jung et al 2011). We extract the latent and sensible heat fluxes at the locations of CMA meteorological stations. Fluxnet-MTE has been evaluated globally with a number of studies (Dirmeyer et al 2006, Oki and Kanae 2006, Trenberth et al 2009, Jung et al 2010). To determine the influence of cropland change on seasonal-scale mid- and upper-level atmospheric conditions, we use temperature (°K, converted to °C) and GPH (m2 s−2, converted to meters) data at different pressure levels (27 levels from 1000 to 100 hPa) from the European Center for Medium-Range Weather Forecasts Interim Re-analysis (ERA-Interim), providing gridded (0.703°) monthly coverage from 1979 onwards (Dee et al 2011). We also use multi-level temperature and GPH data from National Center for Environmental Prediction (NCEP)-Department of Energy (DOE) Reanalysis-2 (Kanamitsu et al 2002) and National Aeronautics and Space Administration (NASA) Modern-Era Retrospective Analysis for Research and Application, Version 2 (MERRA-2) (Gelaro et al 2017) to confirm our ERA-Interim results.
2.2. Statistical methods
The observational record of cropland fractions we have developed provides 29 years of data. Because of this relatively short record of LULC, we use a number of methods to quantify the association of cropland changes with climate trends and interannual climate variability, from linear regression, to correlation analysis, to Granger-causality tests, all in an effort to assess the robustness of the associations we find to different methodological choices, each described below.
2.2.1. Characterizing cropland expansion
To quantify the magnitude of cropland expansion in Northeast China, we regress the cropland fraction derived from the land classification data (He et al 2017) on time at the grid point scale with an autocorrelation-corrected linear fit (Santer 2000). If autocorrelation is deemed an issue (significant at 5% level) for that grid point, we fit a generalized least squares regression estimated using an autoregressive moving average process of order p = 1 or p = 2, based on the data's covariance structure; otherwise we use ordinary least squares. Trend significance is tested by Student's t test.
We estimate the uncertainty in the area-average expansion of cropland by bootstrapping (1000 times) nonlinear locally-weighted regression (using the 'loess' function in R). These bootstrapped regressions are then visually-weighted using a color-saturation and contrast scheme to represent regression coefficient uncertainty (Hsiang 2013). Each regression estimate is plotted with the same degree of transparency; as more estimates overlap, a region of higher opacity emerges representing the 95% confidence interval around the median regression estimate showed as a white line (Mankin and Diffenbaugh 2015). We use the visually-weighted regression to assess area-average changes in cropland fraction over both significantly-increasing cropland regions and all regions with cropland. In this analysis, we focus on the former, as significant cropland expansion likely increases the climate signal we assess (Gedney and Valdes 2000, Pal and Ziaul 2017, Li et al 2018), though our results are insensitive to performing this analysis over all cropland (see supplementary material).
2.2.2. Testing the association of cropland trends with climate trends
We assess the influence of area-average cropland trends on tropospheric climate trends by isolating crop effects from those attributable to anthropogenic warming. To do so, we perform univariate linear regression of each of latent heat flux, sensible heat flux, and surface temperature on cropland fraction to determine the association of each of these variables with agricultural expansion. In this study, we assume secular trends in each variable from global warming can be represented by a linear fit (Thompson et al 2009, Hurley and Boos 2013), which we then remove. We assess the sensitivity of this assumption in the supplementary material. The independent variable is the area-average detrended cropland fraction at all grid points of weather stations in the regions with significantly-increased cropland. The area-average and detrended latent heat flux, sensible heat flux, and surface temperature over the same grid points are used as dependent variables in the univariate regression. We multiply the regression coefficients of cropland expansion effects on climate and 29 year cropland expansion values calculated from previous section to then estimate the counterfactual climate that would have occurred if cropland expansion had not taken place.
2.2.3. Assessing cropland expansion's association with interannual climate variability
In addition to testing the association of cropland trends with climate trends, we assess the interannual variation in temperature and energy partitioning at the surface from interannual variations in cropland expansion. We use non-parametric Spearman's rank correlation analysis on linearly-detrended cropland and climate data from the near surface to the top of the troposphere, including latent heat flux, sensible heat flux, surface air temperature, multi-level temperatures, and GPH, during the late growing season of AS. Significant correlation coefficients are tested using Student's t test.
To explicitly test the direction of associations between cropland expansion and each of surface temperature, sensible, and latent heat fluxes, we use Granger causality (Granger 1969), which is widely used in climate studies (Elsner 2007, Jiang et al 2015, He and Lee 2016). Here we uses the F-test statistic to compare the skill of two regression models, the first being the regression of detrended surface temperature on lagged values of detrended surface temperature itself (we use a lag of 1 based on the autocorrelation function of the data, see figure S2), and the second regression of detrended surface temperature on both lagged values of detrended surface temperature and detrended cropland fraction. Both surface temperature and cropland fraction are area-averaged over all grid points of weather stations in the significantly increased regions. This process is repeated for sensible heat and latent heat fluxes.
3. Results and discussion
3.1. Cropland expansion in Northeast China
Cropland and cropland mixed with both natural vegetation and grassland are the dominant land cover classes in Northeast China, as we show for 2012 (figure 1(a)). Over the Northeast China domain we analyze, cropland cover varies from less than 5% to over 85%, with the highest values (>55%) concentrated along a central corridor in the heart of the Northeast China plain, straddling the east and west banks of the Songhua River (figure 1(b)). Over the 1982–2010 period, cropland has significantly increased across vast swaths of Northeast China, with the highest values of ∼2.0 percentage points (pp) per year in the northern and eastern portions of the domain (figure 1(c)). Focusing on those grid cells with significantly increasing cropland, the area-average cropland fraction increases by around 1.3 pp per year (figure 1(d), red lines), which is an increase that is larger in magnitude than the area-average trend across all grid cells with cropland present (∼0.6 pp per year) (figure 1(d), blue lines). Such a vast and rapid expansion in cropland in the region is consistent with independent data sources (figure S1).
The interannual variability of cropland fraction we identify is large (the standard deviation is 13.3 pp for figure 1(d), red open triangles). Such variability across years could arise from a number of possibilities: First, the selection of grid points influences the cropland fraction variation. When we expand our analysis to include all grid points where crops are present, the year-to-year variation in the cropland fraction time series is reduced (the standard deviation is 6.9 pp for figure 1(d), blue open circles). The variation could also be influenced by uncertainty in our classification of cropland from the AVHRR data. Here, we assume classification errors are stationary before 2012 because of insufficient reference data to validate other years. The standard error (calculated following Olofsson et al 2014) for our cropland fraction in 2012 is 2.7 pp. This implies that incorrect classification of cropland contributes ∼20% of the total uncertainty to this year-to-year variability, if our error is stationary across years.
A third source of the high year-to-year variability of cropland fractions could come from rapid cyclical transitions between cropland and grasslands or land left fallow in this region (He et al 2018). Such transitions between crops and grassland, or cropland and fallow land should alter surface moisture and energy properties, thereby influencing climate conditions. Crops, for example, typically require more water than grass during the growing season (Brouwer and Heibloem 1986), leading to greater transpiration (and associated latent heat increases and evaporative cooling), should water not be limited (Ban-Weiss et al 2011). Coupled with the large expansion of irrigation in the region (figure S1(b)), such climate effects, particularly over regions with significantly increased cropland, should be discernible (Zhu et al 2012).
The rapid transitions between cropland and grasslands may have actually occurred in the real-world, or they may be due to misclassification between cropland and grasslands in our classification data. As such, we test the sensitivity of our estimate of year-to-year crop fraction variability to when we constrain our analysis to regions with different thresholds of transitions between crops and grasses during last 29 years. To do so, we calculate the histogram of grid point transitions between cropland and grasslands (figure S3(a)) and find that the interannual variability of cropland fraction is decreased from 13.3 pp (figure 1(d), red open triangles) for cropland area with all transitions to 12.0 pp when we limit our analysis to those grid points with fewer than 15 transitions. This variability is further reduced to 8.8 pp for those grid points with fewer than 10 transitions, and 3.8 pp for fewer than 5 transitions (figure S3(e)). Nonetheless, our general results—the increasing cropland trend (figures S3(b)–(e)) and its association with full tropospheric cooling (figures S15 and S16, discussed in section 3.3)—are insensitive to potential misclassifications among crops and grass and the magnitude of interannual variability in crops.
3.2. Impacts of cropland expansion on near-surface climate in Northeast China
The spatial patterns of temperature and sensible and latent heat across the 41 weather stations collocated with significantly increasing cropland show a remarkable consistency in the resurface response (figures 2(a)–(c)). Spearman's rank correlations show that detrended interannual variations in cropland fractions are directly related to latent heat flux and inversely related to sensible heat and surface temperature, each consistent with expectation: increased transpiration cools the near surface in the late growing season. Furthermore, because these correlations are based on the interannual variability in cropland fractions shown in figure 1(d), these results lend confidence to the direction (if not the magnitude) of year-to-year crop variations in the region. A Granger-causality test confirms that cropland fraction does Granger cause surface cooling temperature (p-value = 0.094, table S1, Test 1), although Granger-causality tests for sensible and latent heat fluxes are not significant at the 10% level (table S1, Tests 2 and 3).
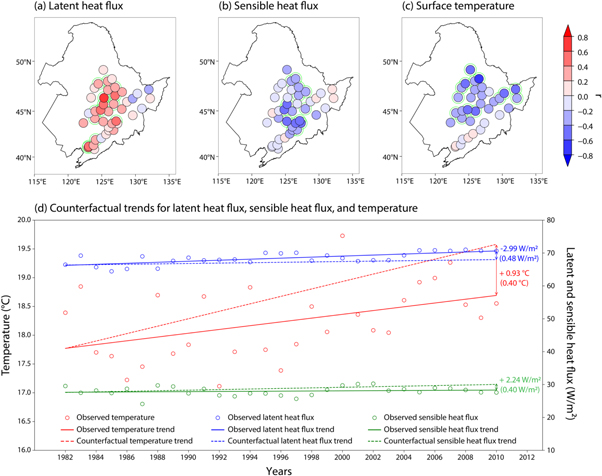
Figure 2. Spearman's correlation patterns of detrended time series of cropland fraction from 1982 to 2010 with detrended (a) latent heat flux, (b) sensible heat flux, and (c) surface temperature at each station during the late growing season of AS, and (d) observed trends for latent heat flux (blue), sensible heat flux (green), and surface temperature (red) (solid lines) and counterfactual trends when assume there is no cropland expansion (dashed lines). The time series in (d) are averaged over the 41 weather stations during AS. The values are the counterfactual absolute changes over the 1982–2010 period and the values in parentheses indicate the standard error for those estimates. The green circles in (a)–(c) denote significant correlations at the 10% level.
Download figure:
Standard image High-resolution imageHaving demonstrated that interannual variations in cropland expansion are generally negatively associated with temperatures (figure 2(c)), which appears related to energy partitioning at the land surface across stations, we next quantify the magnitude of cropland expansion's effect on long-term temperature and latent and sensible heat flux trends at the regional scale. To do so, we compare the long-term trends in latent and sensible heat fluxes along with temperature-associated with cropland expansion to what those trends would have been in the counterfactual case if cropland did not expand. To do this, we linearly regress each of AS latent heat flux, sensible heat flux, and surface temperature, averaged over the 41 weather stations on annual-scale cropland fractions (figure S4). Latent heat flux increases ∼0.80 W m−2 per 10 pp increase in cropland (p-value = 0.007), while the sensible heat flux and surface temperature decrease ∼0.60 W m−2 (p-value = 0.071) and ∼0.25 °C (p-value = 0.073), per 10 pp increase in cropland, respectively. Assuming no cropland expansion over the 1982–2010 period in Northeast China, based on figure S4 and cropland expansion rate (i.e. around 1.3 pp yr−1), both temperature and sensible heat flux would have increased by 0.93 °C ± 0.4 °C and 2.24 W m−2 ± 0.4 W m−2, consistent with wider anthropogenic warming, while the latent heat flux would have decreased by 2.99 W m−2 ± 0.48 W m−2 (figure 2(d), dashed lines).
Together the results of correlation, regression, Granger-causality, and counterfactual analyses point to a consistent response of surface cooling across stations and at the regional-scale associated with cropland expansion. Furthermore, our findings are not sensitive to our choice to focus on grid points with significantly increasing cropland nor our choice to detrend the data (figures S5 and S6). What is notable, however, is the reversal of the relationship between cropland fraction and surface temperature to be a positive one when neither variable is detrended (figures S5(h) and (i) and S6(h) and (i)). This is almost certainly due to the secular warming trend over the period attributable to anthropogenic forcing, which confounds the true association between crops and temperature.
3.3. Cropland expansion cools the full troposphere and alters tropospheric pressure over Northeast China
Beyond its apparent association with cooling at the surface, we find observed cropland expansion to be associated with cooling over the full troposphere (figures 3(a)–(c)). Interannual variations in the cropland fractions we identify are significantly (p-value <0.1) and negatively correlated with ERA-Interim temperature at various levels (850, 500, and 300 hPa), showing a physically-consistent region of tropospheric cooling. This spatial pattern of cooling over multiple-atmospheric levels is consistent with those from compositing analysis we provide as a methodological check on our correlation analysis (figures S7(a)–(c)). This cooling is also apparent in temperature data from NCEP-DOE (figures S8(a)–(c)) and NASA MERRA-2 datasets (figures S9(a)–(c)), suggesting that the result is robust to our data choices. Linear regression reveals that for every 10 pp increase in cropland fraction, temperature significantly decreases from 0.2 °C to 0.6 °C over the full troposphere in most regions of Northeast China (figures S10(a)–(c)). Assuming no cropland expansion over the 1982–2010 period in Northeast China, counterfactual ERA-Interim temperature would have been ∼0.8 °C–2.4 °C warmer throughout the full troposphere in the region (figures S11(a)–(c)).
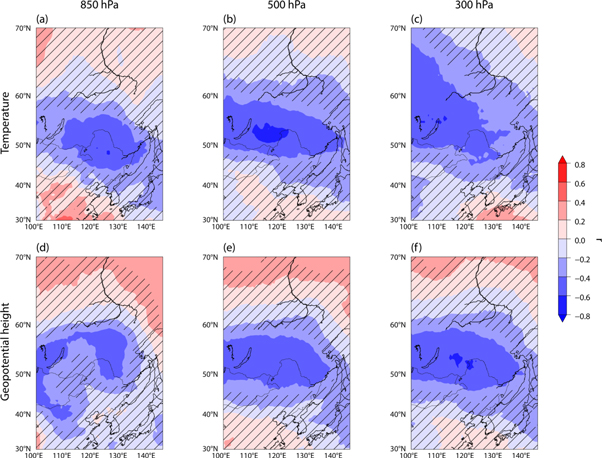
Figure 3. Spearman's correlation patterns of detrended time series of cropland fraction, area-averaged over the regions with significantly increased cropland from 1982 to 2010, with detrended ERA-Interim (a)–(c) temperature and (d)–(f) geopotential height, at the 850, 500, and 300 hPa levels at each grid point during the late growing season of AS. The unhatched regions indicate significant correlations at the 10% level.
Download figure:
Standard image High-resolution imageThe association of cropland expansion and regional cooling throughout the atmospheric profile is also related to variations in regional GPH from ERA-Interim (figures 3(d)–(f)). At the mid (500 hPa) and upper (300 hPa) levels, there are inverse relationships between the cropland fraction and GPH in the Northeast China over the late growing season, with significant regions at the 10% level in the central and northern parts (figures 3(e), (f)). At the lower level (850 hPa), the significant negative correlations are in the northern portions of Northeast China (figure 3(d)). This spatial pattern of reduced GPH also appears in the compositing analysis (figures S7(d)–(f)). As with temperature, the spatial patterns of these correlations are consistent across datasets (figures S8(d)–(f) and S9(d)–(f)). Regression analysis reveals that GPH significantly decreases ∼5–20 m for each 10 pp increase in cropland fraction throughout the troposphere in most regions of Northeast China (figures S10(d)–(f)). Assuming no Northeast China cropland expansion, counterfactual full troposphere GPH would have significantly increased ∼20–80 m over Northeast China (figures S11(d)–(f)).
Meridional vertical cross sections of correlations of cropland fraction with temperature (figure 4(a)) and GPH (figure 4(b)) emphasize the persistent signal of negative relationships among them from the surface to the upper tropopause (∼200 hPa). The significant and negative associations between the vertical profile of GPH and cropland fraction could be explained by a denser air column associated with tropospheric cooling (Snyder 2010), as cold air is more dense than warm air, causing pressure surfaces to be lower. This positive relationship between temperature and GPH is also revealed in a number of studies (Nikolic et al 2019, Tomczyk and Bednorz 2019), although some negative relationships may be found at the surface level (Liopart et al 2018). The correlation patterns of cropland fraction with temperature and GPH at different levels are generally insensitive to our focus on significantly increasing cropland regions and to our choice to detrend variables (figures S12–S14), as well as to the magnitude of interannual variability of cropland fraction data (figures S15 and S16).

Figure 4. Meridional cross sections of Spearman's correlation patterns of detrended time series of cropland fraction, area-averaged over the regions with significantly increased cropland from 1982 to 2010, with ERA-Interim (a) temperature and (b) geopotential height, zonally averaged over 122 °E ∼ 135 °E for AS. The unhatched regions indicate significant correlations at the 10% level. The red dashed lines indicate the location of northeast China.
Download figure:
Standard image High-resolution image
Together the remarkable coherence of the observed relationship between cropland expansion, surface energy partitioning, temperatures, and circulation across datasets, methodological choices (correlation, regression, compositing, Granger-causality, detrending), atmospheric levels, and theory suggests that the observational effects we identify are robust. This consistency is also reflected in modeling studies of other regions, such as the Middle East and central Asia, High Mountain Asia, and the Huang–Huai–Hai plain in China, each of which has cropland- and irrigation-induced cooling in the lower troposphere associated with reduced upper-troposphere GPH (Lee et al 2011, Yang et al 2016, de Kok et al 2018).
4. Conclusions
Land surface properties (e.g. albedo, soil moisture, surface roughness, and leaf area index) are crucial in determining regional climate (Field et al 2007, Lee and He 2018). Large alterations to the land surface, such as the conversion of grasslands to agricultural lands in Northeast Chia we analyze here, are thought to have their climate effects largely constrained to the near-surface (Zhu et al 2012, Zhao et al 2016). Using a newly developed 29 year time-series of LULC data over Northeast China, we provide the first observational evidence that Northeast China's massive agricultural expansion (from 299 584 km2 in 1982 to 382 400 km2 in 2010) over the last ∼30 years has a climate influence that extends well beyond the surface. This cropland expansion has altered the temperature structure of the regional troposphere and potentially its circulation. In particular, the lower GPH in the mid- and upper- troposphere could be associated with upper-level convergence and correspondingly lower-level divergence, which could reduce the warm season rainfall associated with the East Asian monsoon or affect upper-level atmospheric circulation, such as that associated with the Asian jet, potentially impacting Asian climate (Lee et al 2011). Further modeling analysis is needed to identify whether this is the case.
While the physical mechanisms explored in this study are consistent with expectations about the land surface and its influence on the atmosphere, there are several limitations in our analysis, given its focus on available observations. Firstly, the interannual variations of cropland area are likely influenced by the temporally-inconsistent variations of the GIMMS NDVI time-series due to sensor drift, the coarse spatial and temporal resolution of GIMMS dataset, and the failure of our classification scheme to effectively separate cropland from other land cover types (particularly grasslands). The latter would occur because of the similarity in phenological characteristics of crops and other classes. Improving the accuracy of year-to-year cropland classification would improve these results. Yet the consistent relationship of the interannual variations in cropland with climate variables through myriad analyses across 41 independent weather stations implies that the direction of year-to-year changes in cropland are correct, despite the possibility that the magnitude of the variability may not be. Secondly, the heat flux data used in this study were derived from Fluxnet-MTE. Fluxnet-MTE used 1982–1997 GIMMS NDVI to derive part of the long-term (1982–2008) global fAPAR record (Jung et al 2010). There is a potential endogeneity issue with using the Fluxnet-MTE data to evaluate surface energy partitioning because some of those data may inform the GIMMS NDVI data on which our classification is based. We note that fully independent energy flux data would be best. However, there remains remarkable coherence within the independent temperature and GPH analyses, suggesting that this endogeneity issue, if present at all, is small. Thirdly, the impact of cropland expansion on large-scale atmospheric circulation (figures 3 and 4) requires further exploration with idealized simulations with an Earth system model to ensure confounding effects are isolated.
Cropland expansion has been a powerful means to increase food security in China. At the same time, Northeast China has faced a number of droughts, resulting in increased irrigation water demands (Zhao et al 2016, Cong et al 2017, Yan et al 2018) and posing increased risks to regional water supplies. Future work should assess the robustness of our results using model experiments. However, the possibility that wider circulation and precipitation, and by extension, water availability, could be influenced by the regional pursuit for food security is crucial to assess to ensure that water managers are effectively positioned to robustly adapt not only to the changes brought on by anthropogenic warming, but those brought on by massive human-induced changes to the land surface.
Acknowledgments
We thank two anonymous reviewers for their constructive comments and suggestions to improve the manuscript. We also thank Dartmouth's Research Computing and Discovery Cluster. Y H, J S M, and E L conceived of the study. Y H, J S M, and E L designed the analysis. Y H and J S M interpreted the results and wrote the manuscript with contributions from E L.
: Data availability statements
The climate data that support the findings of this study are openly available. The ERA-Interim data was obtained from Research Data Archive at the National Center for Atmospheric Research, Computational and Information Systems Laboratory (https://rda.ucar.edu). The NASA MERRA-2 data is available at Goddard Earth Sciences Data and Information Services Center (https://disc.gsfc.nasa.gov). NCEP-DOE data was provided by the NOAA/OAR/ESRL PSD (https://esrl.noaa.gov/psd/). The Fluxnet-MTE dataset was downloaded from Max Planck Institute for Biogeochemistry (https://bgc-jena.mpg.de/geodb/projects/Home.php). The Chinese meteorological station data is archived by the China Meteorological Administration (http://data.cma.cn/en).
The land use and land cover data are available from the corresponding author upon reasonable request.