

Abstract
While there are obstacles to the exchange of long-term high temporal resolution precipitation data, there have been fewer barriers to the exchange of so-called 'indices'. These are derived from daily and sub-daily data and measure aspects of precipitation frequency, duration and intensity that could be used for the study of extremes. This paper outlines the history of the rationale and use of these indices, the types of indices that are frequently used and the advantages and pitfalls in analysing them. Moving forward, satellite precipitation products are now showing the potential to provide global climate indices to supplement existing products using longer-term in situ gauge records but we suggest that to advance this area differences between data products, limitations in satellite-based estimation processes, and the inherent challenges of scale need to be better understood.
Export citation and abstract BibTeX RIS

Original content from this work may be used under the terms of the Creative Commons Attribution 3.0 licence. Any further distribution of this work must maintain attribution to the author(s) and the title of the work, journal citation and DOI.
1. Introduction
Precipitation extremes can often lead to flooding, bringing widespread destruction. Conversely, they can rejuvenate barren landscapes, restore ecosystem vitality and recharge rivers and dams. Understanding how and why precipitation extremes vary is therefore vital for disaster preparedness and to enable adequate water resource management at multiple space and time scales. This requires both understanding of how extremes have varied in the past and the ability to provide robust estimates for how they might change in the future. Regarding the former, in an ideal world we would have precipitation observations for all space and time scales over the globe of the highest quality and consistency over the longest time period possible. Unfortunately in the real world, data quality, consistency and accessibility are limited (Alexander 2016, Thorne et al 2017) and this applies equally to point-based (in situ) observations and those observations that are remotely sensed (e.g. from satellites and ground radar). For reference, the area covered by rain gauges from some of the most comprehensive global datasets would fit into less than half a soccer pitch (Kidd et al 2017), although with the representativeness of a larger area. While statistical techniques can be employed to deal with quality (e.g. range checks) and consistency (e.g. break point detection and homogenisation), access to raw station observations on daily and sub-daily timescales remains one of the biggest road blocks to our ability to assess long-term changes in extremes over the globe (Zwiers et al 2013, Alexander 2016). While the World Meteorological Organisation (WMO) has resolutions on the policy and practice for the free exchange of meteorological data and metadata, in practice few National Hydrological and Meteorological Services have the capacity or mandate to disseminate daily data freely, especially historical time series. Overall, we face a substantial international 'reporting crisis' in which even the number of routinely available global monthly observations is substantially decreasing, dropping by around two-thirds from the 1980s to the present day (e.g. ftp://ftp.chg.ucsb.edu/pub/org/chg/products/CHIRPS-2.0/diagnostics/stations-perMonth-byRegion/pngs/all.station.count.CHIRPS-v2.0.png). We discuss this further in section 6.
Global-scale station-based daily data are available, for example, from NOAA's Global Historical Climatology Network Daily (GHCN-Daily) dataset (Menne et al 2012). However many locations only have relatively short records, with a lot of missing data and very poor coverage over large land areas such as Africa and South America (Donat et al 2013b, Funk et al 2015, 2019). Other global datasets, such as those provided by the Global Precipitation Climatology Centre (GPCC), are built by accessing some of the largest volumes of long-term daily station data (e.g. Becker et al 2013) but they are gridded products and licences are in place that restrict access to the underlying data and metadata. The situation is even worse for sub-daily data although efforts have been made recently to construct the first Global Sub-Daily Rainfall (GSDR) dataset, comprising over 23 000 hourly gauges (Lewis et al 2019a) although with relatively short records in many locations. Satellite products often have fewer restrictions on the data that can be shared, but they only provide indirect measures of precipitation and might be biased if not adjusted by gridded in situ measurements (Behrangi et al 2011). Even such bias corrections are unlikely to remove all issues across the full frequency distribution. In addition, the relatively short period of record covering the satellite era makes it difficult to make robust inferences about long-term changes. Accurate change assessments may be even more difficult when examining wet events, because the number of samples are inherently low and satellite estimates maybe be less consistent in capturing intense precipitation rates (Wen et al 2018).
With the data sharing and other issues highlighted above, long-term assessments of precipitation extremes have often relied on 'indices' as there have been fewer obstacles hindering their exchange. These indices condense information from the distribution of daily or sub-daily data to provide measures of intensity, frequency and duration usually on monthly, seasonal or annual timescales. While it would be preferable to have access to the full precipitation distribution, unlike the raw (sub-) daily in situ data, indices have provided us with a longer, more spatially complete picture of global changes. The purpose of this paper is to provide context for why and how these indices are used and to highlight some of their uses and misuses. We start by outlining the history of the need for indices along with examples of those most commonly used. We go on to not only focus on some of the valuable information extracted from indices, particularly on global scales, but also outline some of the issues associated with how they are used and their interpretation. Finally, we look forward to how large community-led projects can bring together multi-faceted observations (in situ, satellite, reanalyses) to address previously unattainable research questions related to the observational uncertainty of precipitation extremes using these indices.
2. The history of use of indices
While information about certain types of extremes, including the number of days above and below fixed thresholds, has been collated for centuries, much of the progress in defining indices has occurred in the last few decades (Zhang et al 2011). The motivation behind this followed the Second Assessment Report (SAR) of the Intergovernmental Panel on Climate Change (IPCC) in 1995 (IPCC 1995). It was clear at that time that we, as a global community, had inadequate data to determine whether consistent global changes in extremes had occurred over the 20th century (see Pages 22–23 of IPCC SAR). Bearing in mind the issues surrounding data availability, the impetus in the community was to assemble high quality and consistent time series of key variables. This happened through a series of high-level meetings and workshops such that by the time of subsequent IPCC reports there were much better analyses of precipitation extremes at both regional and global scales (e.g. Zhang et al 2011, Alexander 2016, Klein Tank et al 2009).
A main player in this endeavour has been the Expert Team on Climate Change Detection and Indices (ETCCDI). They were a group co-sponsored by the World Meteorological Organisation (WMO) Commission for Climatology (CCl), the World Climate Research Programme (WCRP) and the Joint Technical Commission for Oceanography and Marine Meteorology (JCOMM) and they existed in various incarnations for about 20 years from 1998 to 2017. ETCCDI led the collation of a standard set of indices (Peterson and Manton 2008), 10 of which relate to precipitation extremes (discussed later). Because of this standardisation, regional assessments could be intercompared and the same indices could be calculated and compared between observations and climate model output (e.g. Sillmann et al 2013). In parallel or subsequently to these efforts, other groups have also defined suites of (daily or monthly) indices for regional and global projects or analyses (Lloyd-Hughes and Saunders 2002, Giorgi et al 2011, Du et al 2019) which have supplemented or complemented those recommended by ETCCDI (although these remain at the core of many index lists). Importantly, more impacts-relevant indices are now being developed that can be used for sector applications such as health and agriculture (Alexander and Herold 2015). Surprisingly, however, progress is still limited and there are key regions of the globe such as Africa where the issue of very limited access to data remains. For example, a study by Omondi et al 2014, which focused on East Africa, found only three stations for Kenya, four stations for Tanzania and ten stations for Ethiopia—a region with a combined area of more than two million square kilometres. Indeed, there has been little improvement in the coverage of long-term precipitation extremes in 'global' datasets between IPCC Assessments since increases in the amount of available station data have not been generally in regions with sparse networks (Alexander 2016). However, multiple regional initiatives using the ETCCDI approach (Peterson and Manton 2008) ensured that many previously unanalysed regions could contribute to overall international assessments (e.g. Aguilar et al 2009, Skansi et al 2013, McGree et al 2019), including extensive data rescue efforts such as Atmospheric Circulation Reconstructions over the Earth (Allan et al 2011) and WMO's I-DARE (www.idare-portal.org). In many instances though data that are gathered from these approaches are not updated in real time so the issue of data availability in recent decades remains.
More recently, the focus has shifted to the use of indices for sub-daily data. Access to and availability of sub-daily station data is even more limited than that of daily data, but some datasets have been or are being developed, e.g. the Integrated Surface Database (ISD) (Smith et al 2011), HadISD (Dunn et al 2016, Dunn 2019), and the Global Sub-Daily Rainfall dataset (GSDR) (Lewis et al 2019a). As an example, GSDR has been collected as part of the INTENSE project (Blenkinsop et al 2018)—the first major international effort to focus on global sub-daily rainfall extremes. INTENSE has contributed substantially to the research efforts of the Global Energy and Water Exchanges (GEWEX) Hydroclimatology Panel (GHP) and the World Climate Research Programme 'Grand Challenge' on extremes (Alexander et al 2016). Part of this effort was to undertake a unique, global-scale collection of sub-daily rainfall data and apply a set of quality control methods to construct a new, high-quality global dataset. The GSDR dataset (Lewis et al 2019a) currently comprises over 23 000 hourly gauge observations. The average record length is 13 years with the earliest records in the 1950s but, as would be expected, it is highly variable in its spatial coverage, record length, completeness and quality (e.g. see figure 2).
Indices are now also being calculated for remotely sensed products (e.g. Herold et al 2017, Cattani et al 2018, Alexander et al 2019, Bador et al 2019) as well as reanalysis products (e.g. Donat et al 2016, Bador et al 2019, Alexander et al 2019). This is uncovering some interesting features in these products, such as a valid range attribute in GPCP which if applied limits the maximum value of any grid box to 100 mm d−1 (Bador et al 2019, Roca et al 2019) and therefore incorrectly represents the frequency distribution of daily rainfall maxima for example. These differences are not always apparent when assessing mean precipitation (Herold et al 2016, 2017, Alexander et al 2019, Bador et al 2019, Timmermans et al 2019), and their implications need to be better understood. The first step though is to identify these issues by comparing like-for-like products; that is, using the same measures of extremes on the same spatial scales. This is now becoming possible through large community-led projects (e.g. the World Climate Research Programme Grand Challenge on Extremes, the International Precipitation Working Group (IPWG) and the GEWEX Data and Analysis Panel (GDAP); see also section 6).
3. Types of indices
There is a plethora of indices based on daily precipitation data. Individual studies often choose the annual maxima or arbitrary thresholds such as the 95th, 99th and 99.9th percentile above which to define an extreme value. However, there can be unintended consequences of using such thresholds and the associated interpretation of results (see section 5). It also hampers intercomparison and leads to mismatch between studies which use different indices. For this reason much of the available research in recent years has focused on the set of ETCCDI indices calculated from in situ-based, satellite and reanalysis datasets, and also global climate model output on both regional and global scales (e.g. Donat et al 2013a, Sillmann et al 2013, Skansi et al 2013, Dunn et al 2014, Donat et al 2016, Herold et al 2016, 2017, Supari et al 2017, Cattani et al 2018). Figure 1 shows an idealised illustration of the ETCCDI indices based on a time series of daily precipitation. The ten ETCCDI indices shown are consecutive dry days (CDD), consecutive wet days (CWD), total wet-day precipitation (PRCPTOT), number of heavy precipitation days (R10mm), number of very heavy precipitation days (R20mm), very wet days (R95p), extremely wet days (R99p), maximum 1 d precipitation amount (R×1day), maximum 5 d precipitation amount (R×5day), simple daily intensity index (SDII) (see Zhang et al 2011). One could view this schematic as representing a station point, a satellite grid box or a regional average, for example, in which case the interpretation of the indices might differ slightly. The ETCCDI indices are all derived from daily precipitation data and measure aspects of frequency (e.g. days above fixed thresholds), intensity (e.g. wettest day, average daily intensity), and duration (e.g. consecutive wet and dry days). In general, one index value is provided for each year but a couple of the indices, maximum 1 d rainfall (R×1day) and maximum consecutive 5 d rainfall (R×5day) are available as one value per month.
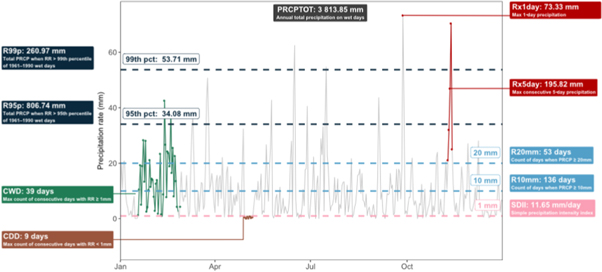
Figure 1. A schematic highlighting indices in an annual timeseries of daily precipitation using ETCCDI indices as an example. The indices shown are consecutive dry days (CDD), consecutive wet days (CWD), total wet-day precipitation (PRCPTOT), number of heavy precipitation days (R10mm), number of very heavy precipitation days (R20mm), very wet days (R95p), extremely wet days (R99p), maximum 1 d precipitation amount (Rx1day), maximum 5 d precipitation amount (Rx5day), simple daily intensity index (SDII) (see Zhang et al 2011).
Download figure:
Standard image High-resolution imageHowever, these quantitative precipitation values (in mm) only represent a sub-set of the types of indices that are used. Others including the Standardised Precipitation Index (SPI), the Standardised Precipitation and Evapotranspiration Index (SPEI), and the Palmer Drought Severity Index (PDSI), some of which incorporate additional meteorological variables, are widely used in drought studies (a Scopus search reveals over 2000 documents that have focused on one or more of these indices). In addition they have an advantage over indices such as CDD which is not suitable for use in climates which are seasonally dry. Furthermore, some other indices can characterize specific properties of the precipitation timeseries, such as day-to-day dryness or wetness persistence (e.g. Moon et al 2018, Du et al 2019), and some are more focussed on sector impacts with user-specified thresholds (Alexander and Herold 2015).
In addition, it is becoming increasingly clear that indices based on daily data will miss or mask some of the most intense events that could lead to flash flooding. This is particularly the case for convective extremes at point scale, found to be underestimated substantially by operational networks in a regional experiment (Schroeer et al 2018). While we have a limited knowledge of the processes that cause sub-daily extreme precipitation and its inherent intermittency (Lewis et al 2019a), initiatives such as INTENSE (Blenkinsop et al 2018) provide further impetus to create large datasets of indices derived from sub-daily data. The indices that INTENSE is proposing (see table 1) are similar to those already available at daily timescales (figure 1) e.g. monthly maxima of hourly and multi-hour rainfall accumulations, monthly counts of threshold exceedances, and indices reflecting the diurnal cycle (e.g. monthly index of the wettest hour). These indices were identified following discussions with the climate observations and modelling communities (Lewis et al 2019b) and correspond, where possible, to the existing daily ETCCDI indices (Zhang et al 2011, Donat et al 2013a) including standard naming and methodological conventions and software. Data will be made freely accessible for research purposes through www.climdex.org which is the web portal that also delivers station and gridded indices from HadEX2 (Donat et al 2013b) and GHCNDEX (Donat et al 2013a).
Table 1. Proposed set of sub-daily precipitation indices agreed within the international climate observation and modelling community (Lewis et al 2019b).
| Type of index | Index |
|---|---|
| Monthly maximum indices | Rx1h monthly maximum 1 h precipitation |
| Rx3h monthly maximum 3 h precipitation | |
| Rx6h monthly maximum 6 h precipitation | |
| Rx1hP percent of daily total that fell in the Monthly maximum 1 h precipitation | |
| Diurnal cycle indices | LW1H monthly likely wettest hour within a day |
| LD1H monthly likely driest hour within a day | |
| DLW1H dispersion around monthly likely wettest hour within a day | |
| S1HII simple hourly precipitation intensity index | |
| CW1H maximum length of wet spell | |
| Frequency/threshold indices | R10mm1h monthly count of hours when PRCP ≥ 10 mm |
| R20mm1h monthly count of hours when PRCP ≥ 20 mm | |
| Rxmm1h annual count of hours when PRCP ≥ nnmm, nn is a user defined threshold | |
| General indices | PRCPTOT1h annual total precipitation in wet hours |
4. The value of indices
The main value of indices is that they enable much larger amounts of information on extremes to be collated, shared and assessed than would otherwise be available. The strong restrictions on sharing daily and sub-daily data in some countries (despite a WMO resolution to the contrary—WMO 2016) typically do not apply to sharing indices. Standardised free software has also been developed, e.g. RClimDEX (Zhang and Yang 2004) and ClimPACT (Alexander and Herold 2015), to ensure a consistent definition and calculation of the indices so that they can be seamlessly integrated into multiple products. This consistency also means that researchers in countries that have data sharing restrictions can run the software themselves and share the indices output without contravening their respective data policies. These data have contributed to global-scale datasets such as the HadEX family (HadEX—Alexander et al 2006, HadEX2—Donat et al 2013b) which are static datasets that contain data over 1951–2003 and 1901–2010 respectively, and GHCNDEX (Donat et al 2013a) which does not have as good a coverage as HadEX2 but is updated in near real-time and is available via www.climdex.org. Analyses of the station data that have contributed to these global datasets display increasing trends in annual maximum daily precipitation that cannot be explained by chance (e.g. Westra et al 2013). These types of datasets have also consistently contributed to IPCC Assessment Reports since the Fourth Assessment Report in 2007. In particular, they have helped to form key statements around changes in observed precipitation extremes e.g. 'There are likely more land regions where the number of heavy precipitation events has increased than where it has decreased' (IPCC SPM 2013). However, even despite the use of indices, some regions remain poorly covered. In particular, long-term and high-quality data are available from less than half of the world's arid regions (Donat et al 2019), indicating it is hard to robustly estimate changes for the driest areas of the globe.
An example of the benefit of indices is shown in figure 2. For one sub-daily data set (GSDR), one daily dataset (GHCN-Daily) and one indices dataset (HadEX2) we show what is available in terms of station network (left hand column) and compare this to what is available if you restrict the request to the long-running (>20 years) and most recent (≥2000) data. Although HadEX2 has the fewest stations overall, it has the most well spread network coverage, especially in the tropics and Southern Hemisphere, and it loses the least percentage of stations when filtering the data using these criteria. HadEX2also has the longest running (>100 years) data timeseries. With the indices proposed by INTENSE, it is hoped that the network of precipitation indices based on sub-daily station data will improve enormously.
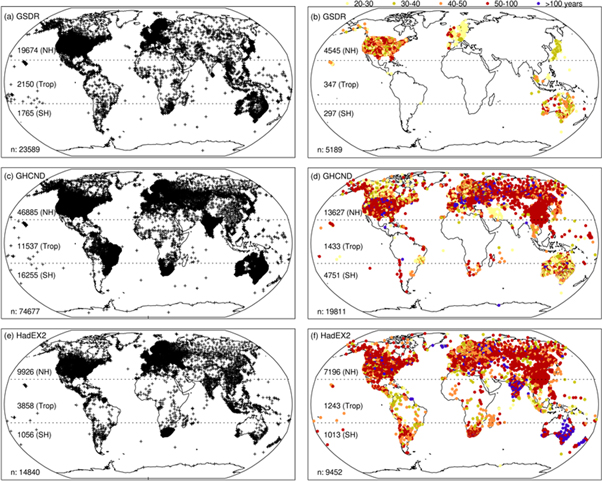
Figure 2. Left hand column: station locations in (a) GSDR (Lewis et al 2019a) (c) GHCN-daily (Menne et al 2012) and (e) HadEX2 (Donat et al 2013a). Note that station locations from GSDR are only included where lat/lon coordinates and 'real record length data' (see Lewis et al 2019a) are available and for GHCN-Daily and HadEX2 station locations are only included where at least one annual value of Rx1day can be calculated. Right hand column (b), (d), (f): stations that have at least 20 years of data that ends on or after 2000 (in the case of (d) GHCN-Daily and (f) HadEX2 the criteria applies to Rx1day calculations). Numbers on each map indicate the number of stations in the Northern Hemisphere (NH), Tropics (Trop) and Southern Hemisphere (SH) including the total (n) for each data product. The yellow, green, orange, red and blue circles on the right hand panels indicate stations with 20–30, 30–40, 40–50, 50–100 and more than 100 years of observations.
Download figure:
Standard image High-resolution imageA potential new avenue is that some satellite products now have long enough periods of record that could enable them to contribute to climate-scale assessments of precipitation extremes (Roca et al 2019). These could provide a valuable addition to existing analyses of long-term changes in precipitation extremes especially when using standard indices. Most satellite products provide daily accumulations although many (e.g. TRMM, CMORPH) are also available at sub-daily timescales (Roca et al 2019). The role of satellite precipitation products is particularly critical over oceans, remote regions over land or regions with very poor coverage. For example, CHIRPS data have been used to examine the severe and deadly flooding in Kenya in 2018 (Kilavi et al 2018) while CHIRPS and the Global Satellite Mapping of Precipitation (GSMaP) products have been used to explore flooding in Indonesia (Narulita and Ningrum 2018). Indices could help to enable an objective and meaningful intercomparison of a wider range of products and rainfall extremes.
Indices can provide us with useful information about averages, trends, variability and other statistics. They also reduce the amount of data that needs to be analysed which makes them computationally attractive. In addition some of the indices (such as Rx1day) also allow us to derive further statistics related to the distribution of extremes using extreme value theory. This can give us information about statistical parameters related to the mean, variability and skewness of the distribution of Rx1day and thus gives us some additional measures by which we can intercompare products. As an example, figure 3 shows the location, scale and shape parameters derived from the Generalised Extreme Value distribution fit to the data from two datasets using a block maxima approach. Results are compared from 50 °S to 50°N for an in situ-based gridded dataset REGEN (Contractor et al 2019) and a satellite-only derived product CHIRP (Funk et al 2015) for the period 1981–2013, when both datasets have available data. Figure 3 indicates that REGEN has a higher mean and variability in precipitation extremes than CHIRP and that there are large coherent differences between the products (shown in the right-hand column) for the location and scale parameters. Differences appear to be largest in data sparse regions such as the Amazon and West Africa, where satellite products diverge the most from in situ observations and where station densities are very low. The shape parameter does not show such coherent differences. In fact, it is often more sensitive to outliers and harder to interpret than location and scale (e.g. Brown et al 2008, Gross et al 2018). This does not mean that one dataset is necessarily 'more correct' than the other but rather, moving forward, we need to understand these kinds of differences if we are to make robust statements about precipitation extremes and their driving mechanisms, and particularly changes to the former caused by the latter. It is possible that such understanding can lead to knowledge and predictive capacity. For example, if we know that satellite estimates systematically under-represent observed precipitation extremes, then we may be able to infer that a 10% increase in satellite extrema may map to a 10% increase in observed extrema (assuming the relative increase is independent).

Figure 3. Location, shape and scale parameters between 50°S to 50°N derived by fitting a GEV distribution to the Rx1day index (annual daily precipitation maxima) for REGEN (Contactor et al 2019; left hand column) and CHIRP (Funk et al 2015; middle column) between 1981 and 2013 (when both products have available data). The right-hand column shows differences in those parameters CHIRP-REGEN. Regions where total annual precipitation averages <150 mm are excluded from the calculation.
Download figure:
Standard image High-resolution image
5. Potential issues and misinterpretation of indices
Since indices condense information from a larger continuous distribution into discrete point-based estimates that are then interpolated and gridded, this can often lead to unintended idiosyncrasies in the output timeseries. For example, inhomogeneities related to the start and end of climatological periods and their assessment can be open to misinterpretation. This happens particularly with (but is not limited to) percentile-based threshold indices.
Indices often measure the intensity or exceedances of specific percentile values (such as the 95th or 99th percentile in the ETCCDI indices R95p and R99p), but changes in precipitation intensity may differ for different parts of the distribution function (Contractor et al 2018, Pendergrass 2018). This illustrates that results for the indices may be sensitive to the choice of specific threshold if changes are disproportionate for different parts of the distribution. Also, if data are to be shared among researchers then the choice of reference period needs to be standardised and of sufficient enough length to ensure that biases are not introduced (e.g. Bador et al 2019).
There are two ways to calculate gridded fields of indices that represent a different 'order of operation' for extremes calculation and which can display quite different characteristics (e.g. Avila et al 2015). The first way is to grid the extreme indices that were first calculated from the (sub-)daily station data (which often has to be done for the in situ-based products due to data availability) and the second way is to grid daily/sub-daily data to the required resolution (e.g. 1 degree) and then calculate the indices from the coarse-resolution gridded product (such as would be produced in a satellite-based product or climate model output). This leads to a mismatch, with gridded extreme indices from in situ gauges generally producing much higher values on average than satellite or reanalysis products (e.g. Herold et al 2016) and creating an 'apples and oranges' comparison with climate model output (e.g. Sillmann et al 2013, Avila et al 2015). While some indices are much less sensitive to this order of operation (e.g. SDII) others are very sensitive (e.g. Rx1day, R20mm) and this can lead to different trend estimates for some indices across different products (e.g. Herold et al 2016). In the case of Rx1day, this can lead to regional trend estimates of opposite sign.
A different issue is sensitivity to the sample from which the percentiles are calculated. If percentiles are calculated only from wet days (typically daily precipitation ≥1 mm), then changes in such indices (measuring the intensity of the percentiles or the frequency or precipitation amount of exceedances) may also be affected by changes in the frequency of wet days, and therefore cannot solely be attributed to precipitation intensity changes (e.g. Schär et al 2016). Analysis and interpretation of changes is more straight-forward if percentiles are calculated from all daily precipitation values including wet and dry days, as this approach ensures constant sample size and any changes would therefore be due to changes in intensity alone. A possible disadvantage of this approach, however, is that in some dry regions the large majority of days are dry days, and the distribution consists of 0 mm values beyond the 90th percentile (often considered as a moderately extreme threshold). In the case of changing wet-day frequency, changes of infinity will be analysed for percentile values that are dry in one period but wet in another. The definition of a wet day itself might also be problematic as there is often under-reporting of small precipitation amounts at manual sites, or conversely spurious small reports (e.g. from dew) at automatic sites (e.g. Hennessy et al 1999).
Indices also do not always tell the full story and sometimes need to be investigated together with other indicators. For example, CDD and SPI are used as indices for meteorological drought, but for a comprehensive drought analysis one should also consider using indicators and variables that account for shortage in soil-moisture, streamflow, and groundwater that are also affected by changes in temperature and thus evapotranspiration (e.g. Seneviratne et al 2012, Orlowsky and Seneviratne 2013, Gudmundsson et al 2018, Humphrey et al 2018). Another example is that Rx1day depicts the annual maxima of daily precipitation but gives no indication on the timing of these annual extremes. Therefore different datasets might present similar R×1day values but their occurrence throughout the year, and thus their mechanisms of occurrence or associated impacts could be very different (Bador et al 2019). This may particularly make a difference to future projections of change.
Even in the absence of substantial bias, many satellite products have trouble recreating the true frequency of rainfall events and/or representing accurately the distribution of rainfall intensities. For example, while the CHIRPS2.0 data set, by construction, tracks well with long term mean in most locations, comparisons with station data indicate a tendency to underestimate the frequency of low intensity rainfall events, contributing to a tendency to overestimate the intensity of wetter events (Funk et al 2019). It is unclear how this will affect indices calculation or intercomparisons so care is required for analyses moving forward particularly regarding analysis of long-term trends.
6. Looking forward
Despite the shorter available records, satellite products may provide an essential part of precipitation extremes assessment moving forward since they can fill in some of the key regional gaps and some of them are now long enough to contribute to climate-scale assessments (Alexander et al 2019, Bador et al 2019, Roca et al 2019). For climate-scale assessments it is, however, critical to ensure that these long time series are homogeneous with regard to changing instruments, satellites, and also with regards to drift—in particular the latter being an issue specific to satellite data but not station observations, and therefore requiring specific statistical approaches to ensure homogeneity.
Nonetheless, the continued availability of climate-quality in situ and satellite observations remains critical, in particular in view of important in situ data loss in recent decades (Lorenz and Kunstmann 2012). However, there appear to be complex reasons for this decline. For some datasets (e.g. GPCC) the 'loss' of data in recent decades (e.g. figure 1 in Schneider et al 2016) mostly reflects the amount of time that it takes to ingest data into the archive rather than a substantial decline in station network (pers comm Andreas Becker). For other global datasets that rely on real-time updates it is a different story. In the case of CHIRPS (Funk et al 2015, 2019), for example, the lack of available observations is produced by both eroding observation networks, in some countries, combined with limited reporting of extant observations in other countries. Overall, interactions with colleagues in Africa and Latin and South America would suggest that the latter issue is a much larger issue. While the reporting of daily versus monthly data is certainly an important concern, the number of observations reported for the CHIRPS (and other) products are focused on monthly observations. So in this case at least there is certainly a substantial decline in the number of reported monthly observations. There are some countries, like Haiti, Afghanistan and Tanzania, where it seems that the number of available monthly observations is very low. For many countries, however, these observations exist. In many cases meteorological agencies are pursuing cost recovery objectives, and hope to monetize these resources. Unfortunately, this can lead to situations where meteorological agencies are not maximizing the societal value of their data, which can lead to a reluctance to share data. In general, this seems like a common situation, though it is very difficult to generalize, since each country's situation will be different. Finally, though a very minor contribution, is the rationalisation of country networks to provide a more uniform spatial coverage, leading to the closure of some stations.
What to do about this issue and how to utilise the data that are currently transmitted and distributed through the Global Telecommunication System (GTS)/WMO Information System (WIS), for example, would require complex and considered negotiations between WMO, National Hydrological and Meteorological Services, Global Data Centres and Research Organisations especially given the drive to commercialize data provision in some countries. Recent updates to the data sharing agreements between WMO nations have moved in the direction of further sharing (WMO Res 60 https://library.wmo.int/index.php?lvl=notice_display&id=20146), but have stopped short of requiring open access to data holdings. Under the Copernicus Climate Change Service (C3S), work on a Global Land and Marine Observations Database for in situ observations (C3S 311a Lot 2—https://climate.copernicus.eu/node/562) is brokering access to existing databases, collections and archives; nationally, regionally and globally for inclusion in a single database of monthly, daily and sub-daily holdings. The goal of this service is to build a single access point to bring together the current fractured state of land surface observations (Thorne et al 2017) in a manner similar to the International Comprehensive Ocean-Atmosphere Data Set in the marine domain (Freeman et al 2017). This could allow a mechanism to routinely update high temporal resolution climate data which currently does not exist and provides an avenue for sharing indices in a less ad hoc manner.
As a minimum, maintaining the current ground station and satellite observing systems is required with careful consideration for consistency as new types of observing systems are added or replaced, but also adding or providing access to ground measurements in regions which lack a representative set of gauges and in which satellite data can only be poorly validated (e.g. Africa). A good example for optimizing in situ measurements is the replacement of manual with automatic rain gauges. However, automatic instruments can be unreliable, suffering outages and having maintenance issues, leading to a rapid degradation of data quality and completeness in the years following installation. Long-term satellite precipitation products utilize infrared and microwave sensors. Continued availability of sensors with similar characteristics is needed to maintain a consistent climate data record. This involves the maintenance of geostationary weather satellites and the suite of asynchronous microwave-based satellite monitoring platforms.
We expect as an outcome of this Focus Collection that satellite-based products may be more extensively used in the climate extremes community, and in addition, that the remote sensing community may identify avenues for future product development dedicated to extremes research. A global database—Frequent Rainfall Observations on Grids (FROGs)—of rain gauge, satellite and reanalyses products produced or regridded on a 1° × 1° daily resolution has now been developed (Roca et al 2019). The datasets included there are being used for many studies and intercomparisons and indices form an important part of those intercomparisons (e.g. Bador et al 2019, Golian et al 2019). We also expect that precipitation indices from gridded datasets (in situ, satellite, reanalyses) will form an important part of coordinated model evaluation projects going forward. For example, a set of model-relevant indices is being developed for the evaluation of convection-permitting simulations, in the first instance for Europe in collaboration with the CORDEX Flagship Pilot Study (Coppola et al 2018).
Finally, we echo the sentiments expressed in Thorne et al (2017) regarding the need for improved data sharing, especially at the higher time resolutions. In situ measurements are vital for validating reanalysis, satellite and global model products, but also allow an independent assessment of the changes in extreme precipitation from these other approaches.
7. Conclusions
Although protocols are in place for widespread dissemination of meteorological data, in reality, there are major issues surrounding the availability of the high temporal resolution in situ data required to study precipitation extremes. Precipitation indices, which are derived from daily or sub-daily data and measure aspects of frequency, intensity and duration have generally suffered less from such data exchange barriers. While indices have been collated for centuries, it was not until the mid-1990s that a coordinated community effort was in place to standardise, compare and analyse them on a global scale. Indices allow us to monitor changes in precipitation extremes, to produce possible future scenarios, to standardise intercomparison across products, and importantly, to be able to analyse data that would otherwise be unavailable. Moving forward, while we still seek a mechanism to routinely update climate quality in situ data, remote sensing products, which are widely available on high temporal and spatial scales, could offer a useful supplement to the existing in situ-based extremes datasets. However much more needs to be done to ensure that their data can satisfy the necessary requirements for assessing long-term climate variations and trends. While there is no substitute to having access to daily and sub-daily precipitation data, indices have provided us with a framework to understand extreme precipitation in the absence of such information.
Acknowledgments
LVA was supported by the Australian Research Council (ARC) Centre of Excellence for Climate Extremes (CE170100023). HJF and EL are supported by the INTENSE project funded through the European Research Council (grant ERC-2013-CoG-617329) and HJF by the Wolfson Foundation and the Royal Society as a Royal Society Wolfson Research Merit Award (WM140025) holder. MB was supported by ARC Discovery Project DP160103439. MGD acknowledges funding from the Economy, Industry and Competitiveness Spanish Ministry for Ramón y Cajal 2017 (grant reference RYC-2017-22964). RJHD was supported by the Met Office Hadley Centre Climate Programme funded by BEIS and Defra, and by Copernicus Climate Change Service under Service Contract C3S 311a Lot2. SIS is supported by the DROUGHT-HEAT project funded by the European Research Council (grant agreement FP7-IDEAS-ERC-617518). VV acknowledges the support the Ministry of Earth Sciences, Govt. of India via the project 'Advanced Hydrologic Research and Knowledge Dissemination' (grant MOES/PAMC/H&C/41/2013-PC-II).
Data availability statement
Data sharing is not applicable to this article as no new data were created or analysed in this study.