

Abstract
An increase in retrogressive thaw slump (RTS) activity has been observed in the Arctic in recent decades. However, a gap exists between observations in high Arctic polar desert regions where mean annual ground temperatures are as cold as −16.5 °C and vegetation coverage is sparse. In this study, we present a ∼30 year record of annual RTS observations (frequency and distribution) from 1989 to 2018 within the Eureka Sound Lowlands, Ellesmere and Axel Heiberg Islands. Record summer warmth in 2011 and 2012 promoted rapid RTS initialization, increasing active slumps from 100 in a given year or less to over 200 regionally and promoting RTS initiation in previously unaffected terrain. Differential GPS and remote sensing observations of 12 RTSs initiated during this period (2011–2018) provided a mean headwall retreat rate for all RTSs of 6.2 m yr−1 and for specific RTSs up to 26.7 m yr−1. To better understand the dynamics of climate and terrain factors controlling RTS headwall retreat rates we explored RTS interactions by correlating headwall retreat with climate factors (thawing degree days, annual rainfall and annual snowfall) and terrain factors (aspect and slope). Our findings indicate a sensitivity of cold permafrost in the high Arctic to climate-driven thermokarst initiation, but the decoupling of RTS dynamics from climate appears to occur over time for individual RTS as terrain factors take on a greater role controlling headwall retreat. Detailed observations of thermokarst development in a high Arctic polar desert permafrost setting are important as it demonstrates the sensitivity of this system to changes in summer temperatures and highlight differences to changes occurring in other Arctic permafrost regions.
Export citation and abstract BibTeX RIS

Original content from this work may be used under the terms of the Creative Commons Attribution 3.0 licence. Any further distribution of this work must maintain attribution to the author(s) and the title of the work, journal citation and DOI.
1. Introduction
It is widely reported that warming in the Arctic is occurring at a rate 2–3 times faster than the mean increase in global air temperature (Arctic Monitoring and Assessment Programme (AMAP) 2017). This type of generalization fails to emphasize the spatial and temporal variability of changing climate in the Arctic and the intrinsic vulnerability of delicate ecosystems like polar deserts. The presence of permafrost (defined as 'ground material remaining frozen for 2 or more consecutive years', International Permafrost Association 1998, p 63) may lead to unexpectedly complex and highly heterogeneous landscape responses (Shur and Jorgenson 2007, Rowland et al 2010). One particularly problematic response of ice-rich permafrost terrain to warming temperatures is a change in thermokarst patterns (Kokelj and Jorgenson 2013). Thermokarst is the lowering of the land surface resulting from melting ground ice (Kokelj and Jorgenson 2013) and is a natural landscape process in ice-rich permafrost terrain (Pollard et al 2015). On the local scale it is often triggered by either a disturbance in surface conditions or ground thermal regime (or both) and can also be an outcome of normal long term erosion, slope processes and surface hydrology, as well as anthropogenic disturbance. However, on a regional scale its widespread initialization is indicative of systematic changes occurring over large areas and can usually be related to climate and/or extreme weather events (French 2007). For example, the timing of the increased formation of thermokarst lakes in northwest Alaska and the western Canadian Arctic corresponded to Holocene warming approximately 11.5–9.0 k years ago (Rampton 1988, Walter et al 2007, Kanevskiy et al 2014). Common thermokarst landforms include thaw ponds and lakes, pits and troughs associated with degrading ice wedges, active layer detachment slides, and retrogressive thaw slumps (RTSs) (Kokelj and Jorgensen 2013).
RTSs are typically 'horseshoe or cusp'-shaped mass wasting features consisting of an ablating headwall of ice-rich permafrost that feeds downslope flows of fluidized sediment. RTSs can develop rapidly as a pulse disturbance (Grosse et al 2011) and can remain active (continued thermokarst activity) for over 20 years (Lacelle et al 2015). Reported retreat rates of RTSs in northwestern Canada range between 7.2 and 26.7 m yr−1 (De Krom and Pollard 1989, Lantuit and Pollard 2008, Lacelle et al 2015). The appearance of 'megaslumps' has recently appeared in scientific literature for RTS areas greater than 20 ha (Günther et al 2015, Lacelle et al 2015, Kokelj et al 2015, 2017, Murton et al 2017). Widespread RTS development has been observed in recent decades (Lantz and Kokelj 2008, Kokelj et al 2015, Lacelle et al 2015, Segal et al 2016, Khomutov et al 2017, Kokelj et al 2017) and has been observed to induce a change in vegetation communities (Lantz et al 2009, Thienpont et al 2013, Cray and Pollard 2015), and release sediments and solutes that impact terrestrial and aquatic ecosystems (Kokelj and Lewkowicz 1999, Mesquita et al 2010, Kokelj et al 2013, Malone et al 2013). Although RTS activity is well documented for the low Arctic, including early detailed descriptions of their occurrence, distribution and nature (Mackay 1963, 1966); there is a general lack of similar observations and quantification of RTS dynamics in the high Arctic.
In this study, we present annual RTS observations on both landscape- and local-scales and demonstrate the sensitivity of the Eureka Sound Lowlands, Canadian high Arctic to increases in summer temperature. Landscape-scale RTS activity is presented as systematic aerial frequency counts of active RTSs between 1989 and 2018 based on direct observation. We also document the annual dynamics of 12 RTSs between 2011 and 2018 using a combination of high resolution satellite imagery and field mapping using a differential GPS (dGPS). We then correlate our annual retreat rate measurements to local climate and terrain factors to gain additional insight into RTS dynamics. Our study demonstrates that widespread thermokarst development may occur in regions with a mean annual air temperature (MAAT) of −19.7 °C and mean annual ground temperature (MAGT) as cold as −16.5 °C (Pollard et al 2015). We also highlight important differences in RTS dynamics between high and low Arctic permafrost regions.
1.1. Study area
Eureka sound is a narrow waterway separating Ellesmere and Axel Heiberg Islands, the 2 most northerly islands in the Canadian high Arctic (figure 1). The Eureka Sound Lowlands form an intermontane basin located on the central-western part of Ellesmere Island (Fosheim Peninsula), and the south-eastern side of Axel Heiberg Island, Nunavut, Canada (figure 1). Eureka, an Environment Canada Weather station (80°00'N; 85°55'W); is situated on the Fosheim Peninsula (figure 1). The Eureka Weather Station was established in 1947 and has been collecting daily meteorological measurements since that time. The region is characterized by a cold polar desert climate with mean annual, January and July air temperatures of −19.7 °C, −36.1 °C and +5.4 °C, respectively; and 68 mm of annual precipitation (falling mostly as snow; Pollard et al 2015).
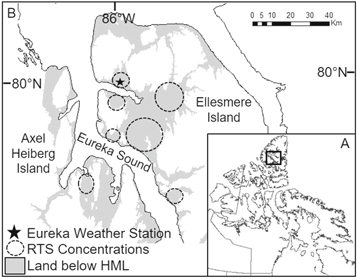
Figure 1. (A) Map of northern Canada. The box shows the Eureka Sound Lowlands area on west-central Ellesmere Island and eastern Axel Heiberg Island. (B) Study area showing the Eureka Weather Station and Eureka Sound Lowlands on Ellesmere and Axel Heiberg Islands, NU. Land below Holocene Marine Limit (HML), shown in gray, is composed of fine grain marine sediments with ground ice in the upper 20–30 m. Areas high in RTS occurrence observed during flight frequency surveys shown in dashed circles. The distance of the flight survey track was within 75 km of the Eureka Weather Station.
Download figure:
Standard image High-resolution imagePermafrost within the Eureka Sound Lowlands is cold, continuous and thick, measuring over 500 m (Pollard et al 2015). The temperature of permafrost at the depth of zero annual amplitude (∼15.4 m) is −16.5 °C (Pollard et al 2015). The upper 20–30 m of the permafrost in the study area is ice-rich, containing ice wedges, large tabular bodies of massive intrasedimental ice, as well as extensive pore ice and thin layers of segregated ice (Pollard 1991, 2000a and 2000b). The massive ice is found almost exclusively in fine grain marine sediments situated below the Holocene Marine Limit (figure 1(B), Pollard and Bell 1998). The length of the thaw season (mean air temperature above 0 °C) generally varies between 3 and 6 weeks in length. The area has a mean active layer thickness of approximately 57 cm (Couture and Pollard 2007). The area is characterized by patchy polar vegetation (Couture and Pollard 2007) occurring in lowland areas and depressions where snow and water can accumulate. As is common in the Canadian Arctic Archipelago, organic accumulation is thin and locally concentrated (Garneau 2000).
Past case studies in the research area have provided a high degree of direct observation of ground ice and cryostratigraphic analysis (Pollard 1991, Barry and Pollard 1992, Bell 1996, Couture and Pollard 1998, Pollard and Bell 1998, Robinson and Pollard 1998, Pollard 2000a, 2000b, Bell and Hodgson 2000, Pollard and Couture 2008, Roy et al 2018). Geomorphic studies on thermokarst have largely focused on active layer detachment slides (Lewkowicz 1990, Harris and Lewkowicz 1993, Lewkowicz and Harris 2005, Lewkowicz 2007), RTSs (Robinson 2000, Grom and Pollard 2008, Pollard et al 2015, Ward Jones and Pollard 2018) and ice wedge degradation (Hodgson and Nixon 1998, Couture and Pollard 2007, Pollard et al 2015, Becker et al 2016, Becker and Pollard 2016, Bernard-Grand'Maison and Pollard 2018). Interestingly, geomorphic disturbances involving RTS, active layer detachments and gullying release salts that have been shown to negatively impact vegetation growth (Kokelj and Lewkowizc 1999), whereas ice wedge degradation promotes vegetation growth (Becker et al 2016).
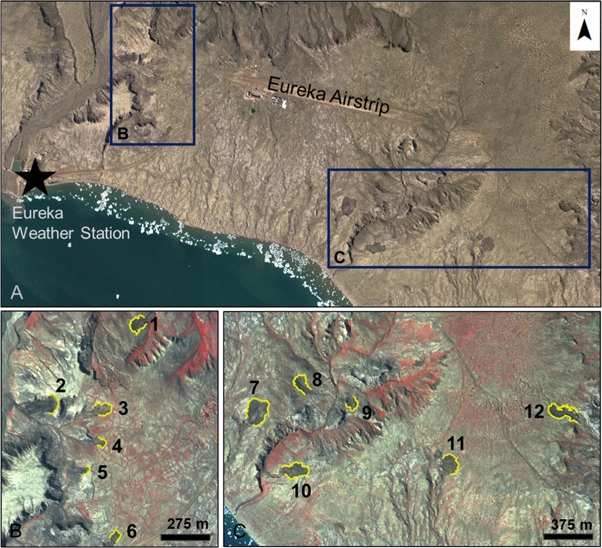
Figure 2. (A) 2017 Worldview 3 image (©Digital Globe) of the Eureka Weather Station area. The location of the Eureka Weather Station is denoted by the black star. Subsets B and C shows zoomed in areas of (B) and (C) showing the location of the 12 RTS study sites, all sites were within 5 km of the Eureka Weather Station. (B) and (C) are each false composite images of the same image shown in (A). Vegetation is seen in red.
Download figure:
Standard image High-resolution image2. Methods
2.1. Field observations
Annual RTS frequency counts between 1989 and 2018 were performed in mid-July (corresponding to generally halfway through the thaw season) each year from a helicopter using the same survey track. Survey consistency lies in the fact that the same researcher (W Pollard) performed the survey count each year following a transect mapped in 1989 and flown at the same altitude. RTS occur as discrete features in our research area, if two separate RTS merged into one after the survey, it would be counted as a single RTS the following year. RTSs tended to be clustered in areas (figures 1(B) and 3(A)–(D)) and were considered active only when ground ice was exposed in the headwall. Ground ice did not have to be visible along the entire headwall to be considered active because as RTS grow year to year, sediments preferentially accumulate along the flanks. RTSs derived from ice wedge ice or tabular massive ice were not differentiated.

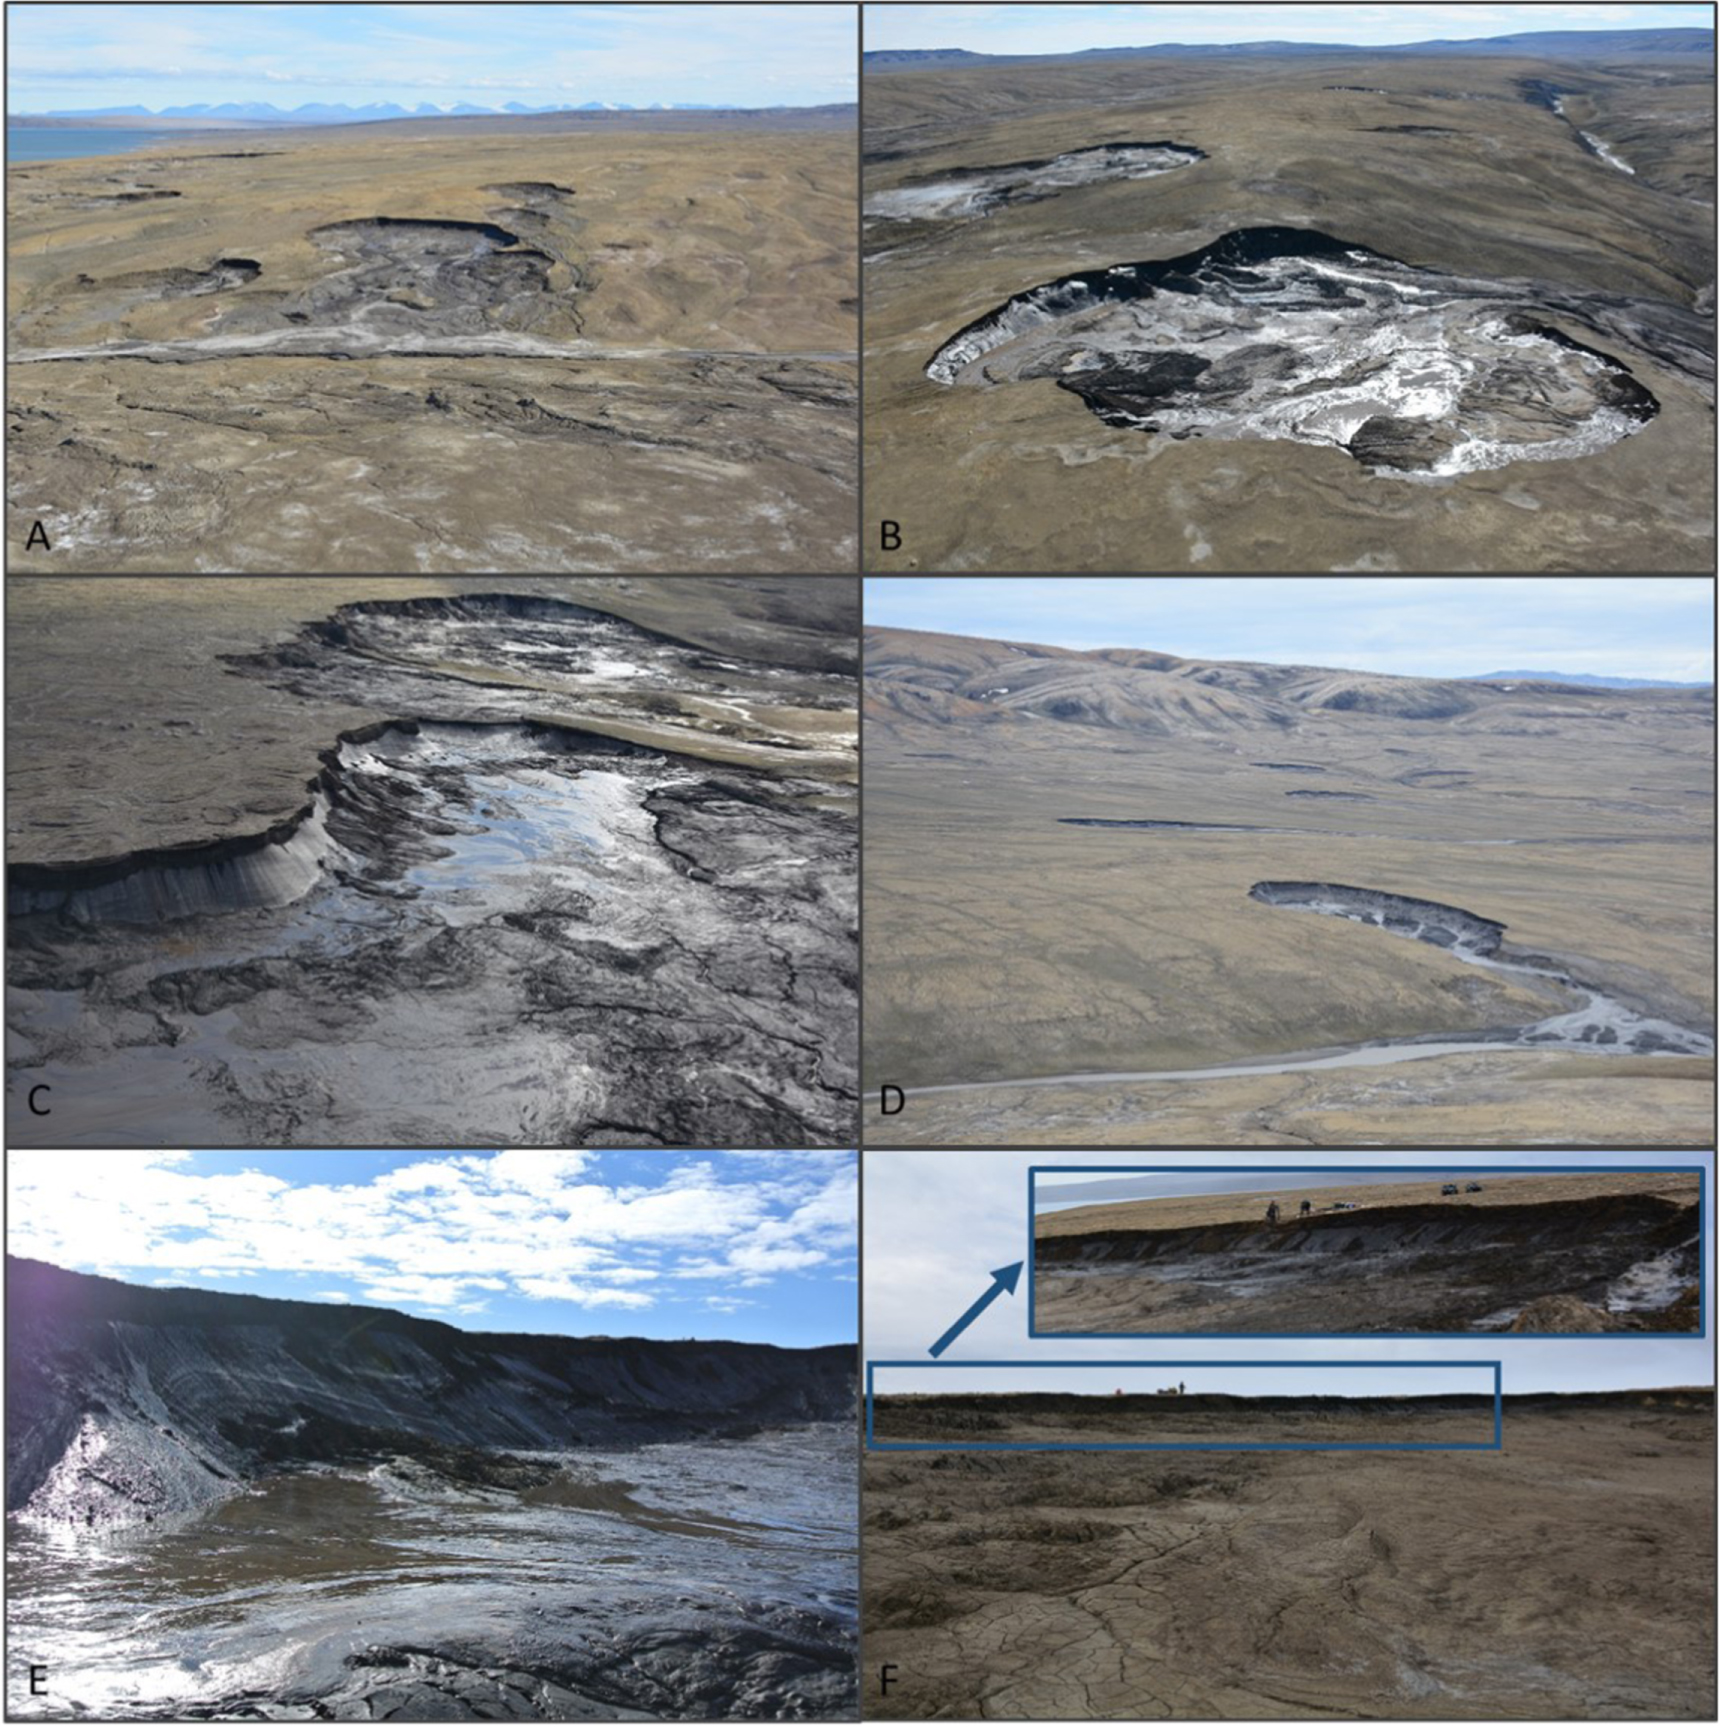
Figure 3. Images taken during aerial surveys (A), (B) in 2016 and (C), (D) in 2017. RTS 12 field image taken within the RTS slump floor in approximately the same location in 2014 (E) and 2018 (F) a zoomed in insert of the headwall is shown in the blue box.
Download figure:
Standard image High-resolution imageRTS headwall positions for 12 RTSs in the local area of the Eureka Weather Station were mapped on a near annual basis using a Trimble 5700 dGPS beginning in 2013 (supplementary data is available online at stacks.iop.org/ERL/14/055006/mmedia, table 1). dGPS points collected by the rover were post-processed using the base station with Trimble Geomatics Office v. 1.63 software. The base station was set up in the same location every year. Base station data were further post processed using Natural Resource Canada's Canadian Spatial Reference System Precise Point Positioning online tool (available at http://nrcan.gc.ca/earth-sciences/geomatics/geodetic-reference-systems/tools-applications/10925#ppp). Field points of headwall locations were digitized to line features (and all subsequent GIS analysis) using ESRI ArcGIS v.10.2 software. Some gaps in data collection exists for some RTSs due to time constraints. As many gaps as possible were filled and cross validated using high resolution satellite imagery.
Table 1. Mean headwall retreat values for all 12 RTS in the study derived from headwall position using either high resolution satellite imagery or dGPS points. All DSAS transects were used to determined mean retreat values. 2013 headwall measurements were missing for RTS 1, 10 and 12, therefore headwall positions in 2014 was averaged for both years (values marked with*). Retreat rates are organized so that the year data is shown corresponding to the year headwalls were mapped and retreat rates are measured beginning from the date in the previous year (for example, rates shown in 2012 are for the 2011–2012 period and those in 2013 are for the 2012–2013 period). Because RTS were mapped on different days (supplementary data, table 1), RTS have different thawing degree days (TDDs) as TDDs were organized into corresponding time periods.
| RTS 1 | RTS 2 | RTS 3 | RTS 4 | RTS 5 | RTS 6 | |||||||
|---|---|---|---|---|---|---|---|---|---|---|---|---|
| Mean Retreat (m) | TDD | Mean Retreat (m) | TDD | Mean Retreat (m) | TDD | Mean Retreat (m) | TDD | Mean Retreat (m) | TDD | Mean Retreat (m) | TDD | |
| 2011 | Init.a | 564.5 | Init. | 564.5 | Init. | 564.5 | N.Db | 564.5 | Init. | 564.5 | Init. | 564.5 |
| 2012 | 11.3 | 661.7 | 9.8 | 661.7 | 17.9 | 661.7 | Init. | 661.7 | 7.3 | 661.7 | 14.8 | 661.7 |
| 2013 | 2.5* | 138.6 | 6.2 | 138.6 | 2.6 | 138.6 | 3.8 | 138.6 | 3.3 | 138.6 | 2.5 | 138.6 |
| 2014 | 2.5* | 201.5 | 6.3 | 201.5 | 3.6 | 201.5 | 2.0 | 201.5 | 2.1 | 201.5 | 2.8 | 201.5 |
| 2015 | 4.5 | 559.8 | 7.2 | 559.8 | 9.4 | 559.8 | 7.7 | 559.8 | 5.4 | 559.8 | 6.4 | 504.2 |
| 2016 | 1.6 | 655.8 | 10.1 | 655.8 | 8.0 | 655.8 | 8.0 | 655.8 | 0.5 | 655.8 | 8.6 | 711.4 |
| 2017 | 0.2 | 353.7 | 4.3 | 278.4 | 1.5 | 278.4 | 1.7 | 353.7 | 0.4 | 353.7 | 1.8 | 353.7 |
| 2018 | 0.1 | 227.4 | 2.4 | 302.7 | 0.7 | 302.7 | 0.9 | 227.4 | 0.1 | 227.4 | 0.6 | 227.4 |
| RTS 7 | RTS 8 | RTS 9 | RTS 10 | RTS 11 | RTS 12 | |||||||
| Mean retreat (m) | TDD | Mean retreat (m) | TDD | Mean retreat (m) | TDD | Mean retreat (m) | TDD | Mean retreat (m) | TDD | Mean retreat (m) | TDD | |
| 2011 | Init. | 564.5 | Init. | 564.5 | Init. | 564.5 | Init. | 564.5 | N.D | 564.5 | Init. | 564.5 |
| 2012 | 10.4 | 661.7 | 14.7 | 661.7 | 17.9 | 661.7 | 24.2 | 661.7 | Init. | 661.7 | 26.7 | 661.7 |
| 2013 | 2.5 | 138.6 | 3.2 | 138.6 | 2.7 | 138.6 | 3.7* | 138.6 | 5.1 | 138.6 | 4.2* | 138.6 |
| 2014 | 3.8 | 201.5 | 5.1 | 201.5 | 2.0 | 201.5 | 3.7* | 201.5 | 5.0 | 201.5 | 4.2* | 201.5 |
| 2015 | 6.9 | 538.5 | 4.7 | 538.5 | 3.6 | 538.5 | 6.7 | 538.5 | 9.8 | 538.5 | 7.5 | 504.2 |
| 2016 | 3.4 | 535.6 | 1.6 | 535.6 | 0.6 | 625.1 | 4.7 | 535.6 | 7.8 | 535.6 | 7.3 | 569.9 |
| 2017 | 0.9 | 419.9 | 0.2 | 495.2 | 0.8 | 495.2 | 2.0 | 419.9 | 2.5 | 495.2 | 3.9 | 389.5 |
| 2018 | 0.0 | 302.7 | 0.4 | 227.4 | 0.0 | 227.4 | 0.8 | 302.7 | 2.7 | 227.4 | 2.2 | 333.1 |
2.2. Remote sensing observations
High resolution satellite imagery (Worldview (WV), ©DigitalGlobe) of the RTSs in the study area are available for 2008 (WV1), 2009 (WV2), 2011 (WV2), 2012 (WV2), 2016 (WV1) and 2017 (WV3). Georegistration offsets between each image were present, and due to the lack of high resolution ortho-imagery for the area, the 2016 imagery was georeferenced to ground control points (GCP) collected with the dGPS in 2016. All other images were georeferenced to the 2016 imagery. All images were subset to the areas with clustered RTSs to avoid errors produced by image distortions in regions not relevant to the analysis. Mean GCP RMSs ranged from 0.53 and 0.98 m for all images and max RMSs from ranged 0.87 to 1.93 m. The accuracy of the georeferencing was further verified using the 2017 satellite imagery and the 2017 field measurements for RTSs 2, 10 and 12 (by comparing the retreat distance between the dGPS measurements and the satellite image using the distance determined by daily retreat measurements; Ward Jones and Pollard 2018). Headwall positions were manually digitized for all RTSs included in this study in 2011 and 2012; and for RTS lacking dGPS measurements in 2016 (RTS 9) and 2017 (RTS 1, 4, 5, 6, 8, and 9; supplementary data, table 1). Headwall positions in 2014 for RTS 1 and 6 were estimated using the ArcticDEM developed by the Polar Geospatial Center at the University of Minnesota (https://pgc.umn.edu/data/arcticdem/). The ArcticDEM data used corresponds to the same day as dGPS data collection in 2014 (2 July). The only remaining gaps for headwall positions occurred in 2013 for RTS 1, 10 and 12.
Headwall retreat rates were determined using the Digital Shoreline Analysis System v. 4.3 (DSAS) ArcGIS software extension tool (Thieler et al 2009). Transect lines were generated every 10 m to measure retreat rates along each RTS headwall. Transect lines were reoriented as necessary to reflect the radial nature of RTS growth, and the same transect lines were used in each DSAS run. The dilution of accuracy (DOA; Lantuit and Pollard 2008) of headwall position ranged from 0.015 to 1.14 m yr−1 for all 8 years. The DOA for 2014 headwall positions for RTS 1 and 6 derived from the ArcticDEM is 2 m yr−1. To determine mean RTS retreat rates, all transect lines were used for the calculation, therefore if part of the RTS began to stabilize (as sediments accumulate along the flanks), this was taken into account for the overall RTS retreat rate. The transect line with the highest retreat rate was used for maximum retreat values. Each RTS was also digitized to a polygon to determine RTS area. Debris tongues were not taken into account for area measurements. The edge of the headwall perimeter after initialization was maintained constant and any increase in area was generated by headwall retreat.
2.3. Correlation of RTS Initiation and dynamics with climate and terrain factors
Historical climate data from the Eureka Weather Station (http://climate.weather.gc.ca/climate_data/daily_data_e.html?StationID=50737) was used for analysis, including total rainfall, total snowfall, Thawing degree days (TDDs) and mean July air temperatures. Linear regression analysis was used to determine any potential correlation between RTS frequency and aforementioned climate variables. Note, climate data for the frequency surveys are divided on an annual basis (for example, the TDDs presented for a given year are the total TDDs within that annual season) as the date of the surveys varied between each year, whereas climate data used for the 12 local RTSs are divided into time periods of recorded headwall locations (for example, if headwalls were mapped on 8 July, all recorded climate data after that date is used for the following headwall retreat measurement). Snowfall was divided into each winter period and rainfall into each summer period. For the 12 local RTSs, Spearman Correlation was used to determine any relationship between retreat rates (mean and max), and climate (rainfall, snowfall and TDDs). TDDs is used rather than mean monthly or seasonal air temperatures because cumulative warming is a better indication of heating and can be better quantified and separated between each time period when compared to RTS retreat magnitude.
RTS retreat was also compared to terrain factors, including; primary aspect (or orientation, of the dominant direction of the RTS), the slope of the slump floor along the dominant growth direction and the slope of the undisturbed area running parallel to the slump floor beside the RTS and extending 30 m beyond the 2018 headwall position. Slump floor slopes were compared between 2014 using the ArcticDEM and 2018 using dGPS measurements as well as abney slope surveys measured in the field. Slopes were determined using ArcGIS v. 10.2 in the same locations. Terrain slope factors were correlated with mean and max cumulative retreat for both time periods (2014 and 2018) using Spearman Correlation.
3. Results
3.1. Regional RTS frequency observations
The number of active RTSs in the aerial survey area (figures 1 and 3) does not surpass 100 until 2003 (figure 4), when active RTS frequency increased and became more variable. The number of RTSs surpasses 200 in 2011, 2012 and 2015. RTSs tend to occur in clusters and it is not uncommon for as many as 10 to occur within a small area (figures 3(A)–(D)). Because the frequency survey does not differentiate between newly initialized RTSs and RTSs active from previous years, the data does not give an indication of the number of years a single RTS was active or when it became inactive (ice-rich face was no longer exposed). The counts do, however, provide an indication of widespread increases in RTS initialization at the landscape scale. Such increases are observed in 2005, 2011, and 2015 and align with warmer summers. Observations during the 2015 and 2016 surveys showed many recent inactive RTSs (likely from 2013 and 2014) were not reactivated, indicating new RTSs initialized in undisturbed terrain.
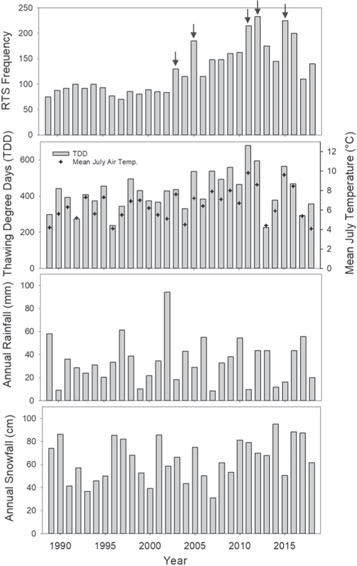
Figure 4. Top bar graph shows RTS frequency counts in the Eureka Sound Lowlands between 1989 and 2018; arrows point to years with large increases in RTS activity (2003, 2005, 2011, 2012 and 2015). Graphs below are annual TDD and mean July temperature (denoted by cross marks), annual rainfall and annual snowfall.
Download figure:
Standard image High-resolution image3.2. Local RTS retreat and growth dynamics
Using a combination of satellite image analysis and field observations, 10 RTSs of the 12 under study at Eureka initialized in 2011 (none of which were present in 2008 and 2009 imagery or observed during the 2010 field campaign) and the remaining 2 initialized in 2012. The RTSs around Eureka are concentrated northeast of the weather station (figures 2(A)–(B)) and south to southeast of the Eureka airstrip (figures 2(A)–(C)). RTSs that initiated in 2011 generally have the highest retreat during the 2011–2012 time period (mean/max retreat of all 10 RTSs was 15.5 m/30 .2 m; figure 5) and then experience a sharp decrease in 2012–2013 (3.3 m/7 .3 m); then increase again in 2014–2015 (6.2 m/13 .8 m) and decreases or begins to stabilize thereafter. Those initiated in 2012 experience the highest retreat either in 2014–2015 (mean/max retreat for RTS 11; 9.8 m/16 .2 m) or 2015–2016 (RTS 4; 8.0 m/14 .6 m). Over the course of the study, RTSs gradually experienced differential rates and parts of the RTS (usually the flanks) became inactive over time. In 2018, only 2 RTSs had massive ice exposed in their headwalls. Any measured retreat once ground ice is no longer exposed is due to the redistribution of sediments along the headwall during periods of reduced activity.

Figure 5. Mean (black circles) and max (white circles) retreat rates for the 12 RTS in the Eureka Weather Station Area. To determine mean retreat rates, all DSAS transects were used to determine mean retreat values and the transect with the highest value was used for maximum retreat values. All RTS except RTS 4 and 11 initialized in 2011, whereas these 2 RTS initialized in 2012. Measured retreat for RTSs without exposed ground ice in 2016–2017 (all RTS except 2, 10 and 12) and in 2017–2018 (all except RTS 10 and 12) measured the redistribution of sediments along the headwall and are considered inactive during the aerial frequency counts and are not included in calculating mean RTS retreat rates of all 12 RTSs. Note: vertical scales in graphs differ between each RTS.
Download figure:
Standard image High-resolution image3.3. Climate and terrain factors controlling RTS dynamics
When comparing climate data to regional RTS frequency counts using linear regression, only cumulative thaw season temperature variables are significant. TDD (p < 0.001) has an adjusted R2 of 0.362 and mean July temperatures (p < 0.001) of 0.398, respectively. The summers where RTS numbers surpass 200 align with the 3 warmest July's on record: 2011, 2012, and 2015 (corresponding annual TDDs for those years are 680.3, 595.3, and 565.1). Interestingly, the coldest July on record occurred is 2013 (TDD was 226.8) where many RTSs retreat slowed or became inactive.
For local RTS, Spearman Correlation was used to correlate both mean and max headwall retreat rates with TDD, snowfall and rainfall. Correlation coefficients are presented in table 2, and correlations that are statistically significant are presented in bold. Only TDD was found to be statistically significant for max retreat for RTS 3 (p < 0.05), 6 (p < 0.1) and 10 (p < 0.01); and significant for mean retreat for RTS 10 (p < 0.1) and 12 (p < 0.1).
Table 2. Correlation coefficients between either mean or max RTS retreat and TDD, rainfall and snowfall. Values in bold denotes statistically significant correlations. * refers to p <0.01, ** to p <0.05 and *** to p < 0.1.
| Correlations with mean retreat | Correlations with max retreat | |||||
|---|---|---|---|---|---|---|
| RTS | TDD | Rainfall | Snowfall | TDD | Rainfall | Snowfall |
| 1 | 0.342 | −0.523 | −0.108 | 0.667 | −0.487 | −0.036 |
| 2 | 0.643 | −0.464 | 0.286 | 0.536 | −0.643 | −0.214 |
| 3 | 0.643 | −0.429 | 0.0357 | 0.750** | −0.214 | 0.286 |
| 4 | 0.464 | −0.214 | −0.321 | 0.679 | −0.0714 | −0.286 |
| 5 | 0.321 | −0.571 | −0.179 | 0.357 | −0.464 | −0.0357 |
| 6 | 0.643 | −0.393 | 0.214 | 0.714*** | −0.214 | 0.286 |
| 7 | 0.607 | −0.393 | 0.0714 | 0.607 | −0.393 | 0.0714 |
| 8 | 0.286 | −0.357 | 0.0714 | 0.429 | −0.286 | 0.179 |
| 9 | 0.393 | −0.464 | −0.214 | 0.429 | −0.357 | −0.0714 |
| 10 | 0.703*** | −0.487 | −0.036 | 0.883* | −0.234 | −0.036 |
| 11 | 0.438 | −0.429 | 0.143 | 0.286 | −0.536 | −0.0357 |
| 12 | 0.667*** | −0.487 | −0.036 | 0.342 | −0.523 | −0.108 |
In addition to climate variables, we assessed terrain factors including primary RTS aspect (figure 6), and slope (figure 7). Aspect is variable, but 7 RTSs occur between 180° and 270°. RTSs that experienced the least amount of retreat are oriented in a more northern direction (RTS 1, 5, and 9), and interestingly the more active RTSs are oriented either more westward (RTS 2, 3, and 10) or eastward (RTS 12; figure 6). Slopes of undisturbed areas range from 1 ° to 9 ° and the two remaining RTSs with massive ice exposed in 2018 (RTS 10 and 12) had the lowest undisturbed slopes (figure 7). All RTSs had exposed massive ice in 2014. Slump floor slopes either steepened or decreased between 2014 and 2018 depending on the redistribution of sediments from the retreating headwall. When comparing slump floor slopes to undisturbed slopes, RTSs with a higher ratio of RTS floor to undisturbed terrain slopes (both 2014 and 2018) have the greatest headwall retreat in the study. There is a statistically significant relationship between mean and max RTS retreat and this ratio in both 2014 (p < 0.05) and 2018 (p < 0.05 for mean retreat and p < 0.1 for max retreat).
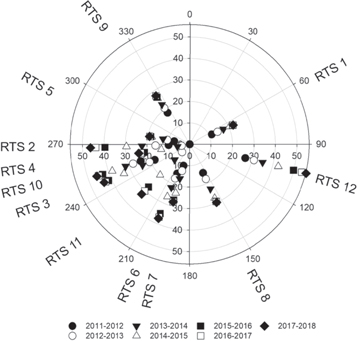
Figure 6. Mean cumulative RTSs retreat (m) and primary RTS aspect (using the centre axis of the dominant growth direction) of the 12 RTSs in the Eureka Weather Station area.
Download figure:
Standard image High-resolution image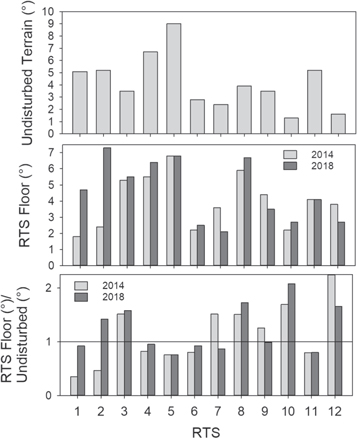
Figure 7. Top graph shows the slope of the undisturbed terrain immediately adjacent to each RTS and running parallel to the dominant growth axis. Undisturbed slopes extended 30 m beyond the 2018 headwall. Middle graph shows the slope of the RTS slump floor of the dominant growth direction and is parallel to the slope of undisturbed terrain. Bottom graph shows the RTS floor to undisturbed terrain ratio of these 2 slopes.
Download figure:
Standard image High-resolution image
4. Discussion
4.1. RTS occurrence and retreat rates
The widespread presence of stabilized RTSs and high centred ice wedge polygons in the Eureka Sound Lowlands show that thermokarst has been evolving this landscape since the initiation of ground ice formation (Pollard and Bell 1998), however detailed studies on the distribution and dynamics of these features had not been conducted. Between 1989 and 1999, 7 areas emerged as centres of RTS activity related to areas characterized by thicker accumulations of marine sediment with massive ice deposits (figure 1(B); Pollard 2000a, 2000b). Despite fluctuations in the number of slumps at these sites, they remained the areas with the highest densities over the ∼30 year period of record with a small number of other RTS mapped outside these areas. Accordingly, RTS were relatively constant until 2002. RTS initiation was likely dominated by local factors such as gullying, stream bank erosion and slope processes. RTS activity begins to increase after 2003 and suggest a sensitivity of high Arctic polar dessert landscapes with low a MAAT and MAGT (−19.7 °C and −16.5 °C, respectively; Pollard et al 2015) as increased warming initiate widespread RTS at the landscape scale. This pattern is strongly reinforced by the development of new RTSs in 2011 and 2012 in areas where they were absent in all previous aerial surveys. Two areas in particular, the south side of Slidre Fiord (figures 1 and 3(A), (B)) and the Mokka Fiord area (figures 1 and 3(D)) contributed 105 new RTS combined. Within our aerial dataset, if we consider 1989–2002 to be baseline data, the difference in the highest mean July air temperature during this time (7.3 °C in 1993 and 1995) and the highest July on record (9.8 °C in 2011) differs by 2.5 °C, corresponds to RTS counts of 92, 93 and 215, respectively. The first increase in 2003 may have partially been impacted by the high rainfall of 2002, at least locally, but this year also coincided with the first record mean July temperature compared to the baseline (7.6 °C with an RTS count of 130). Our results show RTS initiation is widespread during anomalously warm summers (for example, in 2011, 2012 and 2015, RTS frequency counts were above 200) and RTS retreat can be rapid (mean and max retreat for the 10 initialized RTSs combined during the 2011–2012 period was 15.5 m and 30.2 m, respectively).
We attribute the high activity of RTS development and permafrost sensitivity at our site to the lack of a protective plant and soil organic layer cover and the presence of near-surface massive ground ice. Being a polar desert, areas of bare soil are widespread. The vegetation zones of the Eureka Sound Lowlands are less dense and diverse than vegetation zones further south (Edlund and Garneau 2000). These differences in ecosystem characteristics offer less protection, leaving permafrost to be more sensitive to react to increases in summer temperatures as this 'climate-driven permafrost' is in equilibrium with climate (Shur and Jorgensen 2007). With possibly a few exceptions (e.g. eastern Banks Island (Fraser et al 2018, Lewkowicz and Way 2019)), the lower Arctic permafrost has ecosystem (mainly plant and soil organic layer) protections that acts like a buffer to prevent rapid responses to short summer conditions.
Comparing retreat rates of our study to other studies conducted in the Eureka Sound Lowlands shows maximum rates in this study are in agreement (table 3). Maximum total retreat measured by Robinson (2000) for 9 RTSs in 1991 range 3.99 and 6.37 m in 1991; and between 2.51 and 7.72 m in 1992. The RTS studied in Grom and Pollard (2008), retreated a maximum of 5.6 m over a 17 day period in July 2007. TDD in 1991, 1992 and 2007 was 392.9, 272.8 and 538, respectively. TDD for the 2013–2014 and 2017–2018 (figure 4) were similar as those in Robinson (2000), maximum retreat in this study ranged 3.36–18.0 m during the 2013–2014 period and ranged 6.5–9.0 m in 2017–2018 (for RTS 10 and 12 only). Maximum retreat for warmer periods, such as the 2015–2016 period (TDD was 504.2–559.8 depending on the RTS, see table 1) ranged 1.9–17.6 m. While previous studies only focused on 1 or 2 seasons and few RTSs, this study assessed a larger number of RTSs annually from initialization to stabilization for all but 2 RTSs (RTS 10 and 12). Our more comprehensive assessment of RTS dynamics provides new information on the inter-slump and inter-annual variability in the Eureka Sound Lowlands study region.
Table 3. Summary of reported RTS retreat rates in Canada. When available, mean annual rates as reported in the study are listed here and not maximum rates.
| Location | Retreat rate | Time period | Study |
|---|---|---|---|
| Eureka, Fosheim Peninsula, Ellesmere Island | 5.3 m yr−1 | 2011–2018 | This study |
| Ellesmere Island | 9–14 m yr−1 | Unknown | Burn and Lewkowicz (1990) |
| Fosheim Peninsula, Ellesmere Island | 5.6 m | 17 days in July 2007 | Grom and Pollard (2008) |
| Hot Weather Creek, Fosheim Peninsula, Ellesmere Island | 3.99–6.37 m 2.51–7.72 m | 1991 (July–August) 1992 (Full season) | Robinson (2000) |
| Banks Island | 12.2 m yr−1 14 m | 1952–1962 1 Aug 1983–22 July, 1984 | Lewkowicz (1987) |
| Mayo, YT | 10 m yr−1 | 1949–1993 | Burn (2000) |
| Richardson Mountains and Peel Plateau, northwestern Canada | 12.4 ± 7.4 m yr−1 | 1990–2010 | Lacelle et al (2015) |
| Herschel Island, YT | 6.5 m yr−1 | 1988 | De Krom 1990 |
| Herschel Island, YT | 0.61 m yr−1 0.45 m yr−1 | 1952–1970 1970–2000 | Lantuit and Pollard (2008) |
Our observations are comparable to observations from the low Arctic that also found an increase in the occurrence of RTSs over the last several decades (Lantz and Kokelj 2008, Günther et al 2015, Kokelj et al 2015, Lacelle et al 2015, Segal et al 2016, Kokelj et al 2017, Murton et al 2017, Lewkowicz and Way 2019). Comparing average retreat rates from our study to studies in the low Arctic shows this area has generally less overall mean annual headwall retreat (table 3). Mean retreat for all 12 RTSs over the entire study period yields a rate of 6.2 m yr−1. Lewkowicz (1987) measured a 12.2 m yr−1 average retreat rate on Banks Island. Burn (2000) provides a 10 m yr−1 rate in the central Yukon. In addition, the larger sized RTSs are generally bigger in the low Arctic compared to those occurring in the high Arctic. Günther et al (2015), Lacelle et al (2015), Kokelj et al (2015) refer to 'megaslumps', RTSs with areas greater than 20 ha, or 200 000 m2. RTSs this size have not yet been documented in the high Arctic. The largest RTS in this study (supplementary data, table 4) was RTS 7 and it reached a maximum area of almost 17 000 m2, (∼2 ha) but larger RTSs have been observed during the aerial surveys. Segal et al (2016) generally found smaller RTSs in the northern most range of their study on Banks Island. RTSs monitored on the Central Yamal Peninsula in Siberia ranged from 4700 m2 to 40 800 m2 (Khomutov et al 2017). The increase in size and frequency of RTSs in the low Arctic has been attributed to increased amounts of summer precipitation (Kokelj et al 2015). RTSs in the low Arctic that are precipitation-driven would more easily grow in size compared to the temperature-driven RTSs of the high Arctic as an increase in precipitation contributes to sediment removal, keeping the ice face exposed and maintaining active slumping. Daily monitoring of an RTS in the Eureka area in 2017 (Ward Jones and Pollard 2018) showed no increase in retreat during days with rain. Warm, sunny days saw the most retreat, this is consistent with past RTS (Grom and Pollard 2008, Robinson 2000) and active layer detachments (Lewkowicz 2007) studies conducted in the area. We believe lack of precipitation, rather than ice content, limits RTS size as 20 m headwall heights have been measured in the Fosheim Peninsula (Pollard et al 2015).
4.2. Spatial and temporal scales of RTS activity
RTSs may appear to behave differently depending on the scale used in the study and as a result this can make it difficult to explain RTS occurrence and activity. Studies assessing RTS dynamics at large regional scales must contend with different local climates and low resolution meteorological records, as well as different surficial geologies. Case studies assessing a single RTS during a single season or two have limited context, as the time when the RTS is studied within its life cycle may be important. Results from this study show that RTSs can respond differently under the same climatic factors, such as with RTS 2, 5, 7 and 11 that were more active during the 2014–2015 season rather than the 2015–2016 season, whereas RTS 3, 4 and 6 were more active during 2015–2016 (figure 5). The single RTS chosen within a case study could potentially be more or less active than the average RTS in the area.
Comparing RTS dynamics in the Eureka area to RTS frequency at the landscape scale of the Eureka Sound Lowlands shows that while local RTS dynamics can fluctuate, overall landscape-scale RTS activity can remain relatively constant as occurred between 1989 and 2002. This is due to areas where RTSs became inactive but initialized in others. However, when summer temperatures reach record highs, such as what occurred in 2011, widespread RTS initiation was experienced both in the Eureka area and in the Eureka Sound Lowlands. This widespread RTS initiation indicates variables at the landscape scale are triggering RTS development rather than more localized factors. The rapidity of RTS development results from the climate-driven type of permafrost found in the high Arctic (Shur and Jorgensen 2007).
4.3. RTS interactions with climate and terrain factors
When considering impacts of climate on RTS activity, at the landscape scale, TDD and mean July air temperature were statistically significant and alone accounted for 36% and 40% of RTS frequency variability. The RTS frequency counts would likely have a higher adjusted R square if it only accounted for newly initialized RTSs rather than all active RTSs. At the local scale, TDD was only statistically significant for 4 of the 12 RTSs (table 2). Lacelle et al (2015) found that only about half of 19 RTSs had statistically significant relationships with mean annual surface temperature, TDD and total solar irradiance. We attribute these differences to the role climate and terrain factors play in RTS dynamics. Our study indicates that climate warming in the high Arctic, specifically increases in summer air temperatures, drives large scale RTS initiation (both at a local and landscape scale) but that over time the majority of RTSs become decoupled from climate. Although climate and ambient conditions would remain important in maintaining RTS activity, other factors, such as slope, RTS morphology and aspect, may become more dominant in determining retreat rates and RTS dynamics. The 12 RTSs in the Eureka area are located in close proximity and share the same climatology and surficial geology. Of the 12 RTSs, only 3 RTSs had massive ice exposed during the 2017 summer (RTS 2, 10 and 12), and only 2 during the 2018 summer (RTS 10 and 12).
Comparing terrain features of aspect, undisturbed terrain slope (slope running parallel to the RTS and extending 30 m beyond the 2018 headwall), and slope of the slump floor (slope running along the axis of dominant retreat direction) between all 12 RTSs yields some trends. Aspect is generally considered to be an important component of RTS activity as the more solar radiation an RTS receives, the more its exposed ice face will ablate and thus lead to more retreat (Lewkowicz 1986, 1987, Burn and Lewkowicz 1990). In the Eureka area, the majority of RTSs are oriented west to south. This is consistent with the findings from other regional studies (Lewkowicz 1987, Grom and Pollard 2008, Lacelle et al 2015). One RTS important to note is RTS 12, which is east facing, and has experienced the most cumulative retreat of all 12 RTSs (figure 6) and is one of the remaining two RTSs (with RTS 10) to have massive ice exposed as of summer 2018. Assuming that most other factors are more or less constant, this suggests that aspect may be important in RTS initiation, but it may not be as critical for maintaining RTS activity as other factors can be more important in this regard. Wang et al (2009), found no relationship between RTS retreat and orientation in the Mackenzie Valley. Lacelle et al (2015) found that overall RTS occurrence was dominant on east facing slopes but greater than 20 m yr−1 mean retreat rates occurred on west to south facing slopes. Khomutov et al (2017) found no relationship between RTS occurrence and aspect in the Central Yamal Peninsula but notes that RTSs develop more rapidly on south facing slopes. An important difference between high and low Arctic RTS activity relative to aspect is the length of daylight and the angle of the Sun in the sky during the thaw season. For example, the dates the Sun remains above the horizon for 24 h a day ranges between 25 May and 20 July for Inuvik, NWT (68 °N) and 14 April to 29 Aug (80 °N) for Eureka, NU. Inuvik has more days experiencing both daylight and darkness than Eureka as the Sun sets for polar darkness from 5 December to 7 January in Inuvik and from 20 October to 20 February in Eureka. The angle of the Sun and the amount of solar radiation an RTS receives with the same aspect in both places is likely different during the same time period.
We propose the ratio of the slope of the slump floor to the slope of undisturbed terrain, both running parallel to each other along the dominant growth direction of the RTS as a simple terrain metric to estimate an RTSs' lifespan. Our results suggest this may be an important factor in maintaining RTS activity, particularly in areas with low precipitation. Being a polar desert with low amounts of rainfall, the principle source of moisture within the slump floor to evacuate sediments comes directly from melt of the ice face. Therefore, RTSs with steeper slump floors can more readily evacuate sediments, coupled with lower undisturbed terrain slopes may control sediment input amounts. The relationship between cumulative mean and max retreat between both corresponding time periods where these slopes ratios were compared (2014 and 2018, respectively) was statistically significant (p < 0.05 for 2014 and mean 2018 retreat; p < 0.1 for 2018 max retreat). Furthermore, 3 of 4 RTSs that had statistically significant relationship to TDD (RTS 3, 10 and 12) had slump floor to undisturbed terrain ratios above 1. We suggest that RTS retreat may maintain a statistically significant relationship to climate as long as their terrain factors allow them to do so (e.g. have optimal slopes for sediment evacuation).
5. Conclusion
This study presents long term observations of RTS initiation and dynamics in a high Arctic polar desert environment. The strength of this study is the repeated and extensive amount of direct field observations, built upon past case study research in the area by the research team, in an area with a reliable long-term climate data record. RTS dynamics are assessed both at the landscape scale (with annual aerial RTS frequency counts) and locally (annual retreat for 12 RTSs in the Eureka Weather Station area using field and remote sensing data). Our findings support the following conclusions:
- (1)Widespread thermokarst development is possible in a high Arctic (∼80 °N) polar desert environment with a MAAT of −19.7 °C and MAGT of −16.5 °C as the lack of vegetation and soil organic layer makes permafrost directly responsive to increases in summer air temperatures.
- (2)Despite the relatively short duration of the thaw season, extensive initiation of high Arctic RTSs are driven by warm summer air temperature but over a period of several years, RTSs may decouple from ambient conditions when terrain factors become more dominant in maintaining active RTSs.
- (3)Mean retreat for all 12 RTSs observed in the Eureka area when active during the study period (2011–2018) was 6.2 m yr−1 and for individual RTSs range up to 26.7 m yr−1. Maximum retreat for specific RTSs was as high as 79 m yr−1.
- (4)RTS aspect may be more important in RTS initiation but less so in maintaining active RTS retreat.
- (5)The ratio of the slope of the slump floor compared to (and running parallel to) the slope of undisturbed terrain may be a simple metric in estimating an RTS's life span as a high ratio will most likely allow a RTS to remain active for longer.
Finally, we highlight the unique character of high Arctic RTSs and potentially important differences between low and high Arctic RTS dynamics. Increased inland low Arctic RTSs is associated with both increases in temperature and precipitation whereas our study shows that high Arctic RTS dynamics are associated with warm summer temperatures. These differences are critical when estimating future RTS activity in the Arctic as a whole.
Acknowledgments
The authors wish to thank all of the staff at the Eureka Weather Station for their much appreciated assistance during fieldwork, for lodging and assistance to M Ward Jones during her tenure of the Research Support Opportunity in Arctic Environmental Studies provided by the Association of Canadian Universities for Northern Studies (ACUNS). Additional logistical field support was provided by the Polar Continental Shelf Program (PCSP). Funding for this research was provided by the Natural Sciences and Engineering Research Council (NSERC; W Pollard). Additional student support to M Ward Jones was provided by the Fonds de Recherche du Quebec—Nature et Technologies (FRQNT) doctoral scholarship, David Erb Fellowship, Eben Hopson Fellowship and by the Northern Scientific Training Program (NSTP). The authors thank Jared Simpson, Dale Andersen, Michael Templeton, Cameron Roy and Fanny Amyot for their assistance in the field. We thank the 2 anonymous reviewers for their comments to improve this manuscript. M Ward Jones would like to dedicate this paper to her father, Danny Ward. Discussing the initial submission of this paper was the last conversation we had before he passed away suddenly and unexpectedly. Rest in peace and love you dad.