

Abstract
Arctic societies, like Arctic environments, exhibit variability and rapid change. Social and environmental changes are sometimes interconnected, but Arctic societies also are buffeted by socioeconomic forces which can create problems or drive changes that eclipse those with environmental roots. Social indicators research offers a general approach for describing change and understanding causality through the use of numerical indices of population, health, education, and other key dimensions that can be compared across places and times. Here we illustrate such work with new analyses of demographic indicators, particularly involving migration, for contemporary communities of three predominantly Inuit Arctic regions: northern Alaska, Greenland, and Nunavut. Many places exhibit persistent outmigration, affecting population growth. Net migration and growth rates are not significantly different, however, comparing northern Alaska communities that are or are not threatened by climate-linked erosion. Stepping back to compare the three regions highlights their contrasting birth rates (high in northern Alaska and Nunavut) and outmigration (high in Alaska and Greenland)—yielding divergent population trajectories of gradual decline in Greenland, erratic but slow growth in Alaska, and rapid growth in Nunavut. Evidence for one consequential pattern observed in northern Alaska and Greenland, disproportionate outmigration by locally-born women, appears weak or absent in Nunavut.
Export citation and abstract BibTeX RIS
1. Introduction
Arctic societies, like Arctic environments, display wide variability and often rapid change. Arctic social and environmental changes are sometimes interconnected, as when industrial development affects ecosystems, or warming climate impacts livelihoods and infrastructure of Arctic residents. Arctic societies also are buffeted by socioeconomic forces, however, which can create problems or drive changes that overlap with or eclipse those from environmental roots. To describe and understand the multidimensional patterns of Arctic change, social scientists often conduct in-depth qualitative studies focused on particular places. Social indicators research complements case studies by offering a shallower but much wider perspective, employing numerical indices of population, health, education, and other key dimensions to draw comparisons across many places, and track change over time. In this paper we illustrate Arctic social indicators work with new analyses of community-level demographics, and particularly the effects of migration, across three predominantly Inuit Arctic regions: northern Alaska, Greenland, and Nunavut.
Population is a basic human dimension that interacts with environmental conditions. Connections between population and environment have long been salient in the circumpolar North, where isolated settlements depend on variable resources. Archeological studies find many examples linking ancient environment, resources, and population (e.g. Finkelstein et al 2009, Hartman et al 2017). More recently, twentieth-century crises in northern Atlantic fisheries, precipitated by ocean/climate variations atop overfishing, spurred outmigration from fishing communities of Newfoundland, Greenland, Iceland, and the Faroe Islands (Hamilton and Haedrich 1999, Hamilton 2007). Over the past decade the term climigration, or climate-induced outmigration, came into currency. It was coined by Alaska human rights lawyer Bronen (2009) to describe Alaska villages where climate-linked erosion will likely force abandonment, with indigenous populations relocated or dispersed. Residents of these communities see government-sponsored relocation to alternative nearby sites, maintaining their social connections and subsistence activities, as a much better outcome than dispersal (Bronin and Chapin 2013, Marino 2015). While relocation decisions are postponed, however, and flooding risks increase, the flows of individual and family migration from these places bear watching. Also worth watching are the migration flows of other Arctic places experiencing resource or environmental change, alongside the push and pull of socioeconomic forces at community to society-wide scales.
Changes in Arctic environments are tracked through physical and biological indicators described elsewhere in this special issue of Environmental Research Letters. Changes within individual Arctic societies are documented in qualitative research, but they also can be tracked or compared quantitatively across times or places, parallel to biophysical observations, using Arctic social indicators (Larsen et al 2010, 2015, Kruse et al 2011). Rasmussen et al (2015) apply the Larsen et al (2010) indicator recommendations to the West-Nordic islands (Greenland, Iceland, and the Faroes); Hamilton and Lammers (2011) propose mapping administrative units as combinations of grid cells for integration of social indicators with physical data. The social indicators considered in these reviews, drawn from domains including demographics, health, education, and culture, of course do not fully characterize any society, but they extend for Arctic relevance methods used to track and compare human development in other parts of the world (Einarsson et al 2004, Larsen and Fondahl 2015).
The most accessible and consistently defined social indicators involve demographics, such as total population, births, deaths, migration, and age or sex ratios. Pan-Arctic demographic comparisons are necessarily broad (Heleniak and Bogoyavlensky 2015); more detailed but limited pictures emerge when the scope narrows to community variations or temporal changes within single regions such as Greenland (Hamilton and Rasmussen 2010) or Arctic Alaska (Hamilton and Mitiguy 2009). In this paper we take an intermediate path, starting from the community-level demographics of single-region studies, but stepping back to compare community-level patterns across three distinct and predominantly Inuit Arctic regions: Greenland, northern Alaska, and the Canadian territory of Nunavut. Illustrating the importance community-level indicators for integration with biophysical data, the first section compares recent population changes of erosion-threatened and non-threatened communities in northern Alaska. Next, we widen the scope to compare patterns of municipality or community population change in Greenland, northern Alaska, and Nunavut, which reveal striking differences in outcome and components. One aspect of population change that has been documented for Greenland and Alaska (but not for Nunavut) is 'female flight' or disproportionate outmigration of locally-born women, resulting in a numerical excess of men in smaller communities. This phenomenon has broad consequences for life in both source and destination communities, and it too shows regional contrasts.
2. Data and methods
Demographic statistics from government agencies provide the raw data for these analyses, which were brought together and recalculated as indicators under the Sustainable Futures North project (SFN 2018). For northern Alaska, annual community population estimates come from the ADL (Alaska Department of Labor and Workforce Development) (2018); counts of births and deaths originate with the Alaska Bureau of Vital Statistics (correspondence). We combine data from these two sources to estimate annual net migration for each community, using methods and graphical conventions originally described by Hamilton and Mitiguy (2009, also see Hamilton et al 2012, 2016). Community sex ratios were calculated from 2010 US. Census results (ACS American Community Survey 2014). The 35 northern Alaska communities analyzed here are those comprising the North Slope Borough, Northwest Arctic Borough, and Nome Census Area.
Statistics Greenland (2018) provides straightforward access to information through its StatBank online statistical database. In this paper we refer to 17 Greenland municipalities, which existed administratively from the late 1970s until a structural reform in 2008–2009 combined them into four larger municipalities. Regional data corresponding to the earlier 17 municipalities are still updated by Statistics Greenland, and provide finer-scale information that is closer in spirit to our community-level Alaska and Nunavut data—although Greenland municipalities may contain multiple communities.
Wirsing (2017) gives definitions and sources for the Nunavut data, principally supplied by the NBS (Nunavut Bureau of Statistics) (2018). Access to community-level data from Canada is severely restricted compared with Alaska or Greenland, so Nunavut panels in figures 6 and 7 depict medians of the territory's three census divisions (Kitikmeot, Keewatin, and Baffin) rather than individual communities, and the Nunavut panel in figure 9 shows community data but employs sex ratios for their entire 15–64 year old populations. Canadian Inuit populations outside of Nunavut, in the Northwest Territories, Quebec or Labrador, are not covered in this paper but would broaden the comparisons and could be included with future research.
Social indicators for Arctic communities present statistical challenges in the form of outliers and skewed distributions. Where appropriate, our analysis employs outlier-resistant methods that do not assume normality, such as medians and quantile regression (figures 4–7) or robust regression (figure 9). Descriptions of such methods and the software used are given by Hamilton (2013).
3. Results
3.1. Testing for impacts of climate change
In Fierce Climate, Sacred Ground (Marino 2015), anthropologist Elizabeth Marino describes the predicament of Shishmaref, a predominantly Iñupiaq (Alaska Inuit) village on Sarichef Island off the northwest coast of Alaska (figure 1). This location provides good access to marine mammals and other resources that sustained life there for centuries, with mobility as needed for varying conditions. Sedentarization was imposed by 20th century government construction of a school and other infrastructure, at a location that has since proven ill suited for permanent settlement in a warming Arctic. Permafrost thaw is weakening the sandy ground on which the village is built; shorter sea ice seasons reduce shoreline protection from storms. Photographs of Shishmaref houses falling from eroded bluffs into the sea have become iconic representations for the human impacts of climate change. The US Army Corps of Engineers advises that relocation will be needed within the next ten years (USACE 2009).

Figure 1. Location of Shishmaref (upper left) and selected other Arctic Alaska communities. Northern Alaska communities analyzed here are those of the North Slope and Northwest Arctic Boroughs, and the Nome Census Area. Map from Hamilton and Mitiguy (2009).
Download figure:
Standard image High-resolution imageMarino emphasizes the need for government initiatives to relocate displaced villagers, preferably establishing new communities on safer ground nearby. For Shishmaref and most other Alaska communities facing threats from erosion, relocation is not happening yet. Meanwhile, investment in new infrastructure such as housing has stalled. Given the uncertain future and difficult conditions, are some people departing on their own? Figure 2 tracks annual population, births, deaths, and estimated net migration from Shishmaref over 1990–2017. Shishmaref births much exceed deaths, but natural increase (births minus deaths) has been variably offset by net migration (arrivals minus departures). An earlier analysis of data through 2014 detected no recent upsurge (Hamilton et al 2016). The newer data in figure 2 suggest outmigration spikes in 2015 and 2017; additional years of data are needed to judge whether these are random fluctuations, or presage a new trend.

Figure 2. Population dynamics for Shishmaref, Alaska, 1990–2017. Gray bars show number of births and deaths; vertical lines depict net migration.
Download figure:
Standard image High-resolution imageGraphical conventions and data sources of figure 2 follow those of earlier papers, which used shorter time series (Hamilton and Mitiguy 2009, Hamilton et al 2012, 2016). The main curve traces mid-year annual population of Shishmaref. Counts of births and deaths during each fiscal-year period (1 July–30 June) are given by light or dark gray bars at the bottom; these have a different zero point than population estimates, but the same vertical scaling. Vertical line segments above and below the population curve, also with the same scaling, indicate net migration, estimated as the difference between this year's population, and last year's population plus births minus deaths. When the line segments start above the population curve, net migration was negative (more outmigration than in). Line segments starting below the curve denote positive net migration.
To distinguish signal from noise we need more data. Without waiting many years, additional data could come from comparisons across other northern Alaska communities that are socially similar, but do or do not face similar environmental problems. In their survey encompassing hundreds of communities throughout Alaska, the US Army Corps of Engineers (USACE 2009) characterized 26 places (including Shishmaref) as needing 'priority action' to deal with erosion-related threats. Figure 3 graphs 1990–2017 population dynamics for the nine 'priority action' communities that are located in northern Alaska. Although growth in most of these communities leveled off in recent years due to outmigration, so did growth of many non-threatened communities.

Figure 3. Population dynamics 1990–2017 for nine erosion-threatened (USACE 'priority action') communities in northern Alaska.
Download figure:
Standard image High-resolution imageFigure 4 compares the distributions of net migration or population growth rates over 2001–2017 for threatened (n = 9) or non-threatened (n = 26) northern Alaska communities. Box plots depict the medians, interquartile ranges, and tails of each distribution. For both net migration and population growth rates, the medians of threatened and non-threatened groups are not significantly different, as tested by quantile regression (Hamilton 2013). Further tests (not shown) similarly find no significant difference if we restrict analysis just to more recent years 2010–2017.

Figure 4. Net migration and population growth rates 2001–2017, comparing erosion-threatened (USACE 'priority action') and other northern Alaska communities.
Download figure:
Standard image High-resolution imageStatistical analyses such as figure 4, combined with place-specific time plots such as figures 2 and 3, illustrate an approach that could be widely applied to quantify social impacts of environmental conditions, and distinguish these from impacts of non-environmental forces. In the time plots, we observe details of when changes occur and whether they persist. Statistical tests evaluate the evidence that differences are systematic. For both, we need indicator time series covering many individual communities.
3.2. Regional contrasts
Figure 4 finds no systematic differences in net migration or population change rates of threatened and non-threatened communities in northern Alaska. Looking beyond Alaska, we see greater differences across regions, as illustrated in figure 5. These box plots graph distributions of annual population growth rates among 17 Greenland municipalities, 35 northern Alaska communities, and 25 Nunavut communities. Although the indigenous populations of these Inuit Arctic regions are culturally and linguistically related, descendants of the common Thule expansion (roughly 11th–13th centuries C.E.), under different government systems their modern demographics diverge. Over the years since 2001 most Greenland municipalities lost population, with the notable exception of the capital region, Nuuk. Ilulissat and Sisimiut also posted small gains. The median loss among Greenland municipalities is about one percent per year. Northern Alaska communities grew slowly (the median gain is about half of one percent per year) over this period; for most of them, natural increase slightly exceeded net migration. Median growth rates among Nunavut communities, on the other hand, are three to four times faster—roughly 2% yr−1.

Figure 5. Average annual population growth rates of 17 municipalities in Greenland (2001–2017), 35 communities in northern Alaska (2001–2017), and 25 communities in Nunavut (2001–2016). Outliers (communities more than 1.5 times the interquartile range beyond the first or third quartiles) are plotted individually.
Download figure:
Standard image High-resolution imageThe demographic components of population change are births, deaths, and migration, which exhibit strong regional patterns. Figure 6 breaks down median birth and death rates in recent years for Greenland municipalities, northern Alaska communities, and Nunavut's three census divisions (yearly community-level birth and death statistics being unavailable for Nunavut). Birth rates are comparatively low in Greenland, and death rates higher mainly because the population is older. Given the narrowing gap between births and deaths, the scale of natural increase is relatively subdued in Greenland. That contrasts with both northern Alaska and Nunavut, where births far exceed deaths, making natural increase potentially three or four times greater than in Greenland.

Figure 6. Median annual birth and death rates for 17 Greenland municipalities, 35 northern Alaska communities, and three Nunavut census divisions.
Download figure:
Standard image High-resolution imageFigure 7 depicts net migration, the other term in a population change equation. Median net migration rates of Greenland municipalities are negative in all the years graphed, and in some years about double the natural increase, explaining why populations often decline. Median net migration rates from northern Alaska also are negative in most years, and proportionately much greater than from Greenland. But in northern Alaska net migration is demographically opposed by high rates of natural increase, so that population itself can still grow or be erratically stable. Nunavut stands out as most different from other regions in this graphic, with net migration most years fluctuating around zero. Low net migration, combined with high natural increase, explains the rapid population growth of Nunavut.

Figure 7. Net migration rates for 17 Greenland municipalities, 35 northern Alaska communities, and three Nunavut census divisions.
Download figure:
Standard image High-resolution imageOne important discovery in figure 7 is something it does not show: any spike or increase in net migration following the oil price increase and global recession of 2008, contrary to expectations voiced by Arctic observers at the time. Earlier studies of northern Atlantic fishing communities in the 20th century found net migration to be a sensitive indicator for economic distress (Hamilton et al 2004a, 2004b), so this seemed a plausible hypothesis regarding Arctic communities following the 2008 economic shocks as well. The graph shows no post-2008 migration spikes from any of the three regions, however. In northern Alaska and to some extent Greenland, net migration actually was lower for several years after 2008. Possibly this reflects a weakening of 'pull' factors owing to reduced opportunities elsewhere. Within Arctic communities, other factors may help to buffer the impacts of external economic events (Huntington et al 2018).
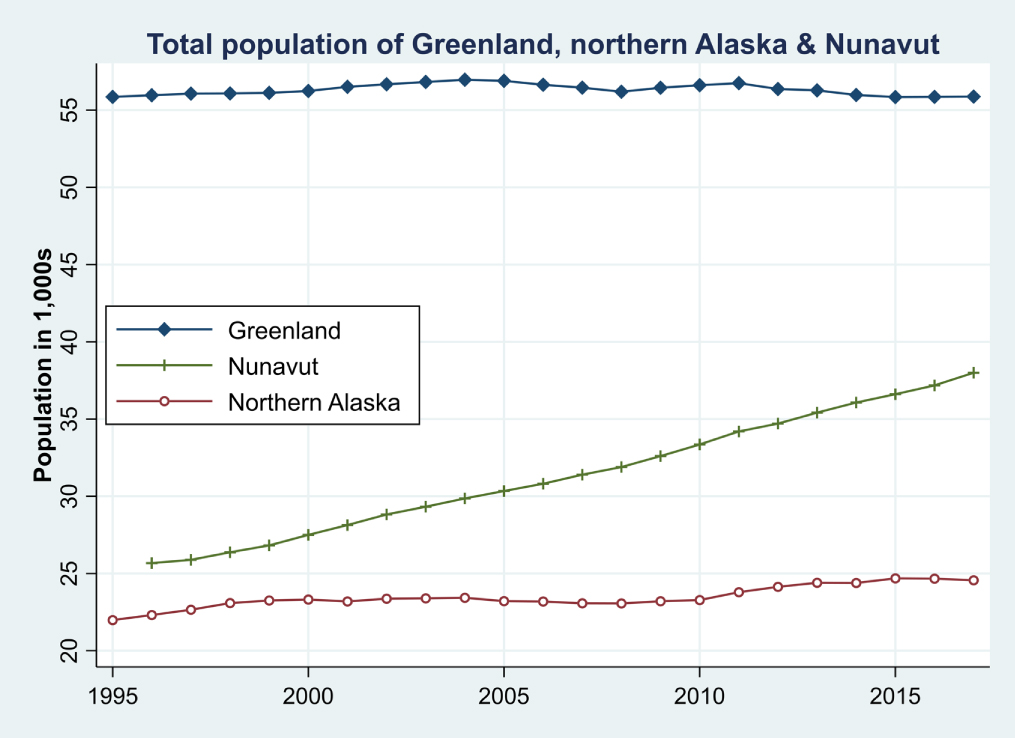
Regional consequences of these different components are summarized by total population curves in figure 8. From 2001 to 2017, Greenland's population declined by about 600 people (from 56.5 to 55.9 thousand). Although most municipalities experienced a greater decline, their loss was partly balanced by gains in Nuuk. Over the same period, the population of northern Alaska grew by about 1400 people (from 23.2 to 24.6 thousand), but with a small decline in the last few years. Nunavut displays a much different pattern: growth by almost 10 thousand people (from 28 to 38 thousand) over 2001–2017. Need for housing, jobs, education, health, and other services to maintain or improve living conditions in Nunavut could be assumed to grow at least proportionately, as well.

Figure 8. Total population of Greenland, northern Alaska and Nunavut over 1995 or 1996 to 2017.
Download figure:
Standard image High-resolution image3.3. Impacts on sex ratios
Rural outmigration is commonly selective, involving younger, mobile adults and families with above-average aspirations and skills. Their departure reduces human and social capital of the places left behind. Outmigration from Arctic communities often has a gender dimension as well, appealing disproportionately to women who seek better education, job, or life prospects elsewhere (Williamson et al 2004). Evidence of 'female flight' by Native women from rural Alaska was first noticed on surveys in the early 1990s (Hamilton and Seyfrit 1993, 1994a). This gendered migration flow can be tracked directly in some places where detailed data exist (Huskey et al 2004), but more broadly it leaves footprints in the form of unbalanced sex ratios among locally-born populations of small places (Hamilton and Seyfrit 1994b, Martin 2009, Hamilton 2010). Life table calculations make the excess of men all the more striking, because higher male mortality rates would otherwise be producing an excess of women (Hamilton and Seyfrit 1994b).
Negative correlations between sex ratio and community size, or a regional excess of males, have been observed around the circumpolar North in Newfoundland, Greenland, Iceland, the Faroe Islands, northern Scandinavia, and Russia (Hamilton and Otterstad 1998, Hamilton 2010, Rasmussen 2011). There often is disproportionate in-migration by outsider men affecting the sex ratios of Northern places as well, but available statistics sometimes allow focus on populations who are mostly local born, such as Natives in Alaska, or Greenland-born residents of Greenland. Registry statistics are detailed enough to roughly balance the departure of Greenland-born women from Greenland with their arrival in Denmark (Hamilton and Rasmussen 2010). Reports of female outmigration from other places such as rural East Germany (Leibert 2015) demonstrate that this phenomena can occur elsewhere in contexts of rapid social change. It has broad consequences including family formation, social problems, and for indigenous communities, cultural continuity (Hamilton and Seyfrit 1994b).
Both push and pull factors affect female outmigration. The pull factors include education and job opportunities elsewhere, which appeal differently to men and women. Employment and role opportunities for women tend to be broader in large communities than in small ones; conversely, men may find rural activities (such as hunting and fishing) more attractive. Push factors include the social problems of small communities, which may fall heavily on women. Surveys conducted among high school students of 19 Arctic Alaska communities in the 1990s found majorities, including more girls than boys, expecting to migrate permanently away (Seyfrit et al 1998). Actual long-term migration rates were lower than adolescents expected, in part reflecting many people who left temporarily, then came home.
Although female flight from smaller communities has been well documented in Arctic Alaska and Greenland, a recent study of two Nunavut communities reported no evidence for it happening there (Dowsley and Southcott 2017). Figure 9 broadens this comparison by drawing 'footprint' graphs of sex ratios against log community size for 17 Greenland municipalities, 24 Nunavut communities, and 34 northern Alaska communities. The Greenland and Alaska sex ratios are calculated for Greenland-born or Alaska Natives only, which should reduce statistical impacts from outsider adults (often male, and including more non-Greenlanders or non-Natives) moving in. We also focus on 20–39 year olds, a mobile age group (although skewed sex ratios can be seen among older cohorts as well). Due to Canadian data restrictions, our Nunavut figures are less specific. These are calculated for all 15–64 year olds, regardless of ethnicity or origin. Consequently, the sex ratios shown for Nunavut, to an unknown degree, combine any effects from local women moving away with outsider men moving in. Moreover these Nunavut data, unlike the Greenland and Alaska data, are not restricted to a young-adult age group.

Figure 9. Sex ratios among Greenland-born 20–39 year olds in 17 municipalities (2010–2017); Alaska Natives 20–39 in 34 northern Alaska communities (2010 census); total population 15–64 in 24 Nunavut communities (2016 census), with robust regression lines. Note logarithmically scaled x axes.
Download figure:
Standard image High-resolution image
Indicator data on demographic subgroups within small communities can vary widely, and their distributions often contain outliers. In the case of figure 9, one small Alaska community, Wales in the Nome Census Area (population 145), had an exceptionally high sex ratio among young-adult Natives, so it is set aside here as an outlier—hence reducing the Alaska sample from 35 places (in figures 4–8) to 34 (figure 9). All three panels in figure 9 show robust regression lines, an outlier-resistant technique that does not assume normality (Hamilton 2013). Given the high variance and small samples, only the Alaska line is statistically significant (p < 0.05). All have negative slopes, however, as seen in data from many other northern regions as well (Hamilton 2010).
Regional administrative centers, with larger populations, appear at right in each panel of figure 8. Such places offer more employment and education opportunities for women. Consequently, they often exhibit sex ratios that are closer to even, if not an excess of women. A 'stepping stone' pattern of outmigration in rural Alaska has been shown from small villages to rural centers, and (not necessarily the same people) from the centers to more distant cities (Howe 2009, Howe et al 2014). Analogous stepping stones for Greenlanders involve migration from smaller municipalities to Nuuk, and from Nuuk to Denmark (Hamilton and Rasmussen 2010). In both regions, the movers include more locally-born women than men.
A negative slope relating sex ratio to log population occurs among Nunavut communities also, which could be consistent with a weak pattern of female flight. But the Nunavut data are much less detailed than for Alaska or Greenland, so other interpretations cannot be ruled out. These limitations give us little evidence at this point to reject Dowsley and Southcott's (2017) case-study conclusion that female flight is not a substantial issue for Nunavut. Their conclusion also fits with the general lack of net migration from Nunavut, in contrast with Alaska and Greenland, seen earlier in figure 7.
Net migration is an important social indicator, but ambiguous in meaning because it can reflect either good or bad conditions—people are free and able to leave for opportunities elsewhere, or they are fleeing unfavorable circumstances at home, or some combination of both (Hamilton et al 2010). This ambiguity applies to gendered as well as gender-neutral migration. The reasons that female migration from Nunavut is muted or absent compared with other Inuit Arctic regions are probably the same reasons migration in general is muted: some combination of weaker push factors (if Nunavut communities have fewer problems or more attractions for their residents, compared with Alaska or Greenland) and weaker pull factors (if outside opportunities appear less accessible to Nunavut residents). These are topics that future research could address.
4. Discussion
Social indicators collected for many individual Arctic communities, supporting comparisons across times and places, hold promise for studying the complex causality of Arctic social change. Although Arctic environments exhibit high variability, we know that impacts from past environmental changes often have been contingent on details of social organization (Hartman et al 2017). Figures 1–3 illustrated a contemporary analytical approach using community-level data to test for migration impacts from climate-linked problems. The general approach could be adapted for other research questions that involve detecting environmental impacts, and distinguishing them from mainly social factors.
Distinguishing among multiple causes matters because environmental effects on Arctic communities overlap with, and could be overshadowed by, strong effects from socioeconomic and policy factors. Community and regional variations reflecting socioeconomic forces must be clearly in view to avoid spurious conclusions, even when researcher interests focus on biophysical factors. Conversely, social-science researchers testing for possible impacts from policy shifts or economic events need the capability to distinguish these from background trends and environmental changes, as noted informally with figure 7. The study of community-level Arctic social indicators thus supplies information useful for several kinds of integrated research.
Following the northern Alaska examples, we made a broader, exploratory comparison of community-level indicators across three Arctic regions. The results highlight basic differences between Greenland, northern Alaska, and Nunavut. Among Greenland municipalities, declining rates of natural increase reflect the narrowing gap between death and birth rates (largely due to the birth rates' decline). Net migration more than offsets this, so most municipalities' populations are shrinking. Northern Alaska rates of births and natural increase are much higher, but there too are largely offset by net migration so growth is relatively slow. Nunavut exhibits high birth rates like Alaska but much less net migration, and stands apart with the resulting rapid growth. One corollary of low net migration from Nunavut seems to be that, in the available data, we have little evidence of the female outmigration and skewed sex ratios that occur in northern Alaska and Greenland.
Our analysis does not try to explain these patterns, leaving that substantial undertaking as projects for future research. The trends, variations, and regional differences observed form key parts of the background needed for substantive research on other topics as well.
5. Conclusions
Looking first at towns and villages of northern Alaska, we observe no evidence (yet) of enhanced outmigration from the places most threatened by climate-linked erosion. Nor is there evidence of increased outmigration following the economic shocks of 2008, contrary to expectations of some observers at the time. Stepping back to draw international comparisons among three predominantly Inuit regions uncovers striking contrasts in births (high in northern Alaska and Nunavut) and outmigration (high in northern Alaska and Greenland), resulting in different population trajectories—slightly declining in Greenland, erratic but growing slowly in northern Alaska, and growing rapidly in Nunavut. Evidence for one pattern previously documented for northern Alaska and Greenland, disproportionate outmigration by locally-born women producing skewed sex ratios in smaller communities, appears weak or absent in Nunavut. These observed regional differences raise interpretive questions that call for further research. They also comprise important background needed to study possible impacts from environmental or policy shifts, and to inform broader discussions of sustainability among Arctic communities.
Acknowledgments
Research conducted for the Sustainable Futures North project has been supported by a grant from the Office of Polar Programs at the US. National Science Foundation (PLR-1263650). Any opinions, findings, and conclusions or recommendations expressed in this paper are those of the authors and do not necessarily reflect the views of supporting organizations.