

Abstract
A teleconnection between the North Atlantic Ocean and the Eurasian continent is suggested by statistical and dynamical analysis of the northern summer 500 hPa geopotential height field. This teleconnection, termed the Atlantic–Eurasian (AEA) teleconnection, has five centers of action, in the subtropical North Atlantic Ocean, northeastern North Atlantic Ocean, Eastern Europe, the Kara Sea, and north China. The AEA index (AEAI) shows that the AEA undergoes a high degree of variability from year to year, and the AEAI has an increasing trend over the last 30 years. Our results suggest that this phenomenon is a large-scale Rossby wave train that originates in the subtropical North Atlantic Ocean. We support this conclusion by the methods of stationary wave ray tracing in non-uniform horizontal basic flow, wave activity flux calculations, and numerical models. The AEA and midlatitude circumglobal teleconnection pattern manifest distinct features at the hemispheric scale, despite the anomalies associated with them bear some similarities in the northeastern North Atlantic and Eastern Europe. Regional climate variations are strongly linked to this AEA along its path through northern Eurasia.
Export citation and abstract BibTeX RIS

Original content from this work may be used under the terms of the Creative Commons Attribution 3.0 licence.
Any further distribution of this work must maintain attribution to the author(s) and the title of the work, journal citation and DOI.
1. Introduction
The North Atlantic Ocean is a major source of Northern Hemisphere climatic variability (Marshall et al 2001, Hurrell et al 2002). Fluctuating conditions in both the atmosphere and the ocean in the North Atlantic region have strong climatic effects on surrounding regions, and are also a major source of predictability for climate variability in downstream regions of Eurasia (Hurrell 1995, Benner 1999, Marshall et al 2001, Li and Wang 2003b, Ding et al 2005, Scaife et al 2014, Sun et al 2015, Li 2016, Scaife 2016, Sun et al 2017). The North Atlantic exerts its climate forcing on remote regions largely through the North Atlantic Oscillation (NAO), which is the leading mode of North Atlantic atmospheric variability in the boreal winter (Walker and Bliss 1932, Bjerknes 1964, Wallace and Gutzler 1981, Li and Wang 2003b, Li et al 2013). Many studies have explored the impacts of the winter NAO on temperature and precipitation anomalies in Eurasia and North America (Peng and Mysak 1993, Livingstone 1999, Branstator 2002, Watanabe 2004, Scaife et al 2008, Sung et al 2010, Xu et al 2012, Filippi 2014, Scaife 2016, Yu et al 2016, Ding et al 2017). In boreal summer, although the NAO is located further north and extends over a smaller area than its winter counterpart (Portis et al 2001, Li and Wang 2003b), the teleconnection between the North Atlantic Ocean and Eurasia in the boreal summer is worthy of study.
In fact, the summer NAO (SNAO) can directly exert strong influences on the summer surface climate not only in the northern Europe (Folland et al 2009), but also in the Mediterranean region (Bladé et al 2012). Bladé et al (2012) revealed that the imprint of the SNAO on summer rainfall shows a north–south dipole pattern between northwest Europe and the Mediterranean. Besides the SNAO, there are other modes of large-scale atmospheric variability that can affect European summer climate variability. Ding et al (2005) identified a recurrent circumglobal teleconnection (CGT) pattern in the Northern Hemisphere summertime midlatitude circulation, which was proposed by Branstator (2002) for the boreal winter. Ding et al (2005) and Saeed et al (2011a, 2011b) have demonstrated that the CGT influences boreal summer regional climates by modulating the Indian summer monsoon. Using both reanalysis data and historical climate simulation of the ECHAM6/MPIOM coupled general circulation model, Saeed et al (2014) further investigated the regional impacts of the CGT for the European summer climate at interannual time scales, and demonstrated that through modulating the upper and lower level circulations the CGT is associated with an east–west dipole-like pattern of European summer precipitation, and this relationship is distinct from the SNAO–European summer precipitation relationship (Saeed et al 2014).
Wu et al (2009) and Wu et al (2012) showed that an anomalous NAO in spring can induce a tripole surface temperature anomaly (SSTA) pattern in the North Atlantic Ocean, which persists into the following summer. Zuo et al (2012) also found the similar result. The summer tripole SSTA pattern excites a downstream teleconnection in which a distinctive Rossby wave train prevails over northern Eurasia. We term this connection the North Atlantic–Eurasian (AEA) teleconnection, through which the North Atlantic Ocean can affect the climate in East Asia in summer. In this paper, we further investigate the structure of the AEA and explore its mechanism of propagation and regional climate influences.
2. Data and methods
The primary datasets used in this study are the monthly mean 500 hPa geopotential heights, 500 hPa winds, 200 hPa meridional wind, sea surface pressures (SLP), and surface air temperatures from the National Center for Environmental Prediction (NCEP) and the National Center for Atmospheric Research (NCAR) reanalysis datasets (Kalnay et al 1996). The monthly rainfall dataset is the Precipitation Reconstruction Dataset (PREC) from the National Oceanic and Atmospheric Administration (Chen et al 2002). The period of these datasets is from 1979–2013. In this paper, 'summer' is defined as June–July–August (JJA).
We employ teleconnection (Wallace and Gutzler 1981) and empirical orthogonal function (EOF) analyses to identify teleconnection patterns. We use the stationary wave ray tracing method in horizontally non-uniform basic flow to elucidate the propagation of large-scale Rossby waves (Li and Li 2012, Li et al 2015, Zhao et al 2015), where the basic flow is the climatological JJA winds at 500 hPa for 1979–2013. We also use the wave activity flux (Plumb 1985) to provide information about the large-scale wave source and sink. Finally, we run a shallow water model, SPMODEL (Hierarchical Spectral Models for Geophysical Fluid Dynamics) (Hayashi et al 2003, Takehiro et al 2006), to simulate the structure and evolution of the AEA. In the SPMODEL experiment, the basic flow is the JJA 500 hPa wind averaged from 1979–2009, and a source of disturbance is placed in the subtropical North Atlantic (30°N–40°N, 20°W–60°W). The source is centered at (35°N, 35°W), and decreases to zero at the edge. The time step interval of integration is 60 min. After 20 days of integration, the height field become stable. To show the propagation of the AEA wave, we subtract the global average height from the raw data and plot the anomalous height. The CGT index is defined as the first principal component PC1 associated with the leading first EOF (EOF1) of July–August 200 hPa mean meridional wind over the region (100°W–100°E, 20°N–80°N) (Saeed et al 2014).
3. Definition and structure of the AEA teleconnection
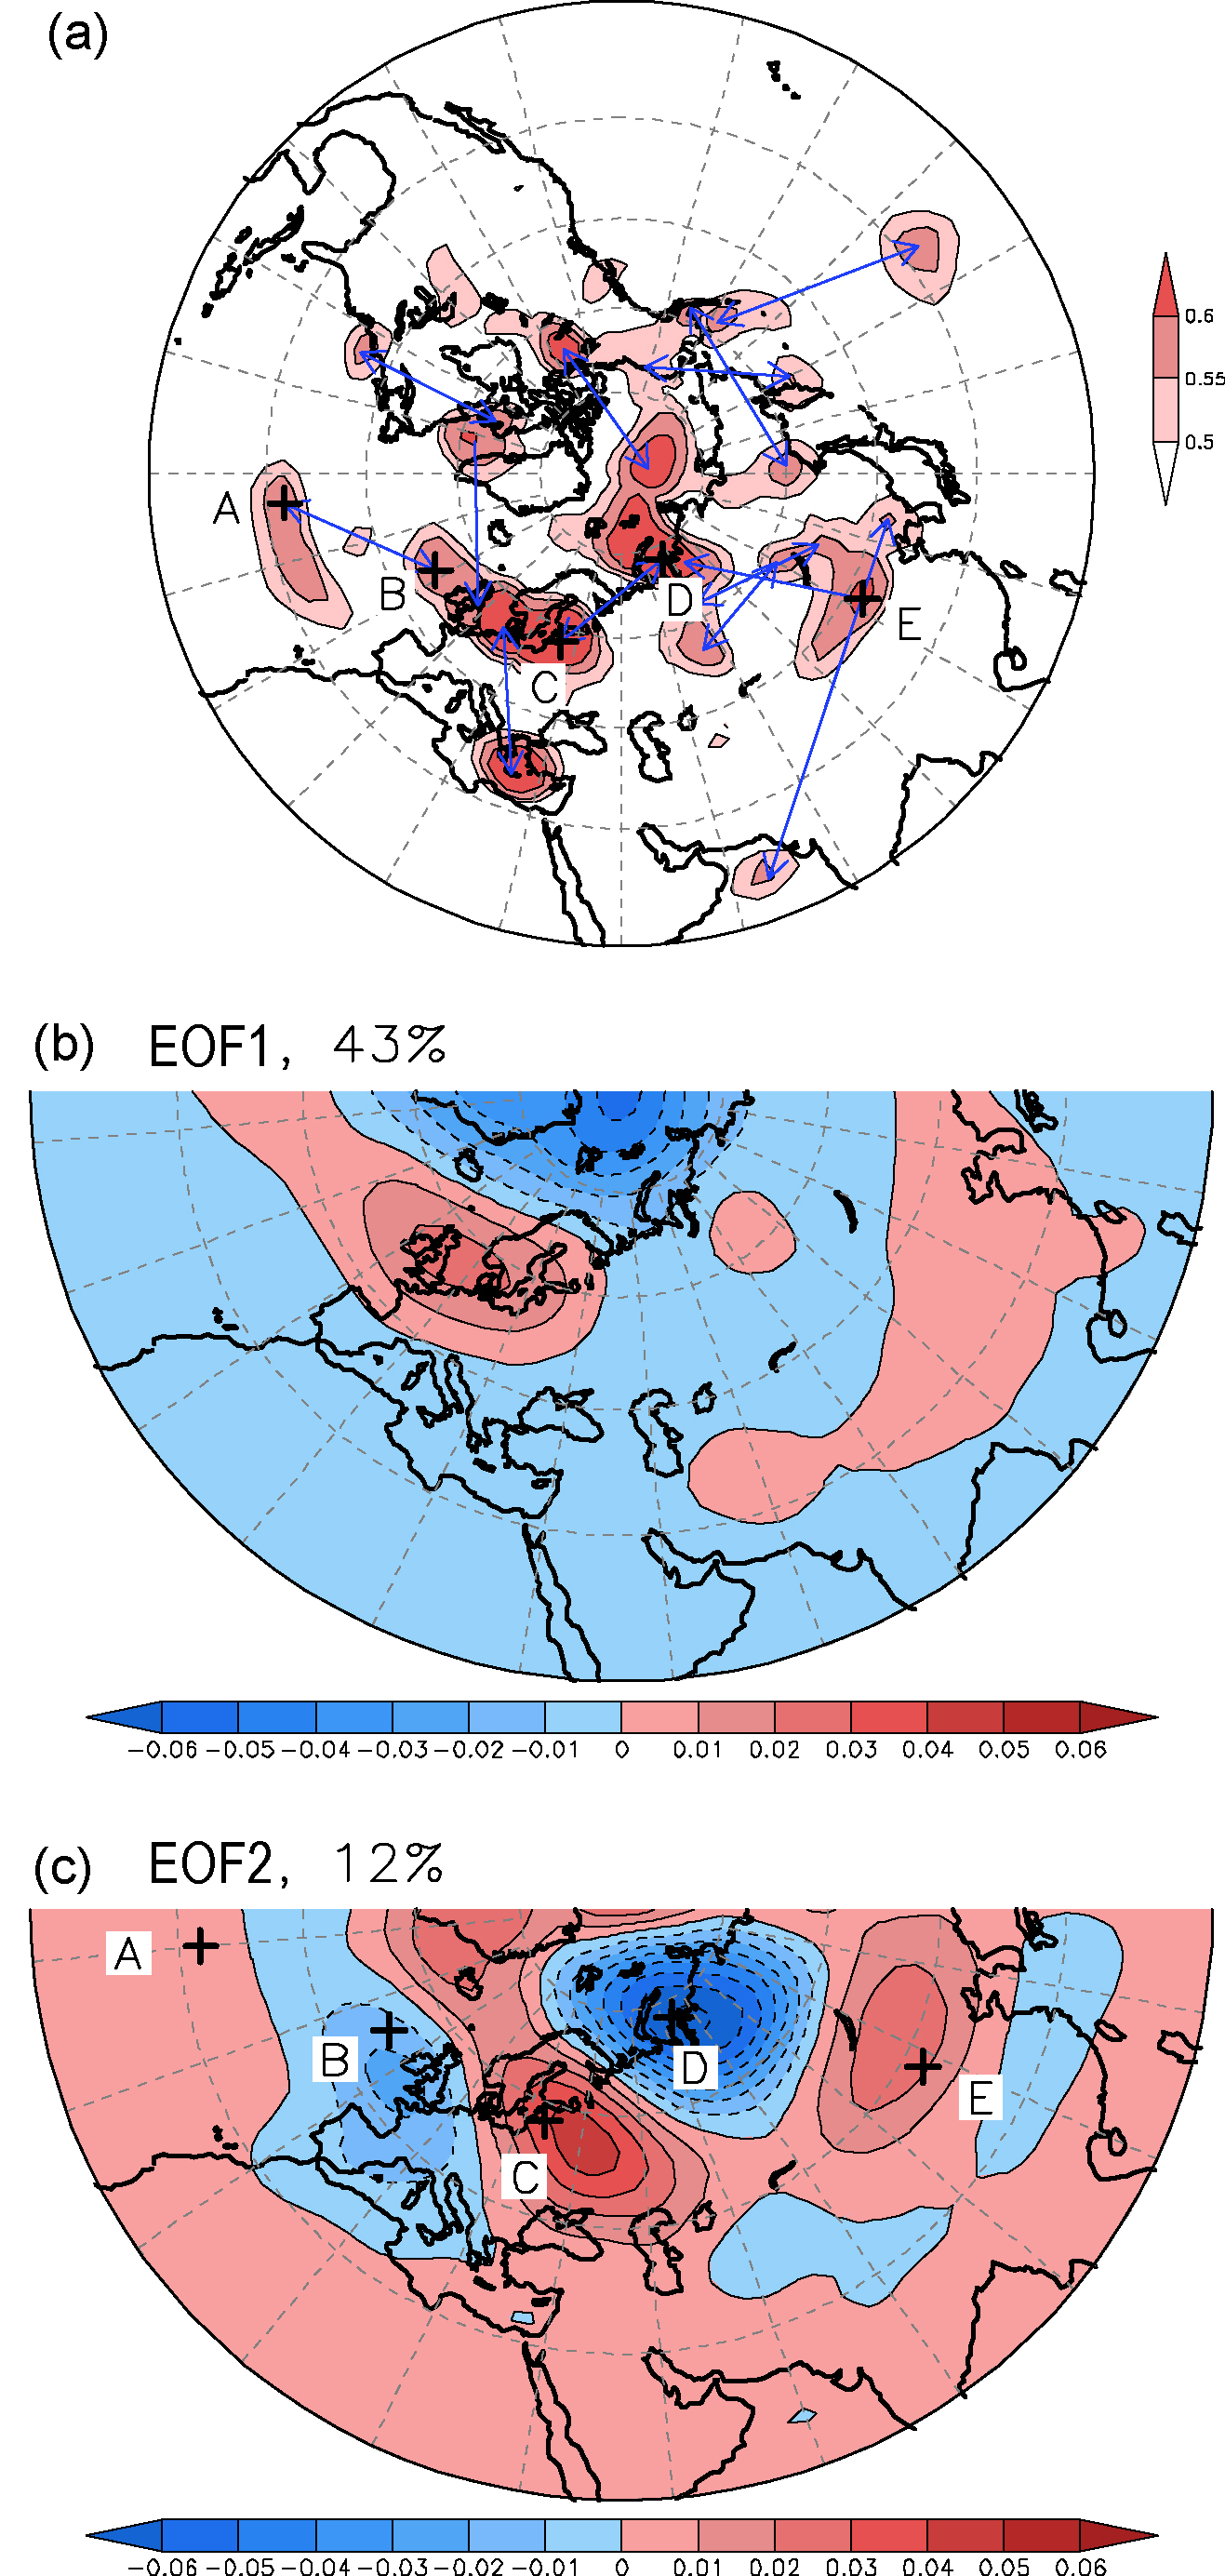
Figure 1(a) shows the map of teleconnections in the Northern Hemisphere JJA 500 hPa geopotential height field. Compared with the winter map (figure 7(b) in Wallace and Gutzler (1981)), the strong teleconnection patterns here are located mainly in North America, the North Atlantic, and Eurasia. Fewer teleconnections are located in the North Pacific Ocean, although the western Pacific and Pacific/North American patterns are usually quite strong in winter. In the northern North Atlantic Ocean, a center of action over Greenland is negatively correlated with two centers over eastern North America and the British Isles. This pattern of correlation represents the summer NAO pattern (Li and Wang 2003b, Folland et al 2009, Linderholm et al 2011). In the eastern North Atlantic, another dipole pattern is found from 30°N–55°N (see the line connecting points A (40°W, 32.5°N) and B (17.5°W, 52.5°N) in figure 1(a)), which is similar to the eastern Atlantic pattern in winter in Wallace and Gutzler (1981). In Eurasia, a tripole pattern connects three centers over eastern Baltic Sea (C(25°E, 57.5°N) in figure 1(a)), the Kara Sea (D(70°E, 72.5°N) in figure 1(a)), and north China (E(107.5°E, 42.5°N) in figure 1(a)). This tripole appears similar to the Eurasian pattern in winter in Wallace and Gutzler (1981), but the latitudes of the tripolar nodes in summer are obviously farther north than in winter, and the third center (E in figure 1(a)) is located in north China rather than in Japan. Moreover, two other dipole patterns are observed in summer but are absent in winter: the first links the eastern Mediterranean Sea and northern Europe (the ME pattern), and the second links northeast China and the Arabian Sea (the CAS pattern).
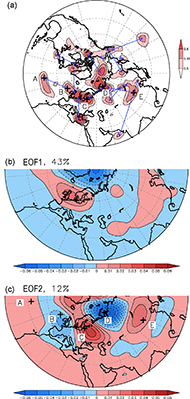
Figure 1. (a) Map of teleconnections among 500 hPa geopotential height anomalies in summer in the Northern Hemisphere, for the period 1979–2013. Arrows connect centers of the strongest teleconnections on the one-point correlation map. The crosses denote the five centers of action of the AEA pattern. (b) The EOF1 spatial distribution of 500 hPa geopotential height field in JJA over the eastern half of the Northern Hemisphere. The percentage number on the top indicates the explained variance. (c) Same as (b), but for EOF2. The five crosses are the same as those in (a).
Download figure:
Standard image High-resolution image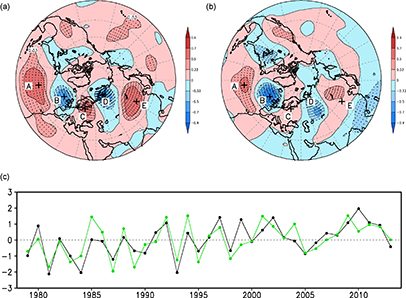
Figure 2. (a) Correlation map between the JJA AEAI and Northern Hemisphere 500 hPa geopotential height. The crosses denote the five centers of action of the AEA, and the stippled regions indicate significance at the 95% confidence level using Student's t-test. (b) Same as (a), but for the second principal component (PC2) associated with the EOF2 of 200 hPa meridional wind over (100°W–100°E, 20°N–80°N). (c) Normalized time series of the JJA AEAI (black) and the second principal component (green, the average of July and August).
Download figure:
Standard image High-resolution imageOur analysis here focuses on the dipole pattern (A–B) in the eastern North Atlantic and the tripole pattern (C–D–E) across northern Eurasia. The two teleconnection patterns in figure 1(a) seem to be separate from each other, but we investigate whether there is some essential connection between them. The teleconnection analysis is a useful tool for diagnosing teleconnections of atmospheric circulation variability; however, the method focuses mainly on oscillations with only two or three centers of action, and may neglect teleconnections with multiple centers. To make up for this weakness, and to find the connection between the North Atlantic and Eurasia, an EOF analysis is applied to the JJA 500 hPa geopotential height field over the eastern half of the Northern Hemisphere (45°W–135°E, 15°N–90°N). The first leading mode (EOF1) is the summer Arctic Oscillation (AO)/NAO pattern, which manifests one sign in the Arctic and the opposite sign in mid-latitudes, with a center over Western Europe (figure 1(b)) (Li and Wang 2003a, Folland et al 2009, Linderholm et al 2011). The second leading mode (EOF2) shows a wave-like pattern (figure 1(c)) with five centers of action, located from eastern North Atlantic to northern Eurasia, and is largely consistent with the centers of the dipole and tripole (A–B and C–D–E) teleconnections in figure 1(a). This implies a teleconnection structure bridging the North Atlantic and Northern Eurasia in summer, which we term the AEA teleconnection. The AEA index (AEAI) is defined by the geopotential height at the five points:
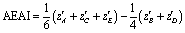
where z'P denotes 500 hPa geopotential height anomalies at the point P (P = A–E). A positive AEAI is indicative of anomalously high 500 hPa geopotential heights over the subtropical North Atlantic, Eastern Europe, and Mongolia–north China, and low geopotential heights over the northeastern North Atlantic and Kara Sea–northern Siberia; and vice versa.
On the correlation map between the summer AEAI and 500 hPa geopotential height (figure 2(a)), a wave-like pattern with five nodes is clearly located in the North Atlantic and northern Eurasia, with significant positive correlations in the subtropical North Atlantic, Eastern Europe, and Mongolia–north China, and significant negative correlations in the northeastern North Atlantic and the Kara Sea–northern Siberia. The temporal correlation coefficient between the AEAI and the second principal component (PC2) associated with the EOF2 of 500 hPa geopotential height, mentioned above, is 0.70, while the spatial correlation coefficient between the AEA teleconnection pattern (figure 2(a)) and the EOF2 (figure 1(c)) is 0.71; both are significant above the 99.9% confidence level. Thus, the AEA resembles the second leading mode of the JJA 500 hPa geopotential height field over the North Atlantic and Eurasia. The time series of the normalized summer AEAI from 1979–2013 in figure 2(c) reveals that the AEAI has significant interannual variability, with an increasing trend (the phase shifted from negative to positive AEAI around 1995).
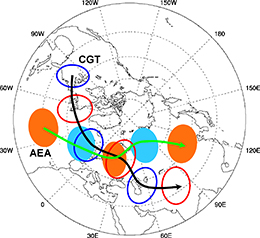
Figure 3. Schematic illustration of the CGT and AEA teleconnection patterns in summer (JJA). The six ellipses denote the six centers of action of the CGT. The shades areas denote the five centers of action of the AEA. The solid black and green curves with arrows denote the wave paths of the CGT and AEA, respectively.
Download figure:
Standard image High-resolution imageThe CGT is an important mode of Northern Hemisphere summer large-scale atmospheric variability in the midlatitudes (Ding et al 2005, Saeed et al 2011a, 2011b, Saeed et al 2014). To what extent does the AEA differ from the CGT? Figure 3 shows schematic illustration of the CGT and AEA teleconnection patterns in summer. The CGT is defined as the EOF1 of JJA Northern Hemisphere 200 hPa meridional wind anomalies (Ding et al 2005), and afterwards is extracted over the domain (20°N–80°N, 100°W–100°E) by Saeed et al (2011a). The AEA is defined as the EOF2 of JJA 500 hPa geopotential height field over the eastern half of the Northern Hemisphere (45°W–135°E, 15°N–90°N). The CGT has six centers of action from North America–North Atlantic–Eurasia region and shows an east–west mid-latitude wave pattern, whereas the AEA has five centers of action from subtropical North Atlantic–northern Eurasia and its main body spans a larger longitudinal range from subtropical to polar region. The AEA evidently looks more like a southwest–northeast pattern than an east–west wave pattern. Basically, the waves of the AEA originate in the subtropical North Atlantic Ocean (15°W–60°W, 25°N–37.5°N), while those of the CGT originate in the eastern US (70°W–90°W, 35°N–45°N). The wave pathway of the CGT is located in the midlatitudes along the westerly jet, whereas that of the AEA goes to high latitudes from the subtropical North Atlantic Ocean and propagates along the subpolar jet in the high latitudes. The correlation coefficient between the AEAI and CGTI is only 0.15, not significant. However, the correlation maps (figures 2(a) and (b)) with 500 hPa geopotential height indicate that AEA is highly related to the EOF2 of 200 hPa meridional wind, and the correlation coefficient between the AEAI and the second principal component (PC2) associated with the EOF2 of 200 hPa meridional wind is 0.75 (figure 2(c)), significant at the 99% confidence level. In addition, there are overlaps in the northeastern North Atlantic and Eastern Europe between the CGT and AEA. This implies that there are some overlaps of impacts of the CGT and AEA on summer climate in the northeastern North Atlantic and Eastern Europe (see below). Overall, the difference in the CGT and AEA is essential at the hemispheric scale, though they overlap in the northeastern North Atlantic and Eastern Europe.
4. Propagation mechanisms and the regional climatic influence of the AEA
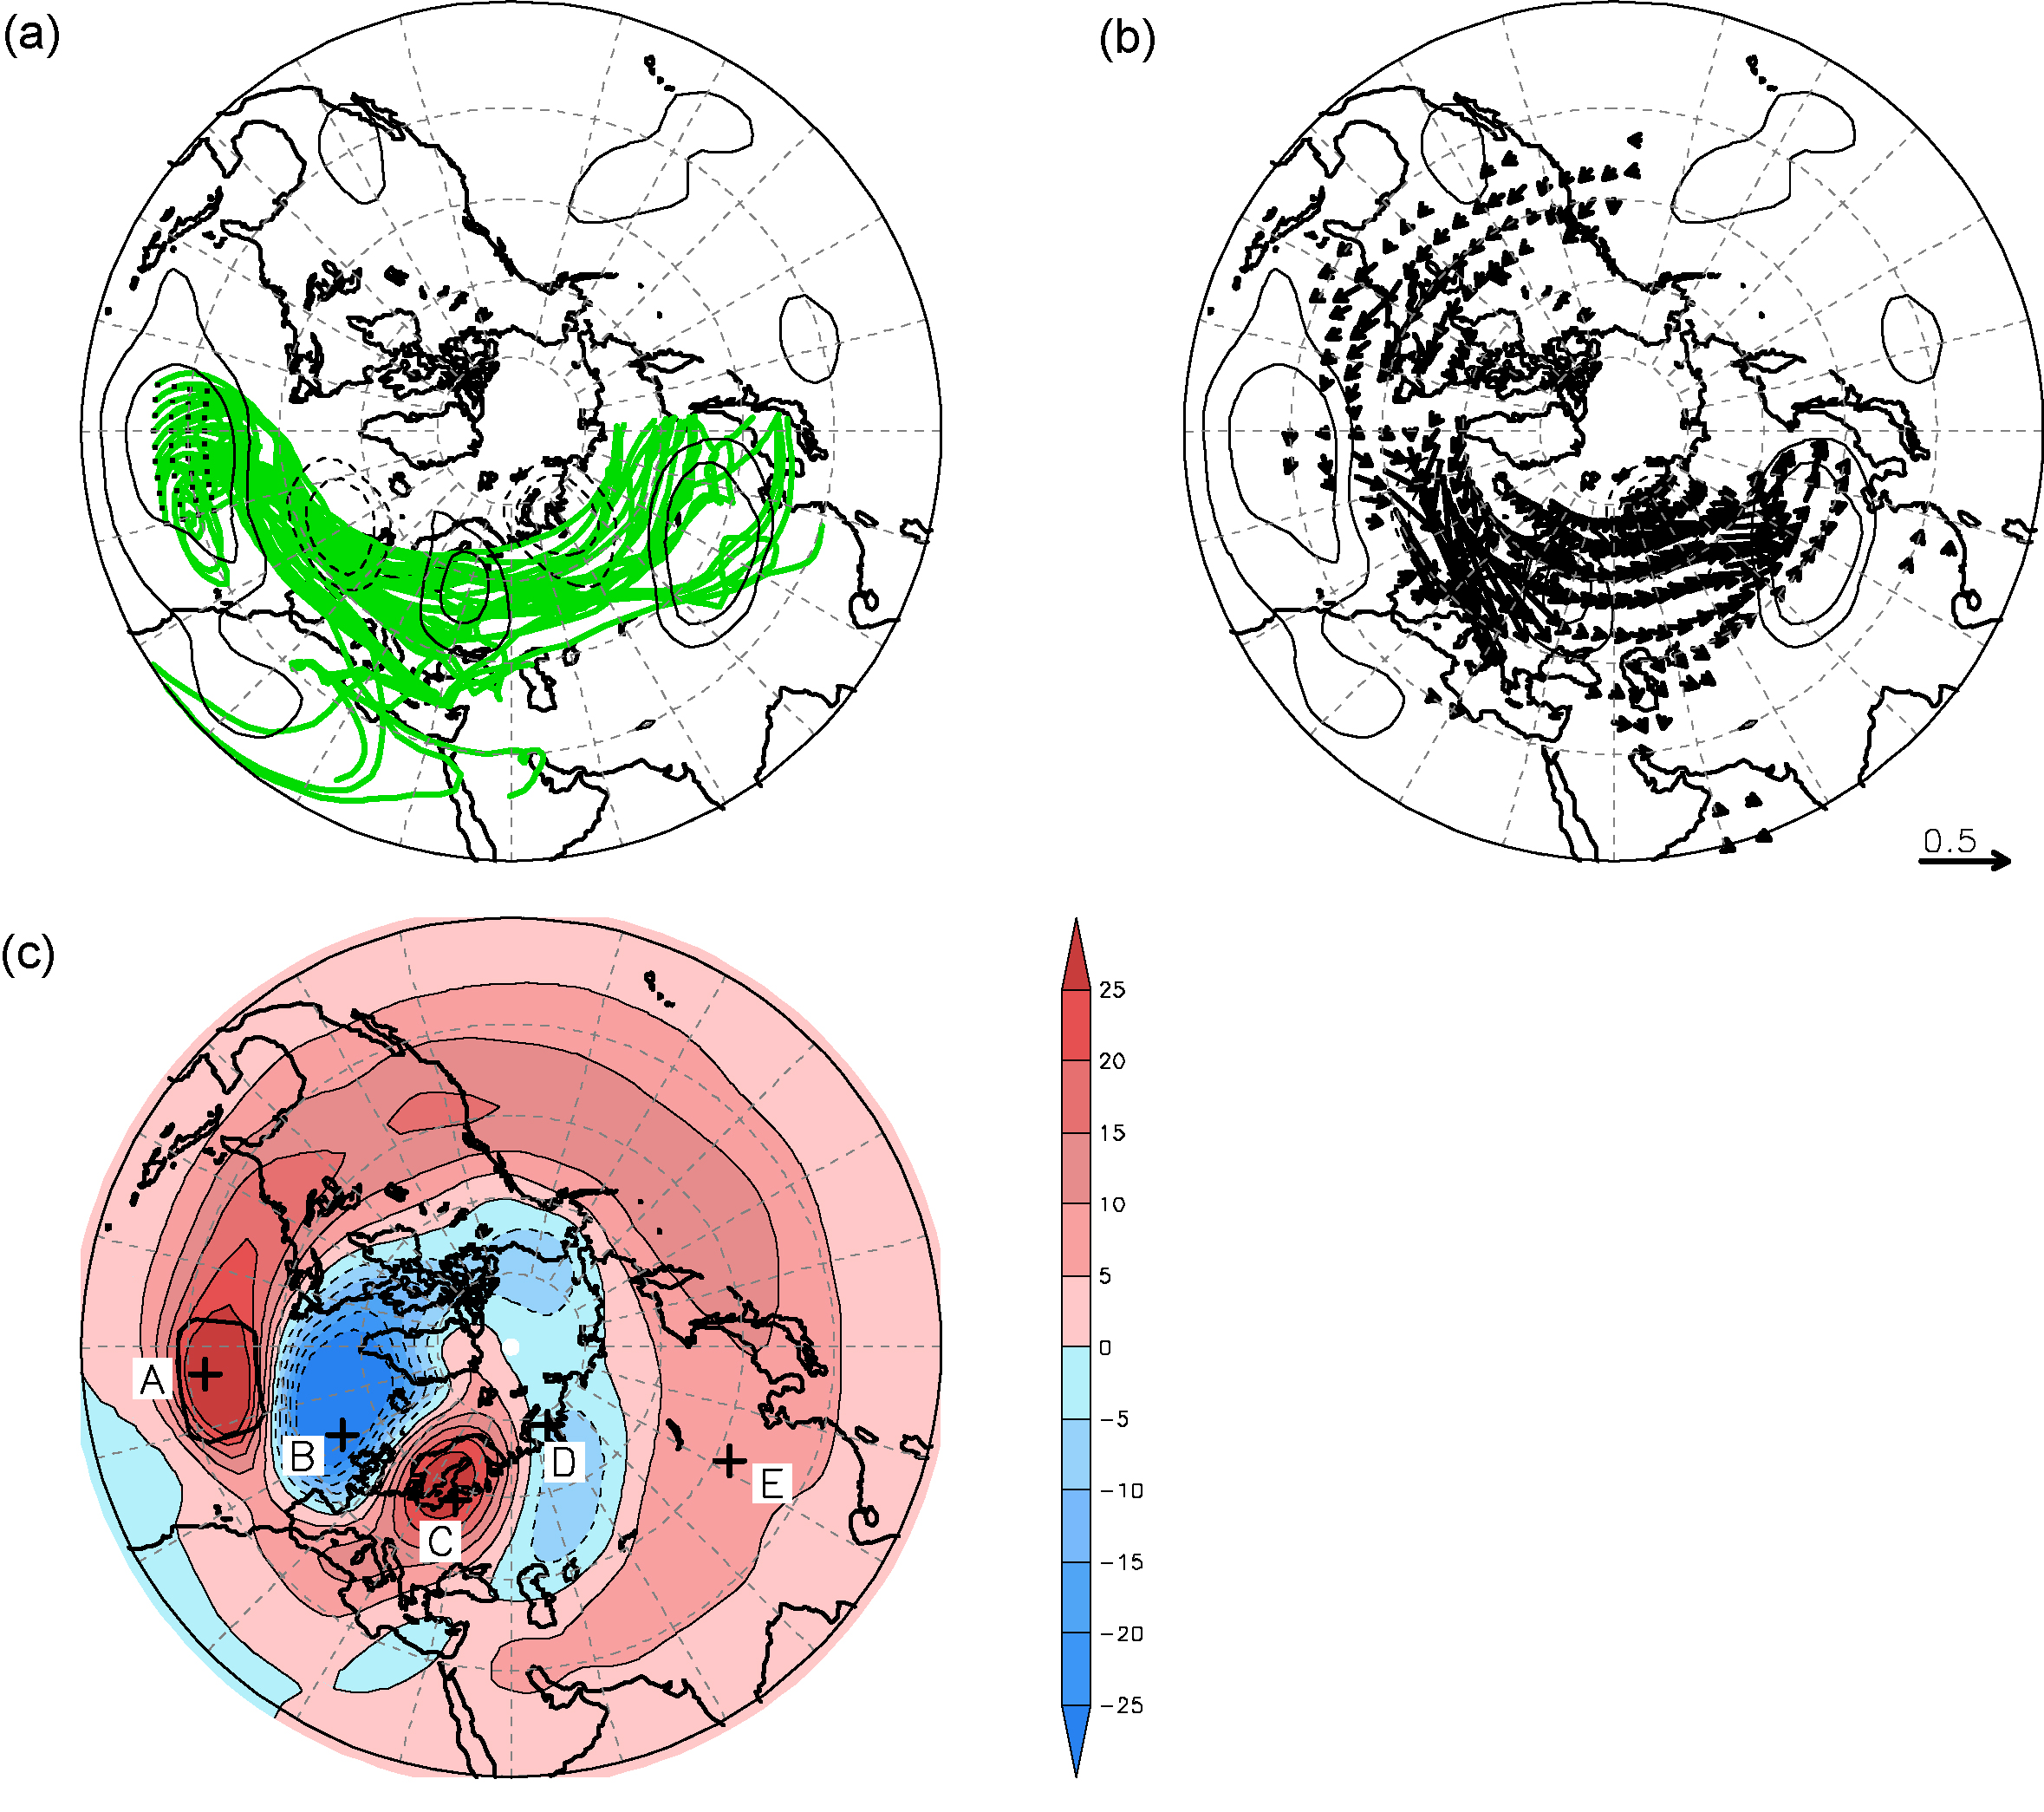
To demonstrate the characteristics of the propagation of large-scale waves in the AEA pattern, and the path of its influence on downstream regions, we use the wave ray approach of stationary Rossby waves in a non-uniform basic flow, according to Li and Li (2012), Li et al (2015), and Zhao et al (2015). The wave ray paths in the basic climatological flow at 500 hPa in JJA are mapped in figure 4(a), for waves that originate in the subtropical North Atlantic Ocean (15°W–60°W, 25°N–37.5°N) where the first node of the AEA pattern is located. Most of the wave rays that are excited in the source region over the subtropical North Atlantic Ocean propagated along the proposed AEA pathway: first northeast to the British Isles, then east through Europe as far as the Ural Mountains, and finally southeast through Siberia to Lake Baikal, Mongolia, and north China. In addition, a small branch of the rays proceeds southward from Europe to the Mediterranean Sea (this branch might be related to the ME pattern).

Figure 4. (a) Stationary Rossby wave trajectories (green) in the Northern Hemisphere flow in summer at the 500 hPa level. The black dots in the subtropical North Atlantic Ocean mark the wave source region. The black contours represent correlation coefficients of ± 0.33 and ± 0.5, which are correlations between the JJA AEAI and Northern Hemisphere 500 hPa geopotential height. The coefficient value of ± 0.33 is significant at the 95% confidence level using Student's t-test. Only rays to the west of 140°E are plotted. (b) Composite difference in Plumb's stationary wave activity flux (m s−2) at 500 hPa between the years of high and low AEAI. The black contours are the same as in (a). (c) The distribution of anomalous heights on Day 18 from the SPMODEL simulation. Contour intervals are 5 m. The domain enclosed by the thick solid line in the subtropical North Atlantic denotes the region of the disturbance source (30°N–40°N, 20°W–60°W). The crosses denote the five centers of action of the AEA.
Download figure:
Standard image High-resolution imageThe method of wave activity flux gives information on the sources and sinks of waves, and helps us to understand the dynamics of the large-scale Rossby wave (Plumb 1985). Figure 4(b) shows composite difference in Plumb's stationary wave activity flux at 500 hPa between the years with a high index (AEAI > 0.5) and the years with a low index (AEAI <−0.5). The wave activity flux is located primarily in the middle latitudes of the North Atlantic Ocean and Eurasia, but also in the subtropical North Atlantic Ocean. In both areas of the North Atlantic, the wave activity flux vectors point northeast, while the flux vectors between 50°N and 70°N in northern Eurasia point east. This indicates that Rossby waves travel from the subtropical North Atlantic Ocean toward the north, then northeast as they crossed the northeastern North Atlantic, Eastern Europe, and Asia as far as Mongolia and north China.
To further analyze the mechanisms of the AEA teleconnection, we employ the SPMODEL (Hayashi et al 2003, Takehiro et al 2006) in a numerical experiment. A source of disturbance is placed in the subtropical North Atlantic (30°N–40°N, 20°W–60°W), and after 20 days of integration, the height field become stable. It can be seen from figure 4(c) that the anomaly height distribution in the SPMODEL simulation is quite similar to the AEA pattern (figure 2(a)). Five main centers of anomalous height are located in the subtropical North Atlantic, the northeastern North Atlantic, Eastern Europe, the Kara Sea and north China. This result further suggests that disturbances in the subtropical North Atlantic Ocean excite a large-scale Rossby wave train that creates the structure of the AEA teleconnection.

Figure 5. Maps of correlation (detrended) between the JJA AEAI and (a) sea level pressure, (b) precipitation, and (c) surface air temperature. Stippling indicates regions exceeding the 95% confidence level based on Student's t-test. The boxes labeled by B, C, D and E in the three panels are key regions with significant correlations. (d) Correlations between the JJA AEAI and area-averaged sea level pressure, precipitation and surface air temperature in the boxes B, C, D and E in panels (a), (b) and (c). All values in (d) are significant at the 95% confidence level based on Student's t-test.
Download figure:
Standard image High-resolution image
Rossby wave propagation in the AEA suggests that the signal in the North Atlantic can propagate to downstream areas, and influence regional climates along the route of the AEA pathway through Europe and north Asia. Figure 5 shows the correlation maps between the detrended AEAI and SLP, precipitation, and surface air temperature in JJA. A five-pole pattern prominently appears in all panels of figure 5, as in the AEA pattern in figure 2(a). When the AEAI is positive in summer, significant low SLP anomalies are observed in the northeastern North Atlantic and Europe south of latitude 55°N, and in the Kara Sea and Northern Siberia; and high SLP anomalies are present over Eastern Europe, and Mongolia–north China (figure 5(a)). By comparison, the anomalous SLP patterns associated with the CGT (see figure 2(c) in Saeed et al (2014)) and AEA have obvious different phase, i.e. the 1/4 phase lag between them is observed. Secondly, more precipitation is observed over western and central Europe and northern Siberia, but less over Eastern Europe and Mongolia–north China (figure 5(b)). Comparing with the European precipitation anomalies associated with the CGT (figure 8 in Saeed et al (2014)), there are some overlaps of impacts of the CGT and AEA on summer precipitation, but there exist some differences. The influence domain of the AEA on summer precipitation in western Europe is further to the south, and that in eastern Europe is further to the north. This indicates that the imprint of the AEA on European summer precipitation displays a southwest–northeast dipole-like pattern, whereas that of the CGT shows an east–west dipole-like pattern (Saeed et al 2014). Finally, low temperatures predominate over the northern North Atlantic Ocean, the Kara Sea and northern Siberia, but high temperatures predominate over northeastern Europe and Mongolia–north China (figure 5(c)). In comparison with figure 4(a) in Saeed et al (2014), except the overlap in the northern European region, the significant correlation areas between the AEA and surface air temperature are obvious different from those of the CGT. When the AEAI is negative, the opposite patterns are observed in summer. The relevant indices in the key regions in figure 5(a)–(c) also exhibit significant correlations with the AEAI in JJA (figure 5(d)). The AEAI could account for 31%, 16%, 30% and 18% of the total variance of areal averaged precipitation variability over the Eastern Europe, western and central Europe, northern Siberia and Mongolia–north China, respectively. Meanwhile, the AEAI could account for 35%, 22%, 42% and 25% of the total variance of areal averaged surface air temperature variability over northeastern Europe, northern North Atlantic Ocean, the Kara Sea and northern Siberia, and Mongolia–north China, respectively. These results suggest that the AEA teleconnection has strong connections with regional climate variations along the AEA pathway through northern Eurasia.
5. Conclusion and discussion
We find evidence for a new teleconnection pattern, the AEA pattern, in the boreal summer 500 hPa geopotential height field, and document some of its spatial-temporal characteristics. The AEA has five centers of action located in the subtropical North Atlantic Ocean, northeastern North Atlantic Ocean, Eastern Europe, the Kara Sea, and north China. We define an AEAI to depict AEA variations. A positive AEAI is indicative of anomalously high 500 hPa geopotential heights over the subtropical North Atlantic Ocean, Eastern Europe, and Mongolia–north China, and low geopotential heights over the northeastern North Atlantic Ocean and Kara Sea–northern Siberia, and vice versa. The AEA had high year-to-year variability and an increasing trend over the past 30 years. We also compare the differences between the CGT (Ding et al 2005; Saeed et al 2011a, 2011b, Saeed et al 2014) and AEA, and find that the two patterns manifest distinct characteristics (e.g. spatial structure, wave pathway, etc.) at the hemispheric scale, though the anomalies associated with them bear some similarities in the northeastern North Atlantic and Eastern Europe.
The AEA teleconnection is significantly linked with regional climate variations in Europe and north Asia. In the positive phase of the AEAI in summer, less precipitation occurs in Eastern Europe and Mongolia–north China, and more precipitation in western and central Europe and northern Siberia; higher temperatures happen in northeastern Europe and Mongolia–north China, and lower temperatures in the northern North Atlantic Ocean, the Kara Sea and northern Siberia. The opposite occurs with a negative AEAI in summer. We assert that the AEA is a large-scale Rossby wave train originating in the subtropical North Atlantic Ocean. Our conclusion is founded on a stationary wave ray tracing method in non-uniform horizontal basic flow, on the wave activity flux, and on numerical model simulations. We also compare the differences between the imprints of the AEA and CGT on European summer surface climate. There is the 1/4 phase lag between the anomalous SLP patterns associated with the CGT (Saeed et al 2014) and AEA. The CGT is associated with an east–west dipole-like European summer precipitation pattern (Saeed et al 2014), while European summer precipitation associated with the AEA displays a southwest–northeast dipole-like pattern. With respect to surface air temperature anomalies associated with the AEA and CGT, except the overlap in the northern European region, the significant anomalous areas are obvious different.
The AEA teleconnection allows a better understanding of links between climate variations in the North Atlantic Ocean and Eurasia. Some associated topics remain to be explored, including the influence of the AEA on regional climates in downstream areas over various space and time scales; other relevant mechanisms including its impacts on the East Asian summer monsoon; and possible links between the AEA and some major climate variations (including the El Nino–Southern Oscillation, the Atlantic Multidecadal Oscillation or Atlantic Multidecadal Variability, the Pacific Decadal Oscillation or Interdecadal Pacific Variability, and the AO/NAO).
Acknowledgments
This work was supported by the National Natural Science Foundation of China (41530424), and the SOA International Cooperation Program on Global Change and Air–Sea Interactions (GASI-IPOVAI-03).