

Abstract
Mitigating nitrogen (N) losses from agriculture without negatively impacting crop productivity is a pressing environmental and economic challenge. Reductions in N fertilizer rate are often highlighted as a solution, yet the degree to which crop yields and economic returns may be impacted at the field-level remains unclear, in part due to limited data availability. Farmers are risk averse and potential yield losses may limit the success of voluntary N loss mitigation protocols, thus understanding field-level yield tradeoffs is critical to inform policy development. Using a case study of soil N2O mitigation in the US Midwest, we conducted an ex-post assessment of two economic and two environmental N rate reduction strategies to identify promising practices for maintaining maize yields and economic returns while reducing N2O emissions per unit yield (i.e. yield-scaled emissions) compared to an assumed baseline N input level. Maize yield response data from 201 on-farm N rate experiments were combined with an empirical equation predicting N2O emissions as a function of N rate. Results indicate that the economic strategy aimed at maximizing returns to N (MRTN) led to moderate but consistent reductions in yield-scaled N2O emissions with small negative impacts on yield and slight increases in median returns. The economic optimum N rate strategy reduced yield-scaled N2O emissions in 75% of cases but increased them otherwise, challenging the assumption that this strategy will automatically reduce environmental impacts per unit production. Both environmental strategies, one designed to increase N recovery efficiency and one to balance N inputs with grain N removal, further reduced yield-scaled N2O emissions but were also associated with negative yield penalties and decreased returns. These results highlight the inherent tension between achieving agronomic and economic goals while reducing environmental impacts which is often overlooked in policy discussions. To enable the development of more scalable environmental N loss mitigation strategies, yield tradeoffs occurring at the critical point of adoption (i.e. the farm-level) should be considered.
Export citation and abstract BibTeX RIS

Original content from this work may be used under the terms of the Creative Commons Attribution 3.0 licence.
Any further distribution of this work must maintain attribution to the author(s) and the title of the work, journal citation and DOI.
1. Introduction
As part of recent international climate change agreements, more than 100 countries have pledged to reduce non-CO2 emissions from agriculture. While this marks significant progress in climate change mitigation policy, it is clear that greater efforts are needed to meet on-farm greenhouse gas (GHG) reduction targets (Davidson 2012, Wollenberg et al 2016). Soil nitrous oxide (N2O) emissions have a radiative forcing potential roughly 300 times larger than CO2 and agriculture contributes approximately 75% to total anthropogenic N2O emissions in the US (Davidson et al 2014). Given that global N2O emissions from agriculture are expected to increase by 35%–60% by 2030 (FAO 2003), region- and crop-specific N2O mitigation strategies are needed, yet large uncertainties remain about the effectiveness of different approaches and potential tradeoffs with other sustainability indicators, including potential impacts on crop productivity (Decock et al 2015).
Inventories of agricultural N2O emissions are often based on the strong relationship between direct N2O emissions and fertilizer N inputs (Grace et al 2011, Philibert et al 2012, Shcherbak et al 2014, Gerber et al 2016). However, because N fertilizer is also important for sustaining crop yields, an integrated understanding of yield impacts related to changes in N fertilizer management is needed to evaluate options for simultaneously meeting future food security and climate change goals (Van Groenigen et al 2010, Abalos et al 2016). One method is to evaluate N2O emissions in terms of crop productivity using 'yield-scaled' emissions rather than per unit area (Van Groenigen et al 2010). Nitrogen rate reduction strategies which simultaneously maintain yields while reducing N2O emissions are lacking, particularly for some of the world's most productive cropping systems which receive high levels of fertilizer N inputs and contribute disproportionately to global N2O budgets (Gerber et al 2016).
The US Midwest accounts for approximately 30% of global maize production on 16% of global maize production area (FAOSTAT 2016, USDA-NASS 2016). Large fertilizer N inputs in this region have led to significant environmental consequences, particularly related to air and water quality (David et al 2010, Turner et al 2015). Due to fertilizer-induced N2O emissions representing roughly 60% of total global warming potential in these cropping systems (Grace et al 2011), carbon offset protocols have recently been developed for this region based on N fertilizer rate reductions (Millar et al 2010, 2013). Such protocols rely on an economic approach to N management using the maximum returns to N rate (MRTN) calculator described below. In these offset protocols, carbon credits are generated when N rates identified by the MRTN calculator are lower than baseline N rates currently applied by farmers, resulting in a corresponding decrease in predicted N2O emissions.
Recent studies have highlighted the potential to reduce agricultural N losses through N rate reductions, yet these assessments are based on aggregated data and there is little information regarding yield impacts at the field-scale. Importantly, farmers are risk averse, thus if incentives or policies to reduce N losses are associated with crop yield penalties, the likelihood of them being adopted by farmers will remain limited. It has been suggested that state-level reductions in fertilizer N rate resulting from widespread adoption of the MRTN approach could reduce N2O emissions in the US Midwest by more than 50% without impacting yields (Millar et al 2010). Similarly, an analysis of several generalized yield response functions found that N recovery efficiency (NRE) could be improved by approximately 30% without penalizing yields or economic profits based on alternative N sources (Zhang et al 2015a). Conclusions from global studies indicate that N rates can be reduced by matching N inputs with N exported in the harvested product, resulting in zero N surplus (Foley et al 2011). When performing assessments to inform policy at broad spatial scales, the difficulty in balancing N management goals is often acknowledged, yet few studies have quantified the degree to which N loss reductions can be achieved without sacrificing crop yields at the field-scale.
To aid the development of effective and scalable N2O mitigation strategies for the US Midwest where current protocols are based on voluntary farmer adoption, N rate reduction approaches that maintain yields while reducing N2O emissions as a function of yield (i.e. yield-scaled N2O emissions) are required. The objective of this study was to evaluate the impacts of two economic and two environmental N rate reduction strategies on maize yield, economic returns, and yield-scaled N2O emissions by combining an empirical N2O emission function with yield results from 201 on-farm N response trials in Illinois.
2. Materials and methods
2.1. On-farm N response trials
Maize yield response to N fertilizer addition was quantified in 201 on-farm experiments in Illinois during 2001–2013. These trials were carried out in collaboration with farmers and contributed to a larger effort aimed at developing economically profitable N rate recommendations in the US Midwest using the MRTN calculator (Sawyer et al 2006). Field trials for this study were implemented in continuous maize and maize-soybean rotations using a randomized complete block design with four replications. Treatments of inorganic N fertilizer generally ranged from 0–224 or 0–280 kg N ha−1 (reaching a maximum N rate of 250 kg N ha−1 on average), implemented as single N applications prior to planting in 56 kg ha−1 increments. All remaining crop management practices were conducted by farmers according to their standard management programs. Maize grain yields were determined at maturity using a combine. Quadratic-plus plateau yield response functions were fit to data at each site using proc NLIN in SAS statistical software version 9.4 (SAS Institute Inc., Cary, NC). Examples of model fit are provided in the supplementary information available at stacks.iop.org/ERL/12/124006/mmedia.
2.2. Estimated N2O emissions
Soil N2O emissions in response to N rate were estimated using an empirical relationship based on multi-year field experiments located in the north central region of the Corn Belt (Millar et al 2013, N2O emissions (kg N ha−1) = 0.67 ⁎ exp (0.0067 ⁎ N rate (kg N ha−1)). This empirical function serves as the basis for the regional Tier 2 method for quantifying reductions in N2O emissions associated with decreased N fertilizer inputs for several approved carbon offset protocols including the Verified Carbon Standard Methodology (see Millar et al 2013 for further background and justification for this method and the supplementary information for a discussion of assumptions and limitations). Yield-scaled N2O emissions were calculated at each site per kg increase in N fertilizer by dividing N2O emissions by predicted maize yield based on the quadratic-plateau yield response functions described above. In the present study, only direct N2O emissions were considered.
2.3. N rate reduction strategies
The impacts of two economic (MRTNlow and EONR) and two environmental (T-30NRE and zero N surplus (ZNS)) N rate reduction strategies on maize yield, agronomic N use efficiency indicators, and yield-scaled N2O emissions were evaluated ex-post at each site compared to an assumed baseline N input level (MRTNhigh). See supplementary table 1 for a thorough description of each strategy. Note that all policy implications of our findings should be limited to the effects of different strategies relative to MRTNhigh. Here we provide a brief description of the four strategies. The MRTN calculator provides a range of profitable N rates for Illinois based on average yield response data across many sites and is currently used as a regional recommendation tool for N management. The MRTN rate is defined as the N rate resulting in the highest average return to N fertilizer, with a profitable N rate range producing returns within US $2.47 ha−1 of the MRTN rate (Sawyer et al 2006, http://cnrc.agron.iastate.edu/). Hereafter, high and low N rates that bound this profitable range are referred to as MRTNhigh and MRTNlow. For this study, MRTNhigh and MRTNlow rates were obtained from the online MRTN calculator in January 2016 based on previous crop (maize or soybean) and location (northern, central, or southern Illinois).
The remaining three strategies we evaluated were site-specific as opposed to multi-site averages. Thus, individual yield response functions at each site were analyzed to determine N rates according to the following criteria: EONR was defined as the N rate which maximized returns to N fertilizer within each trial, T-30NRE was defined as the N rate which increased NRE by a target of 30% above the baseline NRE occurring at MRTNhigh within each trial, and ZNS was defined as the N rate which balanced N inputs with harvested grain N outputs within each trial (see supplementary information for detailed calculations). Importantly, these strategies rely on knowing the yield response in a field, thus they can only be calculated retrospectively after harvest. However, the motivation of this study was to explore the impacts of being able precisely manage N fertilizer to meet economic or environmental goals in each field, were such approaches to become possible through technological advances in the future.
Economic returns to N management were calculated as the value of corn grain produced minus the costs of N fertilizer. A fertilizer cost to maize grain price ratio of 0.056 was used based on a fertilizer price of $0.83 kg N−1 and a grain price of $147.66 Mg−1. While these values can vary in time, this ratio is widely used in the literature (e.g. Puntel et al 2016) and represents the default for estimating N fertilizer costs and maize grain prices in the online MRTN rate calculator (http://cnrc.agron.iastate.edu/). These values are similar to the average cost of anhydrous ammonia N fertilizer for the north central region ($0.78 kg N−1) and the maize grain price in Illinois ($140.57 Mg−1) during the study period (USDA-NASS 2016). Relatively large (50%) increases or decreases in this ratio have been shown to decrease or increase MRTN rates in Illinois by 13% or 21%, respectively (Sawyer et al 2006).
2.4. Data analysis
The effects of MRTNlow, EONR, T-30NRE, and ZNS were individually compared to assumed baseline management (MRTNhigh) using R software version 3.1.1 (R Core Team 2014). Distributions of differences in yields and economic returns within each site were plotted using kernel density plots. Changes in N rate, N2O emissions, NRE, N surplus, and yield-scaled N2O emissions within each site for the four N rate reduction strategies as compared to MRTNhigh were evaluated using boxplots. To assess the variability of yield-scaled N2O emissions across sites, the probability of both samples coming from the same distribution was determined using two-sample nonparametric Kolmogorov–Smirnov tests and a significance level of p < 0.05. Figures were constructed using ggplot2 (Wickham 2009).
3. Results
The response of maize yield to N rate varied widely across the 201 on-farm experiments (figure 1(a)). Average maize yields were 6.4 Mg ha−1 without N fertilizer and reached 11.8 Mg ha−1 at an average EONR of 171 kg N ha−1. Average yield-scaled N2O emissions remained below approximately 0.18 kg N Mg−1 at N rates lower than 171 kg N ha−1, but increased rapidly to more than 0.3 kg N Mg−1 at 250 kg N ha−1 (figure 1(c)). Average agronomic N use efficiency (ANUE; kg grain yield increase per kg N applied) decreased steadily per unit of N applied, declining from greater than 60 kg kg−1 to less than 23 kg kg−1 at 250 kg N ha−1 (figure 1(d)). Average apparent NRE also decreased steadily per unit of applied N, reaching 33% at 171 kg N ha−1 across all sites (figure 1(e)). Nitrogen rates below 107 kg N ha−1 on average resulted in a negative N surplus (figure 1(f)), whereas N rates above this contributed to average N surplus values which continued to increase up to a maximum of 130 kg N ha−1 at 250 kg N ha−1.

Figure 1. Maize yield response to N rate in 201 on-farm experiments in Illinois, USA (a), empirical model for predicting N2O emissions from Millar et al 2013 (b), and estimated yield-scaled N2O emissions (c), ANUE (d), NRE (e), and N surplus (f) for each study site. Colored lines distinguish individual sites, while the dark blue line represents the mean across all sites.
Download figure:
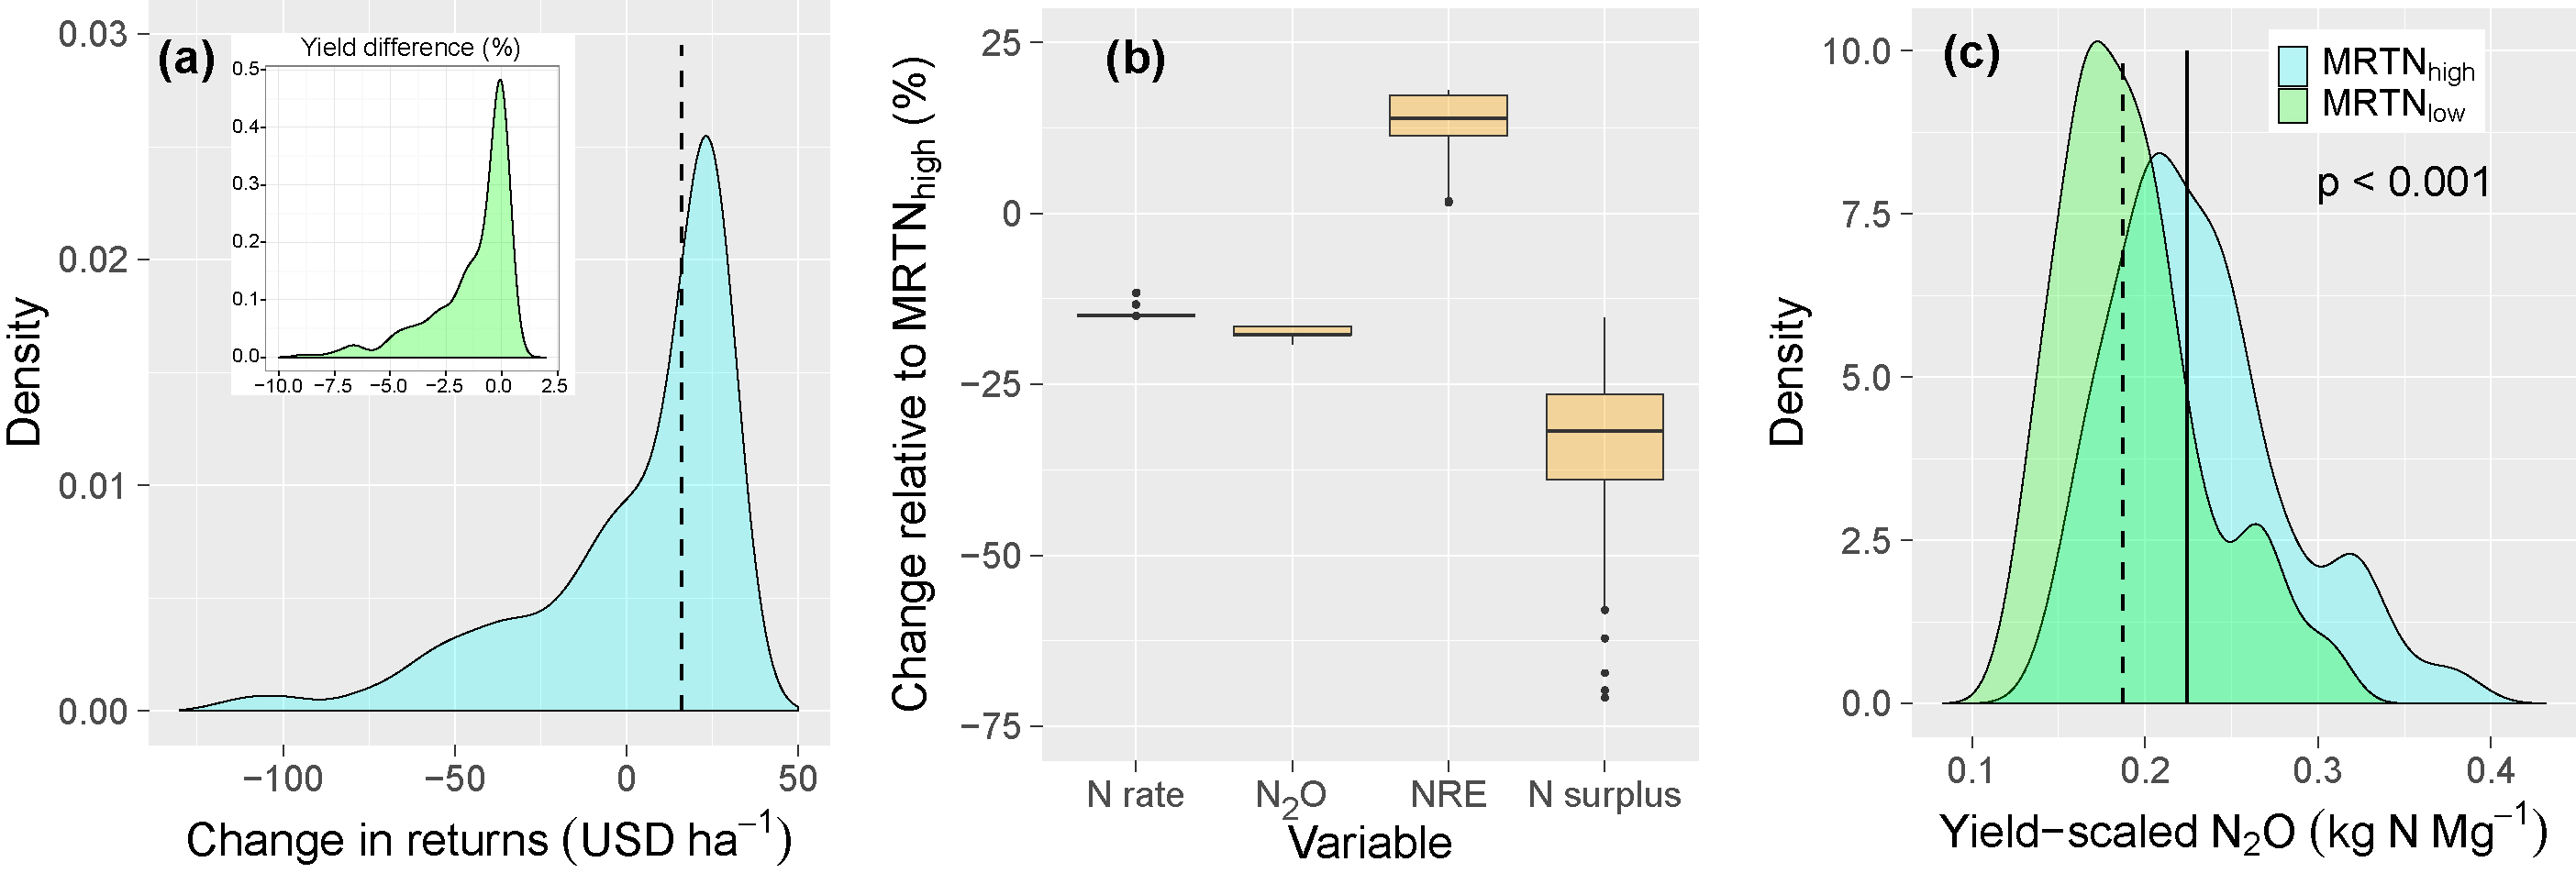
Standard image High-resolution imageAcross all sites, the average N rate for MRTNhigh and MRTNlow was 207 and 178 kg N ha−1, respectively. MRTNlow increased returns by a median value of 16 USD ha−1 compared to MRTNhigh, although there was substantial variability among sites (lower and upper quartiles were −10 and 25 USD ha−1, respectively) (figure 2(a)). While MRTNlow had small negative impacts on yield at the majority of sites (figure 2(a) inset), it decreased N rates and N2O emissions by median values of 15 and 18%, respectively (figure 2(b)). In addition, MRTNlow increased NRE by 14% and decreased N surplus by 32%, while significantly reducing yield-scaled N2O emissions across sites (figure 2(c)). The median reduction in yield-scaled N2O emissions within each site was 17%, with a low amount of variability occurring across sites (figure 3).

Figure 2. Effect of reducing N rates from MRTNhigh to MRTNlow on (a) the probability distribution of the change in returns to N fertilizer and yields (inset) at each site, (b) the relative change in N rate, N2O emissions, NRE, and N surplus at each site, (c) and the probability distribution of yield-scaled N2O emissions for each strategy across all sites. Vertical lines indicate median values. The p-value in (c) refers to the probability of both samples coming from the same distribution.
Download figure:
Standard image High-resolution image
Figure 3. The change in yield-scaled N2O emissions within each site compared to MRTNhigh for each economic and environmental N rate reduction strategy.
Download figure:
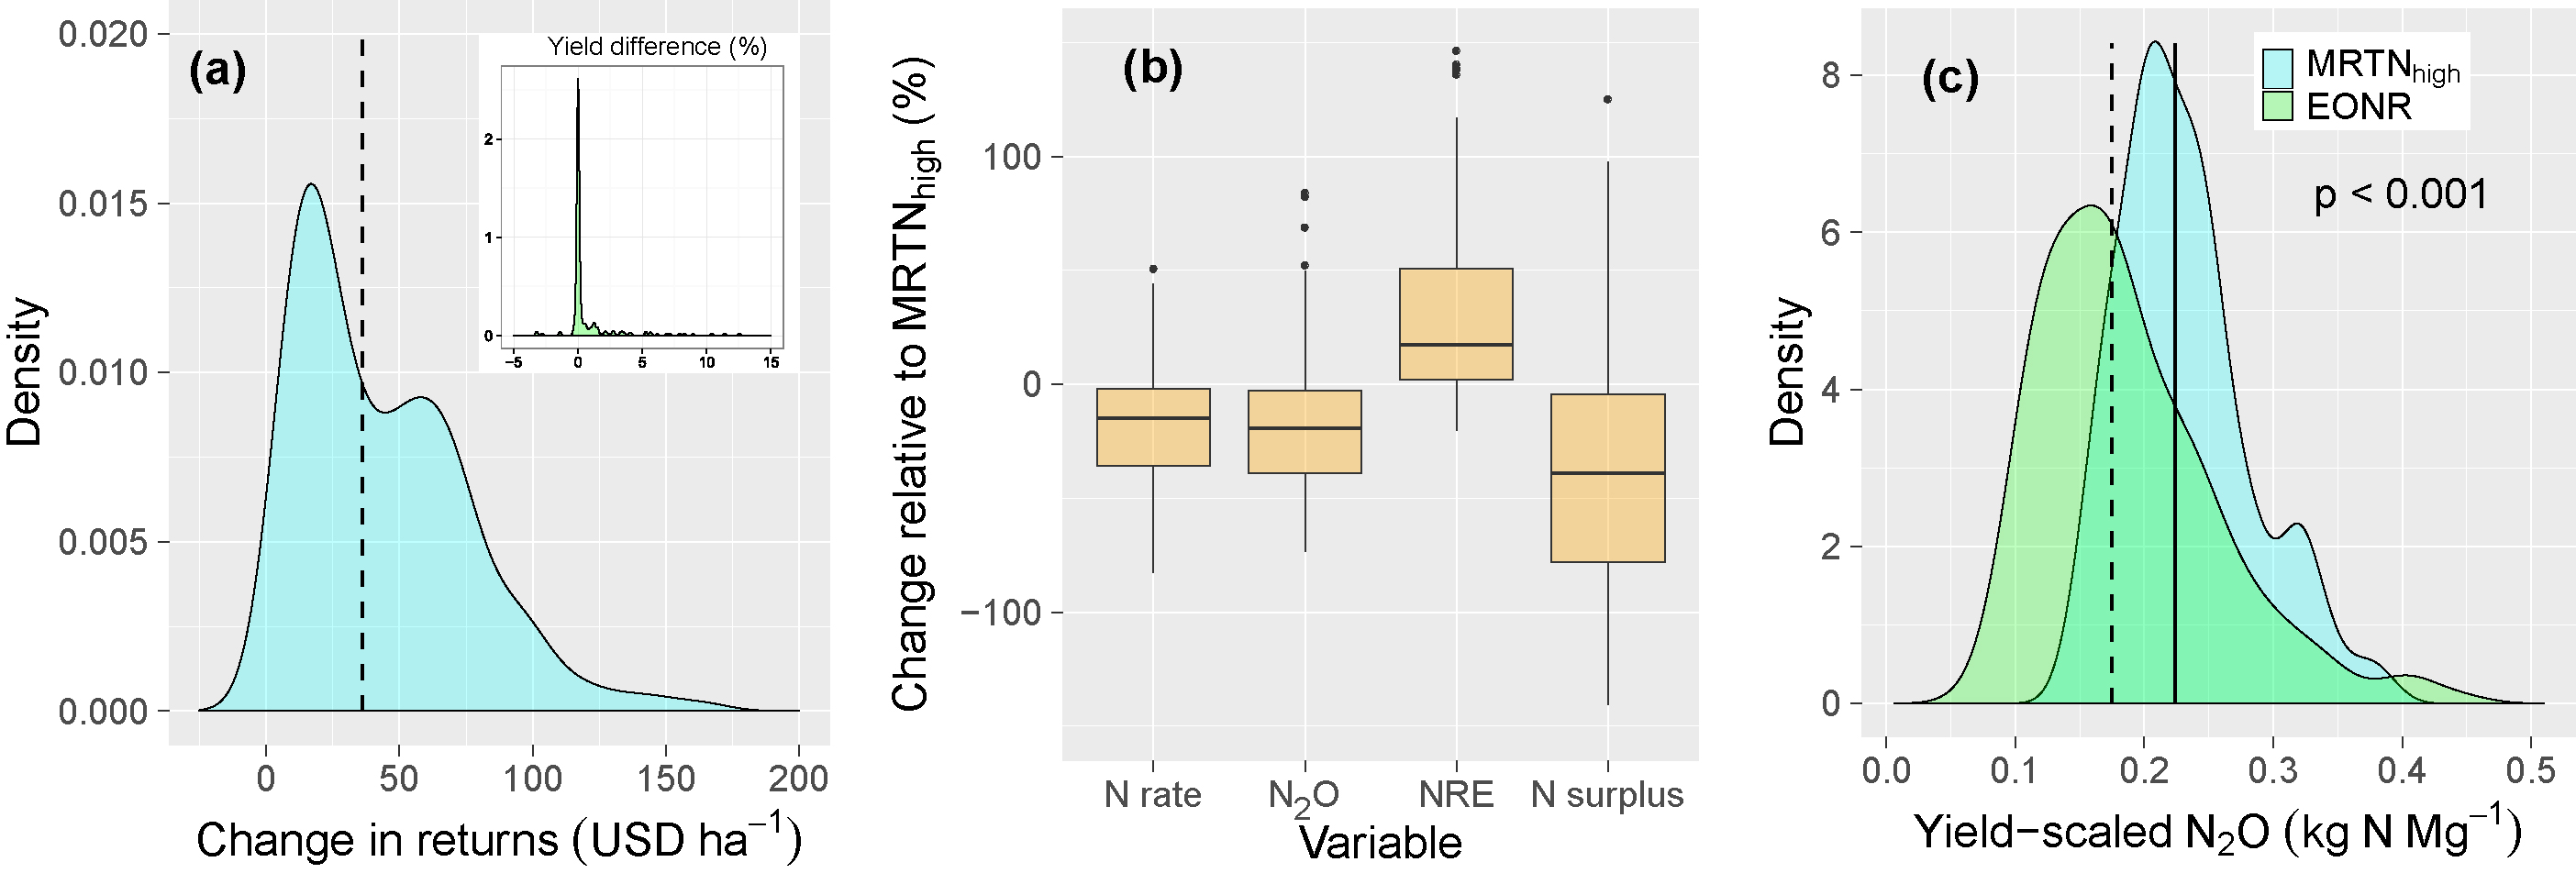
Standard image High-resolution imageWhen returns to N fertilizer were maximized within each trial using EONR, the average N rate was 171 kg N ha−1. Compared to MRTNhigh, EONR increased returns by a median value of 36 USD ha−1 (first and third quartiles were 16 and 65 USD ha−1, respectively) (figure 4(a)), yet yield impacts were negligible (generally within 1% of MRTNhigh; figure 4(a) inset). EONR tended to decrease N rates and N2O emissions, while increasing NRE and decreasing N surplus, with greater variability occurring across sites (figure 4(b)). Similarly, although EONR significantly decreased yield-scaled N2O emissions across sites (figure 4(c)), there was much greater variability compared to MRTNlow. Within each site, EONR decreased yield-scaled N2O emissions by a median value of 19% (figure 3), but decreases were only observed in approximately 75% of cases, whereas increases were observed in about 25% of cases (i.e. upper quartile).

Figure 4. Effect of changing N rates from MRTNhigh to EONR on (a) the probability distribution of the change in returns to N fertilizer and yields (inset) at each site, (b) the relative change in N rate, N2O emissions, NRE, and N surplus at each site, (c) and the probability distribution of yield-scaled N2O emissions for each strategy across all sites. The p-value in (c) refers to the probability of both samples coming from the same distribution.
Download figure:
Standard image High-resolution imageIncreasing NRE by 30% above that occurring at the baseline N rate within each trial resulted in an average N rate of 143 kg N ha−1 for T-30NRE. Across sites, returns for T-30NRE compared to MRTNhigh were highly variable (figure 5(a)). Yield decreases with T-30NRE were common, with yield reductions of more than 5% observed at 75 sites, more than 10% at 45 sites, and more than 20% at 15 of 201 sites (figure 5(a) inset). Within each site, T-30NRE decreased N rates and N2O emissions by 25 and 30%, respectively, while increasing NRE by (the goal of) 30% at the majority of sites and decreasing N surplus by 63% (figure 5(b)). Across sites, T-30NRE significantly reduced yield-scaled N2O emissions (figure 5(c)), with a median value of −29% observed within each site and relatively low variability occurring across sites (figure 3).

Figure 5. Effect of reducing N rates from MRTNhigh to T-30NRE on (a) the probability distribution of the change in returns to N fertilizer and yields (inset) at each site, (b) the relative change in N rate, N2O emissions, NRE, and N surplus at each site, (c) and the probability distribution of yield-scaled N2O emissions for each strategy across all sites. The p-value in (c) refers to the probability of both samples coming from the same distribution.
Download figure:
Standard image High-resolution imageBalancing N inputs with harvested grain N outputs to achieve ZNS within each trial led to an average N rate of 104 kg N ha−1. Compared to MRTNhigh, ZNS reduced returns by a median value of 50 USD ha−1 (lower and upper quartiles of −196 and 28 USD ha−1) (figure 6(a)). Negative yield impacts greater than 5, 10, and 20% occurred at approximately 61, 39, and 21% of sites, respectively (figure 6(a) inset). Meanwhile, N rates and N2O emissions were reduced by median values of −48% and −49%, respectively (figure 6(b)). By definition, ZNS reduced N surplus by 100%, with a corresponding increase in NRE by a median of 48%. ZNS reduced yield-scaled N2O emissions to the greatest extent across sites (figure 6(c)), with a median value of −41% within each site (figure 3).

Figure 6. Effect of reducing N rates from MRTNhigh to zero N surplus (ZNS) on (a) the probability distribution of the change in returns to N fertilizer and yields (inset) at each site, (b) the relative change in N rate, N2O emissions, NRE, and N surplus at each site, (c) and the probability distribution of yield-scaled N2O emissions for each strategy across all sites. The p-value in (c) refers to the probability of both samples coming from the same distribution.
Download figure:
Standard image High-resolution image
4. Discussion
There is a critical need to develop agricultural intensification strategies which optimize crop productivity at N input levels that are economically and environmentally sustainable. Expressing N2O emissions in terms of crop productivity rather than per unit area is a simple but informative tool for identifying N application rates needed to optimize yields while lowering N2O losses per unit yield (Van Groenigen et al 2010). Over a wide range of soil and climate conditions in Illinois, we found that the minimum value for yield-scaled N2O emissions occurred at 41 kg N ha−1 which is well below the average EONR for this dataset (171 kg N ha−1) (figure 1). This finding highlights the inherent tension between achieving high yields with minimum environmental impacts for maize production in this region. Still, with yield-scaled N2O emissions accelerating as N rates increased above 41 kg N ha−1, values further increased by 66% when moving from the economic optimum of 171–250 kg N ha−1. The relationship between rapidly increasing yield-scaled N2O emissions and excessive N rates is consistent with previous findings (Van Groenigen et al 2010, Grassini and Cassman 2012, Linquist et al 2012, Pittelkow et al 2014), providing further support for the concept that large increases in negative environmental consequences can be avoided by reducing excessive N inputs and integrating agronomic goals with environmental risks.
Despite the large variability in yield response across sites, our results indicate that MRTNlow is an effective strategy for modest but consistent reductions in yield-scaled N2O emissions relative to MRTNhigh. While MRTNlow generally had small negative impacts on yield, median returns increased slightly by 16 USD ha−1, meaning this N rate reduction (15% median) decreased costs to a greater extent than yields in approximately 64% of cases, while also enhancing NRE and decreasing N surplus and N2O emissions (figure 2). Given the increasing emphasis on N2O mitigation in the US Midwest, including new N management credit programs funded by the Natural Resources Conservation Service, US Department of Agriculture, our finding that field-level economic returns can be highly variable relative to MRTNhigh is noteworthy. Although median yield decreases were <1%, which is in agreement with recently developed carbon offset protocols based on the MRTN approach (Millar et al 2013), a wide range of both positive and negative returns occurred across sites relative to MRTNhigh which may have implications for farmer adoption. An important limitation of the current study is the assumption of MRTNhigh as the baseline N input level (see supplementary information for a discussion), highlighting the need for more information on field-level N management practices to accurately evaluate different options for sustainable intensification.
In contrast to the MRTN approach based on multi-site averages, there is great interest in developing soil tests, crop models, or in-season measurement tools to determine EONR earlier in the season when N management decisions are being made (Scharf 2001, Scharf 2015, Williams et al 2007, Zhang et al 2015a). In theory, such technologies would allow farmers to optimize N rates on a field-by-field basis each year, increasing sustainability by minimizing environmental N losses. Our analysis demonstrates the strong economic advantage of implementing EONR compared to MRTNhigh, if it were to become possible in the future. Although EONR slightly decreased median N rates and N2O emissions, there was a surprising amount of variability across sites, and EONR actually increased N2O emissions, N surplus, and yield-scaled N2O emissions in roughly 25% of cases (figures 3 and 4). This generally occurred when higher rates of fertilizer N were required to reach optimum yields compared to MRTNhigh, leading to a corresponding increase in predicted N2O emissions (see supplementary information for further discussion). Given the strong emphasis on developing in-season N management tools in the US Midwest, these results question the assumption that being able to apply EONR will necessarily reduce N rates and represent a more sustainable, site-specific N2O emission mitigation strategy relative to the MRTN approach.
Improving NRE and applying N fertilizer in balance with crop demand are frequently proposed as environmental policy options for mitigating N losses (Tilman et al 2011, Zhang et al 2015b). Zhang et al (2015a) compared several generalized yield response curves obtained from different studies in the US Midwest to examine the economic and environmental consequences of technologies aimed at improving NRE. For example, enhanced efficiency N fertilizers were assumed to produce 15% higher yields with 9% less N fertilizer, increasing NRE by 30% without negatively impacting economic outcomes. However, whether farmers will adopt alternative N management technologies largely depends on how consistently they change yield response functions across a wide range of soil, weather, and management conditions while producing a positive return. For the target level of NRE improvement considered in this study (30%), we estimated that a 25% median reduction in N rates would be needed compared to MRTNhigh. While this effectively reduced N2O and yield-scaled N2O emissions by approximately 30%, T-30NRE also resulted in significant yield decreases and economic losses (37% of sites had a yield penalty >5% and returns were more negative than −84 USD ha−1 at 25% of sites (figures 3 and 5). Similarly, achieving zero N surplus at each site required nearly a 50% median reduction in N rates compared to MRTNhigh. As a consequence, yield-scaled N2O emissions were reduced to the greatest extent with ZNS (41%), but this also resulted in the most significant maize yield losses and economic penalties (e.g. at more than 25% of sites, yields and returns decreased by more than 18% and 196 USD ha−1, respectively) (figures 3 and 6). These findings contradict the notion that large reductions in N rate are possible without negative yield consequences.
Despite many farmers being concerned about environmental quality and N losses in the US Midwest, they are also faced with tough economic decisions (Reimer et al 2017). At present, N rate reduction strategies are voluntary, suggesting that even slight yield reductions could deter a farmer from considering enrollment in N loss mitigation programs, and that the economic decision-making process of individual farmers should be considered in top-down assessments. While we are not aware of prior studies assessing tradeoffs between maintaining economic returns and reducing yield-scaled N2O emissions across a large population of field trials, another important area for future work using on-farm data would be to evaluate the variability observed across sites to search for win-win solutions, i.e. the ability to maintain yields while reducing N losses. The current database did not contain the necessary variables to support this type of analysis, but it is possible that sites with different soil types or crop management history may better withstand N rate reductions than others, suggesting that spatial reallocation of N inputs among a population of sites could increase overall N use efficiency without reducing total production (Bodirsky and Müller 2014, Lassaletta et al 2014). With this approach it would first be important to consider the inter-annual variability of N responses occurring within a site, given that consistent yield responses are necessary for spatial reallocation to be effective over time.
Our results regarding yield tradeoffs and potential economic losses may help identify barriers currently limiting farmer participation in N rate reduction programs in the US Midwest. Major obstacles preventing farmer adoption already exist, including perceptions of climate change, understanding of N fertilizer-induced GHG emissions, and knowledge of effective management practices to improve N use efficiency (Stuart et al 2014). To enable the development of more effective and scalable N loss mitigation strategies, we argue it is necessary to account for farm-level yield consequences. At the same time, policy discussions should also consider that a narrow focus on reducing environmental N losses may come at the cost of other cropping system functions necessary for sustainable production. For example, application of N fertilizer at agronomic optimum rates has recently been shown to be important for maintaining or increasing soil organic carbon in long-term maize-based rotations (Poffenbarger et al 2017), bringing into question whether the environmental strategies assessed here could sustain soil fertility levels in the future. To minimize tradeoffs, programs aimed at promoting sustainable N fertilizer use should account for multiple agronomic, economic, and environmental indicators where possible.
5. Conclusions
This study provides an improved evidence-base for assessing the variability of economic risks and developing insights into potential farmer adoption of N rate reduction protocols aimed at balancing agronomic and environmental goals in the US Midwest. By combining an empirical N2O emission model with on-farm maize yield response data in Illinois, we found that two environmental N rate reduction strategies (enhancing NRE by 30% or maintaining zero N surplus) had greater potential to reduce N2O emissions on an area- and yield-scaled basis compared MRTNhigh than two economic strategies, MRTNlow and EONR. However, both environmental strategies were associated with large reductions in N rate which negatively impacted yields and economic returns. In contrast, results show that MRTNlow was a practical N rate reduction strategy that resulted in smaller yield reductions and increased economic returns in 64% of sites, while consistently mitigating N2O emissions per unit yield relative to MRTNhigh. By comparison, the site-specific EONR approach resulted in slightly greater reductions in median yield-scaled N2O emissions, but with greater variability across sites. Important limitations regarding the policy implications of this study are the assumption of MRTNhigh as current farmer practice and the need to interpret results within the specific context of all N application prior to planting. We conclude that potential decreases in field-level yields and economic returns should be accounted for in policy discussions to increase the likelihood of voluntary farmer adoption and support the scaling up of environmental N loss mitigation strategies in agriculture.
Acknowledgments
The authors gratefully acknowledge the participating farmers in Illinois who assisted in field trial management and data collection, with special thanks to Dan Schaefer, who coordinated some of the recent field trials. This material is based upon work supported by the National Institute of Food and Agriculture, US Department of Agriculture, Hatch project (No. ILLU-802–949), and the Youth Innovation Promotion Association, CAS (Member No. 2015249).