

Abstract
Weather extremes have harmful impacts on communities around Lake Victoria in East Africa. Every year, intense nighttime thunderstorms cause numerous boating accidents on the lake, resulting in thousands of deaths among fishermen. Operational storm warning systems are therefore crucial. Here we complement ongoing early warning efforts based on numerical weather prediction, by presenting a new satellite data-driven storm prediction system, the prototype Lake Victoria Intense storm Early Warning System (VIEWS). VIEWS derives predictability from the correlation between afternoon land storm activity and nighttime storm intensity on Lake Victoria, and relies on logistic regression techniques to forecast extreme thunderstorms from satellite observations. Evaluation of the statistical model reveals that predictive power is high and independent of the type of input dataset. We then optimise the configuration and show that false alarms also contain valuable information. Our results suggest that regression-based models that are motivated through process understanding have the potential to reduce the vulnerability of local fishing communities around Lake Victoria. The experimental prediction system is publicly available under the MIT licence at http://github.com/wthiery/VIEWS.
Export citation and abstract BibTeX RIS

Original content from this work may be used under the terms of the Creative Commons Attribution 3.0 licence.
Any further distribution of this work must maintain attribution to the author(s) and the title of the work, journal citation and DOI.
1. Introduction
With a surface area of 68 800 km2, Lake Victoria is the largest lake in Africa. The lake directly sustains the livelihood of 30 million people living near its coasts and its fishing industry is a critical natural resource for communities in East Africa (Song et al 2004, East African Community 2011).
However, severe thunderstorms and associated high waves represent a constant threat to the 200 000 fishermen operating on the lake (East African Community 2011). No reliable figures are available for the number of incidents in which people drown, but the International Federation of Red Cross and Red Crescent Societies (2014) assumes that 3000–5000 fishermen die every year on the lake, and boating accidents are often related to severe weather (East African Community 2011). Thunderstorms on Lake Victoria thereby substantially contribute to the global death toll from natural disasters. Also, these events have major implications for the regional economies, as each perished fisherman leaves on average eight relatives without an income (East African Community 2011). Rapid urbanisation along the lakefront (Seto et al 2012) will in the near-future likely lead to a sharp increase in exposure of local fishing communities to these natural hazards, whereas future climate projections indicate a strong increase in thunderstorm intensity especially over Lake Victoria (Thiery et al 2016). In particular, the projected future increase in extreme precipitation over Lake Victoria is about twice as large relative to surrounding land under a high-emission scenario, and consistently emerges from single-model, high-resolution simulations and coarser-scale ensemble projections.
Due to this unacceptable human cost, efforts have been ongoing to develop a well-functioning early warning system, which would prevent fishermen from taking risks when conditions are favourable for severe storm development. These efforts have aimed to reduce accidents via storm warnings derived from operational, high-resolution numerical weather prediction (NWP) systems. Notably, the meteorological service of the United Kingdom (Met Office, hereafter referred to as UKMO) has recently established a 4 km resolution limited-area NWP system for the larger Lake Victoria region and a first evaluation indicates better performance than persistence forecasts of 'today will be the same as yesterday' (Chamberlain et al 2014, Eagle et al 2015). In parallel, a 'Mobile Weather Alert' pilot was launched in 2011 by the World Meteorological Organization (WMO), providing Kenyan fishermen with free forecast and warning information via their cell phone (East African Community 2011, Chamberlain et al 2014). A similar effort is currently undertaken in Uganda by the Trans-African Hydro-Meteorological Observatory (TAHMO, http://tahmo.org/), while the Safe Water Foundation (SWF, https://forsafewaters.wordpress.com/) aims to integrate these efforts across the three countries bordering Lake Victoria (Uganda, Kenya and Tanzania). Finally, the Global Energy and Water Cycle Exchanges Project (GEWEX) has recently launched the Hydroclimate project for Lake Victoria (HyVic, www.gewex.org/hyvic/), which aims to provide scientific understanding of the climate of the region to improve weather prediction and climate projections (Semazzi et al 2014).
Thunderstorms and precipitation display a clear diurnal cycle over Lake Victoria. In contrast to the diurnal cycle observed over the surrounding land, convective activity over Lake Victoria peaks at night while being suppressed during daytime (figures 1(a)–(c); supplementary figure 1 stacks.iop.org/ERL/12/074012/mmedia). This distinct pattern arises from the lake/land breeze system which induces near-surface divergence during daytime and convergence at night, as well as from sustained evaporation over the lake surface and from anabatic/katabatic flows originating on the mountain slopes east of the lake (Song et al 2004, Anyah et al 2006, Williams et al 2015, Thiery et al 2015). Similar patterns are found for the other African Great Lakes, each time modulated by local orography (Thiery et al 2015).
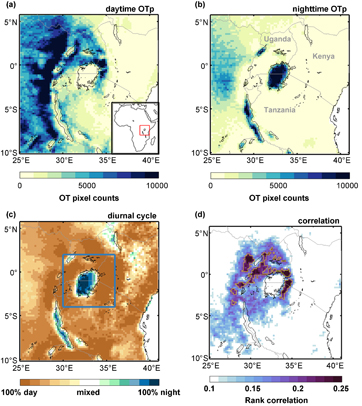
Figure 1 Lake imprint on severe thunderstorm occurrence in East Africa. (a–b), Satellite-based OT pixel detections during 2005–2013 from 12:00–18:00 EAT (daytime) and from 00:00 to 12:00 EAT (nighttime), respectively, as derived from the Spinning Enhanced Visible and Infrared Imager (SEVIRI) over equatorial East Africa (25 °E–41 °E, 10 °S–6 °N). (c), Fraction of OTp occurring during daytime and nighttime. The blue rectangle denotes land pixels selected to establish the proof on concept (section 3). (d), Temporal correlation of daytime land OTp (panel a) to nighttime OTp aggregated over Lake Victoria (panel b). As an illustration, all regions with rank correlation above 0.20 are marked by yellow polygons (section 4).
Download figure:
Standard image High-resolution imageA recent analysis of the controlling factors of extreme thunderstorms over Lake Victoria revealed a strong dependency of the nighttime over-lake storm intensity on the antecedent daytime land storm activity (Thiery et al 2016). Intense daytime land storms thereby modify the lake/land breeze system and associated moisture transport, in particular by inducing a moist anomaly in the lower layers of the atmosphere and by cooling the land surface. This cold anomaly in turn limits moisture divergence from the lake (weak lake breeze) while favouring nighttime near-surface convergence (strong land breeze). Overall this highlights the key importance of mesoscale circulation for understanding weather extremes in the region.
The afternoon control on nighttime storm activity also indicates an inherent predictability in the system which has not been exploited so far. Moreover, this analysis was based on a new proxy dataset for severe thunderstorm occurrence, suggesting that predictions might be derived from observational products. Finally, this proxy is derived from an operational weather satellite and can thus be made available in realtime. Altogether this presents an opportunity for developing a new, satellite-based short-term prediction system for severe thunderstorms over Lake Victoria.
The main goal of this study is therefore to explore the potential of satellite-based thunderstorm observations as a risk indicator for extreme storm occurrence over Lake Victoria. We propose an innovative yet simple approach to predict the occurrence of the 1% most extreme events, that is, the ∼3–4 nights per year with the most intense nighttime storm activity. In particular, we develop a logistic regression model based on a 9 year severe thunderstorm dataset available for the region. The main advantages of this approach are the high skill, minimum computational cost and independence of existing forecast products. As such our data-driven approach complements and supports ongoing efforts from the NWP community (dynamical modelling) to eventually reduce the vulnerability of local communities around Lake Victoria.
In this paper, we first establish the proof of concept of observation-driven storm predictability by applying logistic regression to three different data products. We subsequently optimise the statistical model for one product through an objective calibration procedure, both at the lake and country scale. Finally, we outline the structure of the prototype prediction tool which is released into the public domain.
2. Data and Methodology
2.1. Overshooting top detections and rainfall data
Satellite observations enable the recognition of severe weather by detecting overshooting tops (OTs), which appear as dome-like protrusions atop a cumulonimbus anvil (Bedka et al 2010). OTs indicate the presence of deep convective events and are induced by intense updraughts through the tropopause into the lower stratosphere (Proud 2015). OT-producing convective thunderstorms frequently produce hazardous weather at the Earth's surface, like heavy rainfall, wind gusts, large hail and tornadoes (see Bedka et al (2010) and Dworak et al (2012) for an overview). The detection of OTs is therefore a relevant proxy for surface impacts of severe thunderstorms.
In this study we use a 9 year OT dataset for equatorial East Africa (25 °E–41 °E, 10 °S–6 °N, figure 1, Thiery et al (2016)) derived from the Spinning Enhanced Visible and Infrared Imager (SEVIRI) on board Meteosat Second Generation (MSG; Aminou (2002)). The OT detection algorithm is described in detail in Bedka et al (2010) and Bedka (2011); it builds on the premise that OTs are composed of a small region of very cold infrared brightness temperatures surrounded by a warmer cirrus anvil cloud (Wang 2007). The SEVIRI instrument originally provides images at 15 minute temporal and ∼4-km spatial resolution over the Lake Victoria region. For our analysis the dataset was aggregated to a regular 0.2 ° × 0.2 ° grid, and from 15-min to hourly resolution, in both cases by summing all OT pixel detections in the high-resolution imagery. By reducing the size of the original data set, we increase the speed of the prediction system without affecting its predictive power. The dataset comprises more than 50 million OT pixels (hereafter referred to as OTp) from 2005–2013 over equatorial East Africa. We note however that a single OT is generally composed of multiple OT pixels (11 on average) and that it can persist for more than 15 minutes, in which case it will be recorded by consecutive satellite images. Sensitivity tests indicate that the treatment of occasionally missing data does not influence our results; we therefore assume that no OTp occur when a satellite image is missing.
The robustness of the prediction system is additionally tested against two precipitation products, which provide valuable information on past events but are not operationally available. We used satellite precipitation estimates from the Tropical Rainfall Measurement Mission product 3B42 (TRMM, Kummerow et al (2000)), available at 0.25 ° spatial and 3 hourly temporal resolution from 1998 to 2013, and from a dynamical downscaling of the ERA-Interim reanalysis with the COSMO-CLM2 regional climate model (Davin and Seneviratne 2012) from 1999–2008. The COSMO-CLM2 simulation is described in Thiery et al (2015); it benefits from high spatial resolution (∼7 km; Docquier et al (2016)), an advanced land surface representation (Akkermans et al 2014) and an interactive lake model (Thiery et al 2014a, Thiery et al 2014b). For the analysis the TRMM data was remapped to the 0.0625 ° resolution COSMO-CLM2 grid using bilinear interpolation. Although TRMM generally outperforms other satellite precipitation products in Uganda and Kenya, the product underestimates extreme precipitation over East Africa (Maggioni et al 2016).
The selection of the three data sets is based on the following considerations: (i) product independence, (ii) coverage of multiple data sources (geostationary and polar-orbiting satellites and state-of-the-art climate modelling), (iii) different proxies for severe weather (OTp and extreme precipitation).
2.2. Statistical model setup
Here we aim to model the probability of extreme thunderstorm nights as a function of afternoon conditions over the surrounding land. We thereby rely on binomial logistic regression, and base our approach on that of Gudmundsson et al (2014) who estimated above-normal wildfire activity from meteorological drought. To start, we define extreme thunderstorm nights as nights during which the total number of OTp over Lake Victoria during 00:00–12:00 East African Time (EAT; 21:00–9:00 UTC) exceeds the 99th percentile (that is, 2236 OTp). This selection criterion was informed by an earlier analysis by Thiery et al (2016) suggesting a particularly strong dependency of this class of OT events on afternoon conditions. From this criterion we construct a binary series of extreme and non-extreme nights. The probability of an extreme night (P(ex)) is subsequently modelled as a function of the total number of OTp over the surrounding land during the preceding day (OTday), such that:
Where β0 and β1 are the model parameters, derived using generalized linear regression (binomial distribution, logit transformation). β0 is the intercept from the linear regression equation and sets the probability for an extreme thunderstorm night when there are no OTp recorded during daytime, whereas β1 is the regression coefficient assigned to the explanatory variable OTday. Here we define OTday as the sum of all OT pixels detected between 12:00 and 18:00 EAT in an area enclosed by the blue rectangle in figure 1(c) but excluding Lake Victoria, thereby following Thiery et al (2016) (hereafter referred to as initial configuration).
By analogy, this setup can be used for forecasting extreme precipitation from TRMM and COSMO-CLM2. In this case, the threshold criterion selecting the 1% most intense nighttime precipitation events are 2.96 mm h−1 and 3.01 mm h−1 for TRMM and COSMO-CLM2, respectively. For each product we additionally construct the persistence forecast, that is, the logistic regression using conditions over Lake Victoria during the previous night (and in the corresponding product) as predictor.
As shown by equation 1, the logistic regression model does not predict the occurrence of an event, in this case an extreme thunderstorm night, but rather the probability of such an event given a certain precursor condition. Users are therefore faced with the challenge of deciding which probability is considered sufficiently large to issue a warning. Once such a threshold probability (θ) is selected, all warnings are automatically derived from the statistical model. By construction, the issued warnings will capture only a fraction of all actual extreme events. This fraction is known as the hit rate (H), and H will increase with decreasing threshold probability. Conversely, a false alarm occurs when a warning is issued without an extreme event actually occurring. The fraction of non-extreme events for which a warning is issued is known as the false alarm rate (F), and F increases with decreasing threshold probability. Increasing H will therefore always be at the expense of increasing F, and vice versa. Depending on the objective of the warning system, acceptable values of H and/or F can substantially vary. It is therefore not possible to present one unique recommendation regarding a most suitable threshold probability.
The trade-off between the hit rate and false alarm rate for different threshold probabilities is visualised in a receiver operating characteristic (ROC) curve. ROC curves that lie above and to the left of the 1:1 line indicate improved forecast skill relative to random guessing, and the better the forecasts, the closer the ROC curve approaches the upper-left corner of the diagram (Wilks 2011). One way to summarise ROC curves using a single scalar value is to compute the Area Under the ROC Curve (AUC), with AUC = 0.5 indicating random guessing and AUC = 1 representing a perfect forecasting system.
A ROC curve can subsequently be analysed to detect threshold probabilities that are relevant from a decision-making point of view. For instance, an 'optimal point' can be selected as the threshold probability that maximises the hit rate while minimizing the false alarm rate (i.e. it sets the highest value of H − F along the ROC curve). Alternatively, false alarm rates for predefined, fixed hit rates can be easily retrieved from ROC curves, and vice versa. Examples of useful information which can be retrieved from ROC curves are listed in table 1.
Table 1. Model parameters and skill scores for the optimized configurations. β0, β1 denote the binomial logistic regression coefficients, PPV and NPV the positive and negative predictive value, respectively. OR, PPV and NPV are defined in the supplementary information.
| Lake Victoria | Sector Uganda | Sector Kenya | Sector Tanzania | |
|---|---|---|---|---|
| Model parameters | ||||
| β0 | −6.7809 | −6.2797 | −5.3512 | −6.5763 |
| β1 | 0.00026 | 0.00044 | 0.0011 | 0.00017 |
| Nighttime (EAT) | 00:00–12:00 | 2:00–8:00 | 17:00–23:00 | 4:00–10:00 |
| Daytime (EAT) | 6:00–21:00 | 5:00–20:00 | 3:00–14:00 | 6:00–21:00 |
| Lead time (h) | 3 | 6 | 3 | 7 |
| Aggregation time (h) | 14 | 14 | 10 | 14 |
| rcrit | 0.15 | 0.15 | 0.10 | 0.10 |
| Model skill | ||||
| AUC | 0.93 | 0.86 | 0.80 | 0.91 |
| OR(H–F max) | 36 | 18 | 11 | 34 |
| H(H–F max) | 0.85 | 0.82 | 0.76 | 0.85 |
| F(H–F max) | 0.13 | 0.20 | 0.23 | 0.14 |
| F(H = 0.5) | 0.04 | 0.05 | 0.11 | 0.05 |
| F(H = 0.9) | 0.21 | 0.42 | 0.43 | 0.20 |
| F(H = 1) | 0.30 | 0.99 | 0.97 | 0.67 |
| PPV(H–F max) | 0.06 | 0.04 | 0.03 | 0.06 |
| NPV(H–F max) | 1.00 | 1.00 | 1.00 | 1.00 |
To obtain an independent measure of storm predictability, we construct the ROC curves using leave-one-year-out cross-validation. During this procedure one year is removed from the time series and the model is fitted to the remaining data. The obtained model is then applied to generate storm predictions for the year which was left out. We subsequently repeat this procedure for all years in the dataset, that is, one-by-one each year is left out from the training data set and predictions are made for this left-out year. As such, we can compile a time series of extreme event predictions without the observed events in a given year contributing to the training of the model for that period. As such this procedure enables an unbiased assessment of model performance (Gudmundsson et al 2014).
2.3. Model optimisation and validation
In a next step we aim at optimising the skill of the forecasting system. Since, out of the three considered data sources, the OT dataset is the only one potentially available in realtime, and thus the only suitable candidate for an operational early warning system, we focus on this product from now onwards. First, we hypothesize that the window defining daytime hours influences predictive skill. Moreover, we expect that some regions contribute more to the predictor time series. This holds, for instance, for those regions characterised by strong orography, and in particular for the eastern lake shore, where intense convection is triggered when the afternoon lake breeze meets the steep mountain slopes and the westward synoptic flow (figures 1(a)–(d), see also Anyah et al (2006) and Ogwang et al (2014)).
We therefore try to optimise the skill by varying three parameters that shape the predictor time series OTday: forecast lead time λ (h), predictor aggregation time μ (h) and a critical rank correlation threshold rcrit used for spatial selection (see below). For each pixel p, we first aggregate all observed OTp in time, such that:
For example, given a lead time λ = 6 h and a predictor aggregation time (i.e. length of the daytime window) μ = 5 h, we sum all OTp observed between 13:00 and 18:00 EAT to obtain a daytime OT time series per pixel (to be used for predicting nighttime OTp between 00:00 and 12:00 EAT). For each pixel we subsequently compute the Spearman rank correlation between the time series of daytime OTp and the time series of nighttime OTp over Lake Victoria. As a final step we select only those pixels with a correlation above the critical threshold rcrit (e.g. figure 1(d)), and calculate the OTday time series as the sum of all daytime OTp over the retained pixels. Positive correlations between daytime OTp on land and nighttime OTp over the lake (figure 1(d)) are associated with the mesoscale circulation which triggers precipitation and extreme thunderstorms on Lake Victoria (section 1).
To test the model sensitivity, we vary λ, μ and rcrit over a range of plausible values (λ: 3 h to 11 h, μ: 2 h to 14 h, rcrit: 0.10 to 0.30). Note that we fix the minimal lead time to 3 h to account for warning transmission time in an operational context. Moreover, for high values of λ and μ the predictor time series extends into the previous night. As an optimisation criterion for selecting the optimal model configuration, we use the maximum AUC. In addition to optimizing the configuration for the whole lake, we also develop optimal configurations for the three lake sectors belonging to different countries (Uganda to the north, Kenya to the east and Tanzania to the south, figure 1).
3. Proof of concept
Figure 2 shows the ROC curves for the three considered data products under the initial configuration. This configuration generally displays high skill, with AUC values of 0.90, 0.85 and 0.92 for the OT, TRMM and COSMO-CLM2 products, respectively. Overall there are significant links between extreme nighttime thunderstorms on Lake Victoria and afternoon storminess over the surrounding land, indicating that information on the latter is a suitable predictor for storm activity on the lake. This is confirmed by sensitivity experiments wherein we relax the definition of an extreme event to nights exceeding the 98th, 97th, 96th and 95th percentile, respectively: the model skill remains very close to the skill of the initial configuration.

Figure 2 Proof of concept of storm predictability. Receiver operating characteristics (ROC) curves showing the trade-off between hit-rate and false-alarm rate for the predictions with difference threshold probabilities of the logistic regression model applied to (a) Satellite-based OT detections during 2005–2013, (b) Satellite-based precipitation observations during 1998–2013 from the Tropical Rainfall Measurement Mission (TRMM; 3B42 product) and (c) Precipitation during 1999–2008 as downscaled from ERA-interim by the regional climate model COSMO-CLM2. Solid red lines indicate ROC curves using afternoon land OTp/precipitation as predictor (initial configuration, see section 2.2), whereas dashed light red lines denote ROC curves of the respective persistence forecast (nighttime lake OTp/precipitation from previous night as predictor). The ROC curve is estimated using leave-one-year-out-cross validation. Curves above the 1:1 line indicate that forecasts outperform random guessing. The black dots mark the location at which the difference between the hit rate and the false alarm rate is maximal. θ marks the threshold probability that was chosen to maximise this difference, H the hit rate, F the false alarm rate and OR the odds ratio at this point. The Area-Under-the-Curve AUC represents the dimensionless area under the ROC curve and is a measure for the overall skill of the regression model.
Download figure:
Standard image High-resolution imageMoreover, the initial configuration substantially outperforms the persistence forecast. For the observational products the persistence forecasts generally show only little added value compared to random guessing. In addition, the skill of the persistence forecast, if any, may partly arise from the seasonal cycle over the region, where wet seasons associated with the ITCZ overpass alternate with dry periods from June to September and January to February (Yang et al 2015). Only in COSMO-CLM2 the persistence forecast attains appreciable skill. Finally, replacing afternoon over-land conditions by afternoon over-lake conditions as predictor also leads to a sharp decrease in predictive skill (not shown), highlighting the importance of mesoscale circulation for triggering extremes on Lake Victoria (Thiery et al 2016).
As an example, in the early hours of 16 May 2006, severe thunderstorms struck Lake Victoria (2436 OTp recorded and over 36 mm of rain observed in 9 h time over the entire lake). According to both the OT and TRMM products this night was as an extreme event, and all three model configurations issued a warning (optimal point). The consistent behaviour of all three data products generally underlines the potential of a data-driven prediction system. It also suggests a positive relationship between strong updrafts (OT detections) and increased precipitation: indeed statistically significant, positive rank correlations are found at night over Lake Victoria between OTp and precipitation from TRMM (0.78, p < 0.001, n = 3287) as well as from COSMO-CLM2 (0.38, p < 0.001, n = 1461).
4. Improving forecast skill
In this section we aim to optimise the regression model configuration to improve forecast skill. The sensitivity of the AUC to variations in forecast lead time, predictor aggregation time and threshold correlation is shown in figures 3(a)–(b). The sensitivity diagrams indicate a clear tendency towards higher skill for shorter lead times, longer aggregation times and less stringent pixel selection. Interestingly, selecting a large number of land pixels is more important for the model skill than selecting pixels which are highly correlated to the conditions on the lake. Overall this suggests that using more information throughout the full extent of daytime hours to construct the predictor time series adds to the forecast skill. However, it is also clear that the sensitivity saturates, with only very limited added value of increasing the aggregation time beyond 10 hours, or of decreasing the threshold correlation below 0.15.
In the optimised configuration, boxplots of afternoon conditions on land associated with extreme and non-extreme nights are clearly separated, and this feature is captured by the logistic regression (figure 3(c)). The best model has an AUC of 0.93 and is constructed using a lead time of 3 h, a predictor aggregation time of 14 h and a rank correlation of 0.15 (table 1). It represents a small yet noticeable increase in model skill relative to the initial configuration, in particular when considering low false alarm rates (compare ROC curves in figure 2(a) and figure 3(d)). Taking a threshold probability θ of 0.0129, for instance, enables the prediction of 28 out of a total 33 extreme events between 2005 and 2013 (H = 85%), while having a false alarm rate of 13%. The associated odds ratio (OR) is 36, meaning that during days with P(ex) > 0.0129, the odds of an extreme night are 36 times higher than during other days. However, as the false alarm rate is still considerable in this case (a false alarm is issued almost once per week here), a user may prefer to pre-set a higher threshold probability. In that case it is, for instance, possible to forecast 50% of all extreme events while having a false alarm only about once per month (table 1).

Figure 3 Optimizing the prediction system. (a) Area-Under-the-Curve AUC versus forecast lead time for various threshold correlations (predictor aggregation time = 14 h). (b) Area-Under-the-Curve AUC versus predictor aggregation time for various threshold correlations (lead time = 3 h). Rank correlation thresholds are indicated for each line. Orange dots in (a) and (b) indicate the best model, i.e. the model with the highest AUC. (c) Logistic regression with optimised lead time (3 h), predictor aggregation time (14 h) and rank correlation threshold (0.15), modelling the probability of extreme nighttime OT detections on Lake Victoria as a function of afternoon OTp over selected land pixels (line: best estimate, shaded area: 95% confidence interval). Boxplots indicate the distribution (median, interquartile range) of the afternoon land OTp associated with non-extreme (blue) and extreme (red) nights. Whiskers extend to the last value located within a distance of 1.5 times the interquartile range from the 25th and 75th quantile, respectively. (d) Receiver operating characteristics (ROC) curve associated with the optimised logistic regression model shown in (c) (compare to figure 2(a)).
Download figure:
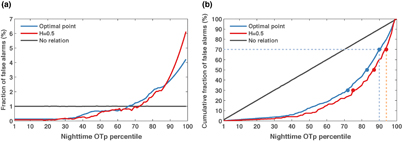
Standard image High-resolution imageAlthough false alarms do occur, they clearly tend to capture intense storm nights rather than calm nights (figure 4(a)). For instance, 30%, 50% and 70% of all false alarms correspond to nights with OTp above the 90th, 83th and 72th percentile, respectively (optimal point; figure 4(b): blue dots). The same conclusion can be made when choosing a different threshold probability. For instance, when choosing the threshold probability such that half of all extreme events are captured (i.e. H = 0.5), 30%, 50% and 70% of all false alarms lie above the 94th, 87th and 75th nighttime OT percentile (figure 4(b): red dots). Thus, while false alarms, per definition, miss the 1% most intense thunderstorm nights, they nonetheless often predict nights with strong thunderstorm activity. Overall this indicates that also false alarms contain valuable information for intense storm prediction. Here we note that a systematic recording of boating incidents would be very useful to further analyse the skill of our prediction system, and in particular the role of false alarms. However, such systematic reporting is currently still lacking.
Figure 4 False alarm behaviour. (a) False alarms binned against nighttime OT pixel counts using a bin width of 1%. Blue and red lines indicate two different selection criteria (optimal point and hit rate fixed to 0.5, respectively), whereas the grey line denotes the behaviour in case there would be no relation between false alarms and nighttime storm intensity. Curves were smoothed using Savitzky-Golay filtering (order = 2, window = 27; Savitzky and Golay (1964)). (b) same as a, but now showing the cumulative fraction. As an example, the stippling lines indicates that 30% of all false alarms lie above the 90th and 94th nighttime OT percentile for the optimal point ans H = 0.5 cases, respectively.
Download figure:
Standard image High-resolution image
As storms typically develop in the eastern part of the lake and intensify as they are advected westward along the trade winds (Thiery et al 2016), the diurnal thunderstorm cycle varies between the different lake sectors. In Sector Kenya (northeast), storm activity peaks in the late afternoon, whereas the diurnal cycle attains a maximum during early and late night in the Sector Uganda (north) and Sector Tanzania (south), respectively (figure 1(b); supplementary figure 1). Given these strong differences and the need to facilitate warnings at the country scale, it is appropriate to apply the optimisation procedure to each individual sector. The results overall indicate similar skill compared to the whole lake case, albeit a small reduction in skill owing to the reduced information content in the predictant time series and the imposed minimum lead time (supplementary figures 2–4 and table 1).
5. Towards operational warnings
Building on previous analyses, a software package was developed for Matlab and GNU Octave to enable automated extreme storm predictions over Lake Victoria in operational mode. Version 1.0 of the package, termed Lake Victoria Intense storm Early Warning System (VIEWS), is available at http://github.com/wthiery/VIEWS and is released under the MIT licence. At this stage the prediction system needs to be considered as a prototype; more research as well as input from the user community is needed to improve its skill, strengthen the links to societal losses (e.g. Semazzi and Mera (2006)), assess uncertainties (e.g. Lhermitte et al (2010)), and test its applicability to other tropical lakes. In particular, the African Great Lakes in East Africa and Lake Maracaibo in Venezuela experience similar thunderstorm dynamics (figures 1(a)–(b); Albrecht et al (2016)). Thus, communities living around these lakes may eventually also benefit from satellite-based storm warning systems.
At forecast lead time, the software first reads in the OT images corresponding to the daytime hours. It subsequently computes the predictor value OTday for each country and for the whole lake by performing the appropriate spatial and temporal selection (see equation 2 and table 1). The OTday values then serve as input for the respective logistic regressions (see equation 1), yielding the probability for an extreme event. The operational statistical model employs the logistic regression coefficients derived for the optimal configuration for the whole lake and the individual lake sectors (see table 1 and section 4). Depending on the threshold probability defined by the user, the software will indicate whether or not a warning is to be issued for a specific lake sector or the whole lake.
6. Summary and discussion
In this study we present a new approach to predict hazardous thunderstorm activity over Lake Victoria. The prediction system, called VIEWS, relies on logistic regression to forecast the 1% most extreme thunderstorm nights based on observed afternoon land conditions, and is designed to complement and support ongoing efforts from the Numerical Weather Prediction (NWP) community in the region. VIEWS demonstrates substantial skill during the 2005–2013 hindcast period, especially relative to persistence forecasts. As it builds on predictability inherent to the lake-land breeze system, predictive skill is identified for different proxy variables for thunderstorm activity (Overshooting Top pixels (OTp) and extreme precipitation) as well as for different data sources (satellite products and dynamically downscaled reanalysis). Optimizing the OT configuration for the whole lake and individual sectors yields a small yet noticeable increase in skill.
This is a pilot study describing a new, experimental prediction system, and future research should aim at overcoming its current limitations. For instance, forecast skill may be further increased through the use of other environmental parameters, such as cloud cover, surface temperatures, wind velocities or atmospheric profiles. Those fields could be derived from remote sensing, but also from NWP output (e.g. Chamberlain et al (2014)) or in-situ measurements (e.g. Jacobs et al (2016a), Jacobs et al (2016b)) resulting in hybrid forecast products. Enhanced predictive skill may also be achieved by accounting for large-scale teleconnections and their influence on inter-annual circulation variability in East Africa (e.g. Hawinkel et al (2016), Souverijns et al (2016)). Another option could be to increase the information content of the forecast by using other regression-based statistical tools that describe the full OT distribution (rather than predicting the probability of occurrence of an extreme event). In this case predictions can also be made on a continuous scale, or be separated into different categories of thunderstorm intensity (e.g. light, moderate, strong and extreme).
Finally, to implement and improve VIEWS as well as other warning systems for the region, it will be of key importance to collect experiences from the user community. Besides identifying impact-relevant parameters, users may also help to establish optimal operating points of scientific warning systems. Together with user input and high-resolution NWP, regression-based models have the potential to substantially reduce the vulnerability of local communities around Lake Victoria.
Acknowledgments
We acknowledge the CLM-community (clm-community.eu) for developing COSMO-CLM2 and making the model code available, and Hans-Jürgen Panitz for providing the lateral boundary conditions. In addition, we are grateful to NASA and JAXA for developing the TRMM-3B42 dataset. WT was supported by an ETH Zurich postdoctoral fellowship (Fel-45 15-1). The Uniscientia Foundation and the ETH Zurich Foundation are thanked for their support to this research. The Belgian Science Policy Office (BELSPO) is acknowledged for the support through the research project EAGLES (CD/AR/02A). Computational resources and services used for the COSMO-CLM2 simulations were provided by the VSC (Flemish Supercomputer Center), funded by the Hercules Foundation and the Flemish Government—department EWI. MSG SEVIRI data used to produce the OT detections were provided by the University of Wisconsin-Madison Space Science and Engineering Center. OT detection product development was supported by the GOES-R Aviation Algorithm Working Group and GOES-R Risk Reduction Research Program. All materials that have contributed to the reported results are available through GitHub or upon request. Correspondence and requests for materials should be addressed to WT (wim.thiery@env.ethz.ch).