

Abstract
A growing body of evidence suggests that criminal activities associated with drug trafficking networks are a progressively important driver of forest loss in Central America. However, the scale at which drug trafficking represents a driver of forest loss is not presently known. We estimated the degree to which narcotics trafficking may contribute to forest loss using an unsupervised spatial clustering of 15 spatial and temporal forest loss patch metrics developed from global forest change data. We distinguished anomalous forest loss from background loss patches for each country exhibiting potential 'narco-capitalized' signatures which showed a statistically significant dissimilarity from other patches in terms of size, timing, and rate of forest loss. We also compared annual anomalous forest loss with the number of cocaine shipments and volume of cocaine seized, lost, or delivered at country- and department-level. For Honduras, results from linear mixed effects models showed a highly significant relationship between anomalous forest loss and the timing of increased drug trafficking (F = 9.90, p = 0.009) that also differed significantly from temporal patterns of background forest loss (t-ratio = 2.98, p = 0.004). Other locations of high forest loss in Central America showed mixed results. The timing of increased trafficking was not significantly related to anomalous forest loss in Guatemala and Nicaragua, but significantly differed in patch size compared to background losses. We estimated that cocaine trafficking could account for between 15% and 30% of annual national forest loss in these three countries over the past decade, and 30% to 60% of loss occurred within nationally and internationally designated protected areas. Cocaine trafficking is likely to have severe and lasting consequences in terms of maintaining moist tropical forest cover in Central America. Addressing forest loss in these and other tropical locations will require a stronger linkage between national and international drug interdiction and conservation policies.
Export citation and abstract BibTeX RIS

Original content from this work may be used under the terms of the Creative Commons Attribution 3.0 licence.
Any further distribution of this work must maintain attribution to the author(s) and the title of the work, journal citation and DOI.
1. Introduction
While forest loss rates have declined in some Latin American countries over the past two decades, the pace of net forest loss in Central America has accelerated (Clark et al 2012, Redo et al 2012, Kim et al 2015). In Central America, land settlement, logging and subsistence farming have long been well-understood drivers of forest change (Geist and Lambin 2002, Rudel et al 2009). In contrast, the role of drug trafficking as a driver of forest loss has only recently begun to be recognized (Nelleman 2012, McSweeney et al 2014, McSweeney 2015, Hodgdon et al 2015, also see appendix A available at stacks.iop.org/ERL/12/054015/mmedia). Drug-trafficking and related criminal activities appear to have become important drivers of forest loss in Central America since the early 2000s (McSweeney et al 2014). Aggressive US-led interdiction activities in Mexico and the Caribbean caused traffickers to increasingly concentrate cocaine shipments through the Central American corridor (UNODC 2012). Extensive and remote forest areas with poor socioeconomic development are particularly attractive to drug traffickers and thus vulnerable to associated land use changes (UNODC 2012, McSweeney et al 2014, PRISMA 2014, McSweeney 2015).
Roughly 86% of the cocaine trafficked globally moves through Central America on its way to consumers, leaving an estimated $6 billion US dollars in illegal profits in the region annually (UNODC 2010, online supplementary appendix A [1]). Cocaine transiting countries such as Nicaragua, Honduras and Guatemala has equated to as much as 14%, 13% and 10% of the gross domestic product (GDP) respectively, but remains a smaller part of the Panamanian economy (1% GDP, UNODC 2012). Therefore, a need to launder drug trafficking revenues has substantially increased in Central America (Department of the Treasury 2015). When cocaine is trafficked through Central America, the conversion from forest to agricultural land uses is sometimes used to legitimize illicit profits in the legal economy (McSweeney et al 2014).Traffickers launder money through land use changes that can include cattle ranching, agro-industrial plantations such as African palm, or for illegal timber extraction (Richards et al 2003, Grandia 2013, appendix A [17]), and to a lesser degree mining, clandestine airstrips, road construction, housing, and tourism infrastructure (Austrac 2010, Nelleman 2012, Hodgdon et al 2015, appendix A [16, 24, 26]). Thus, while cocaine is currently only trafficked through Central America (i.e. coca from which cocaine is derived is not cultivated in the region), the impact of this activity on forest environments particularly through forest conversion to pasture for cattle as a means to launder drug profits can be significant (McSweeney et al 2014, appendix A [5]). This differs from the forest loss that takes place upstream in the commodity chain related to clandestine coca cultivation, as in Colombia, Peru, and Bolivia (Dávalos et al 2011, Armenteras et al 2013).
Despite widespread reporting of the devastating and lasting effects of cocaine trafficking activities on Central America's environment, rural and indigenous livelihoods, human security, and, by extension, global biodiversity and carbon stocks globally (Pelletier et al 2012, McSweeney et al 2014, UNFCCC 2015, appendix A [5, 17, 26]), there has been no estimate to date of the potential share of Central American forest loss that may be indirectly attributed to cocaine trafficking. Absent such data, it becomes difficult to advise both national and international drug and conservation policy to achieve desired conservation and socioeconomic outcomes (McSweeney 2015).
In this paper, we examine potential relationships between cocaine trafficking activities and forest loss by using a spatially explicit mapping approach based on a novel set of spatial and temporal forest loss metrics. We hypothesized that compared with low-input smallholder farming at the forest frontier (Rudel et al 2009), drug traffickers' 'footprint' will reflect their high degree of illicit capitalization and related ability to monopolize rural land and labor, yielding anomalously large, remote (i.e. far from roads), and rapid forest clearing (Fearnside 2008). We further hypothesized that inflections in anomalous forest loss over the past two decades were coincident with increased cocaine trafficking through Central America, discussed in detail below. Our objectives were therefore to: (1) develop a set of quantifiable spatial and temporal characteristics for detecting anomalous forest loss patterns, (2) determine the relationship between anomalous forest loss and the timing of increased cocaine trafficking along principal cocaine trafficking routes and transshipment nodes, and (3) where feasible, estimate the impact of drug trafficking on forest loss while recognizing other factors such as increased agro-industrialization, illegal logging, and other disturbances that can influence forest cover change in the same frontiers were drugs are trafficked (Rudel et al 2009).
2. Materials and methods
2.1. Study area
We focused on six Central American countries (Guatemala, El Salvador, Honduras, Nicaragua, Costa Rica, and Panamá) where cocaine is known to be trafficked (UNODC 2012, figure 1). Following interdiction efforts in the eastern Caribbean in the mid-2000s, traffickers moved less cocaine through countries such as the Dominican Republic and Jamaica and increased shipments through Central American routes (figures 2(a) and (b)). The Central American corridor has become the principal 'bridge' for cocaine being moved to North America from South America, either by primary routes (maritime or air shipments directly from South America to locations such as Guatemala's remote Petén region, appendix B1) or via secondary, often overland, routes (UNODC 2012, 2014). Of the six countries, Honduras, Guatemala, and Nicaragua have the largest areas of remaining lowland moist tropical forest, and also posted the highest rates of forest loss in Central America between 2000 and 2013 (Clark et al 2012, Hansen et al 2013).
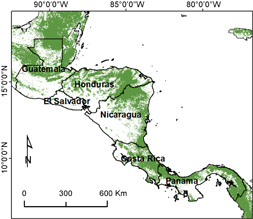
Figure 1 Central American study area and 2012 forest cover within focal countries (green) estimated from Moderate Resolution Imaging Spectroradiometer (MODIS) imagery (Channan et al 2014).
Download figure:
Standard image High-resolution image2.2. Forest loss data
To analyze patterns and potential drivers of anomalous forest loss, we required readily available, spatially explicit, validated, and high resolution forest loss data transferable to each of the six countries covering the period before and after Central America became an important drug transshipment hub circa. 2005 (UNODC 2012). We obtained data on forest changes from the University of Maryland Department of Geographical Sciences Global Forest Change website (http://earthenginepartners.appspot.com/science-2013-global-forest, accessed 3/2015 to 11/2015). In this dataset, digital forest loss and gain time series data depict annual forest loss and potential recruitment between 2000 and 2014 derived from time-series Landsat Thematic Mapper, Enhanced Thematic Mapper, and Operational Land Imager satellite imagery at a 30 m grid cell size. Cloud-free time series earth observations were employed to characterize forest cover change within a given climate domain, ecological setting, and country (Hansen et al 2013). These data provided information to summarize annual forest change beginning in the year 2000 within specified countries and tree canopy densities. Annual forest loss data allowed us to develop patch metrics, described below, to contrast spatial and temporal forest loss patterns for specific countries and sub-regions with known drug trafficking centers. Also important to our analyses was the ability to quantify forest loss patterns before and after increased drug trafficking to Central American countries for making temporal comparisons and testing hypothesized differences.
2.3. Data on drug trafficking
Through the Office of National Drug Control Policy (ONDCP), we acquired estimates of cocaine flows through the six countries for 2000 to 2014. These data were extracted upon request from the Consolidated Counter Drug Database (CCDB), which is managed by the US Interdiction Coordinator and considered the best source for estimates of cocaine flow through the Central American corridor (GAO 2002). We used two metrics from this dataset: (a) the annual number of so-called 'primary movements' of cocaine entering a given country by plane or boat, directly from South America, and (b) the annual quantity of cocaine detected within specific sub-regions of interest (i.e. those that ancillary data or reports suggested were locations where drug trafficking was concentrated). 'Cocaine detected' is the sum of kilograms (kg) of cocaine seized, delivered or lost (hereafter 'cocaine SDL') within a given sub-national region. Cocaine seizures included kg of cocaine confiscated by law enforcement; delivered cocaine was shipments that were known to have been received within a given sub-national region. Kilograms 'lost' represents cocaine discarded over land or sea or otherwise lost during counter narcotics operations. Both metrics were considered highly conservative proxies or estimates for actual cocaine flows through Central America during the study period.
2.4. Forest loss analyses
To compare forest loss levels in each country, we summarized annual loss rates following Puyravaud (2003) using country-scale forest loss data reported in Hansen et al (2013). For analyses we used the annual forest loss data layer subset to each country boundary. We included only forest loss patches ≥2 ha to remove isolated loss pixels that could be attributed to sensor noise (Song et al 2001) or other factors, and to reduce the number of minor patches (polygons) entering into our analysis. Once we converted forest loss patches to individual polygons, we characterized each according to 15 patch metrics (table 1). Patch metrics were expected to help distinguish background types of forest loss (e.g. by smallholders) from anomalous clearings. We anticipated that unusually large, remote, and rapid forest clearing could reveal forest loss hot-spots that are spatially and temporally correlated with high cocaine trafficking activity. To examine anomalous forest loss patterns, we used a multivariate and self-organized mapping approach and spatial clustering based on patch similarity (Kohonen 1998, Vesanto and Alhoniemi 2000). We used patch metrics and Euclidean distance for clustering patches to statistically distinguish unique classes or forest loss groups. Therefore, forest loss patches were categorized by the similarity of patch metrics describing the rate, timing, and size of forest areas cleared (table 1). We determined the optimum number of forest loss groups using 15 iterations and the maximum pseudo F-statistic to select groups exhibiting similar loss patterns. To avoid overfitting, the second largest maximum pseudo F-statistic was used in cases when only two groups were defined as optimum, which tended to produce broad categories lacking a strongly anomalous forest loss group. No spatial constraints were imposed with the exception of conducting analyses independently within each country's own geopolitical setting. The proportion of variance explained by each of the 15 patch metrics was used to identify one or more strongly anomalous forest loss groups. Spatial analyses and summary statistics for each individual country were developed using Spatial Statistics Tools for mapping clusters in ArcGIS v. 10.3.1 (ESRI 2015) and the Geospatial Modeling Environment software package v. 0.7.4 (Beyer 2015).
Table 1. Spatial and temporal patch variables derived from 2000 to 2013 forest loss data from Hansen et al (2013) that was used to determine anomalous forest loss patches.
| Variable Name | Abbreviation | Description |
|---|---|---|
| Hectares | Hectares | Total number of hectares of forest loss in an individual patch |
| Minimum year | Min_year | The first year of forest loss in a patch |
| Maximum year | Max_year | The last year of forest loss in a patch |
| Majority year | Maj_year | The majority year of forest loss pixels in a patch |
| Distance from closest patch | Dist | The minimum distance away from another forest loss patch center |
| Total range of years deforested | Range_year | The range of years when forest loss was first detected to the last date detected in a patch |
| Starting number of hectares deforested | Start_ha | The number of hectares deforested in the first year of forest loss |
| Ending number of hectares deforested | End_ha | The number of hectares deforested in the last year of forest loss |
| Adjusted range of years deforested | Adj_range | Number of years when forest loss was detected in a patch |
| Maximum change in hectares per year | Max_chg_ha | The maximum number of hectares deforested in a single year and patch |
| Minimum change in hectares per year | Min_chg_ha | The minimum number of hectares deforested in a single year and patch |
| Mean change in hectares per year | Mean_chg_ha | The mean number of hectares deforested in a patch |
| Standard deviation change in hectares per year | SD_chg_ha | The standard deviation of the number of hectares deforested in a patch |
| Change rate for a patch | Chg_rate | The rate of forest loss within a patch based on starting and ending number of hectares and adjusted range of years |
| Change coefficient of variation | Chg_cv | Coefficient of variation using the mean change per year/standard deviation x 100 |
aIndividual patches are contiguous areas ≥2 ha that have been deforested between 2000 and 2013.
To observe differences between anomalous and background forest cover loss, we used non-metric multidimensional scaling (NMDS) in the vegan package in v. 2.4-1 in the R statistical software v. 3.2.2 (R Core Team 2015) and Bray–Curtis similarly to ordinate patches with respect to forest loss metrics (McCune and Grace 2002). Ordinations were run using a random selection of forest loss patches (n ≤ 200 per category) and random starting point using 100 iterations or until convergence on an optimal solution.
To evaluate the potential impact of cocaine trafficking for each country on forest loss, we used a Before-After-Control-Impact (BACI) approach to examine the 'difference in differences' between anomalous and background patches (Conquest 2000). For these analyses, we used linear mixed effects (LME) models in the lme4 v.1.1-12 package for R statistical software (Bates et al 2015) and then analysis of variance (ANOVA) applied to results of model fit for effects tests. The advantages of LME models are that they can include both fixed and random effects, do not assume independence among observations, and the number of observations can differ over time. These methods were used to statistically test hypothesized impacts of increased cocaine trafficking on forest loss by comparing anomalous and background forest loss before and after 2005. The year 2005 was selected because of the large and continued increase in cocaine shipments through Central America (figures 2(a) and (b)) although there is some evidence that trafficking increased for Guatemala prior to 2005 (figure 2(b), appendix B1). We used the mean number of hectares of forest lost per deforestation patch per year as the response variables and group (anomalous vs. background forest loss) and period (pre- and post-2005) as explanatory variables to observe fixed effects. Random effects were year and sub-regions where a majority of anomalous forest loss was detected. Sub-regions were treated as a random effect because the amount of cocaine detected varied between them over time according to counter narcotics data. The BACI contrast estimate was also used to help determine the degree of difference between anomalous and background forest loss before and after 2005 with the following equation:
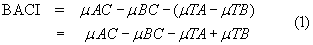

Figure 2 Annual trends for verified primary cocaine movements transported from South America to locations in (a) Central America, Mexico and the Caribbean and (b) Mexico and Central American countries taken from the Consolidated Counterdrug Database. El Salvador is not shown owing to several years with no data.
Download figure:
Standard image High-resolution imageWhere μAC is considered the mean control (mean annual background forest loss for patches) after increased cocaine trafficking, μBC is the mean treatment (mean annual anomalous forest loss for patches) before increased trafficking, μTA is the mean treatment after increased trafficking, and μTB is the treatment before increased trafficking. Following Schwarz (2015), we used the estimated least squares marginal means of the four combinations, anomalous versus background and period (before and after), from LME model results to calculate the BACI contrast estimate or 'difference in differences'.
We anticipated that both group and period would be significantly different between anomalous and background forest patches. In addition to other supporting information, a significant interaction between group and period and BACI contrast estimate would also suggest the impact of increased narcotics trafficking on forest loss after 2005. A critical assumption of BACI analyses was that forest loss in each country was at equilibrium prior to increased cocaine trafficking. We discuss model assumptions and interpretation of results relative to time-series forest loss and other data presented for each country.
Anomalous forest loss patches may also result from legally permitted timber management concessions and other disturbance factors such as fire and insect outbreaks (Radachowsky et al 2012, Cole et al 2014). We used published studies, national land cover data, ministry records, and reports to ascertain which activities were most likely to be in play in a given landscape. High spatial resolution imagery was accessed via Digital Globe Enhanced View webhosting service (www.digitalglobe.com/products/enhancedview-web-hosting) and the ImageConnect add-in v. 5.1 for ArcGIS to visually distinguish factors such as crop rotation from anomalous forest loss. Visual verification was confined to only a few sub-regions with isolated anomalous loss patches that were likely the result of crop rotation within extensive African oil palm (Elaeis guineensis), fruit or timber plantations.
For further exploration of spatio-temporal relationships between patterns of drug trafficking and forest loss, we directly compared annual counter narcotics data to anomalous and background forest loss. To interpolate missing years in the CCDB data and account for false-positive or false-negative annual forest loss, we used a trend analysis and quantitatively constrained smoothing splines via linear programming (He and Ng 1999). Both Pearson and Spearman correlation coefficients were used to evaluate relationships between annual drug trafficking data and forest loss rates using fitted spline values (Hauke and Kossowski 2011). To determine the annual proportion of national forest loss that is potentially related to narcotics trafficking, we used the Constrained B-Splines (COBS) package v. 1.3-1 (Ng and Maechler 2015) in the R statistics package v. 3.2.2 (R Core Team 2015). Lastly, anomalous forest loss was used to estimate the annual percentage of national forest loss potentially related to cocaine trafficking activities only in locations with confirmed high trafficking rates and possible linkages between money laundering and land use change. Our analyses were further informed by news media, published reports, and other documentation that we consolidated to relate or discount narcotics trafficking as a land use change factor in Central American landscapes (see appendix A).
3. Results
3.1. Country-scale forest loss rates
Accounting for density of tree cover (consistent with native forest cover), we found that annual gross forest loss rates were highest for Guatemala, Nicaragua, and Honduras (between −0.92% yr−1 to −0.48% yr−1 in areas with >25% tree cover, respectively) (table 2a, b). Guatemala and Nicaragua showed greater forest loss in areas within ≥75% tree cover, although Honduras and Panamá also lost a substantial amount of dense tree cover, well above that of El Salvador and Costa Rica (table 2(b)). Although assessing forest gain which can possibly offset forest loss was not a part of this study, total forest gain was substantially greater in each country compared to total forest loss (table 2(a)). Redo et al (2012) observed that gains in Guatemala, Honduras, Nicaragua and El Salvador can, in part, be explained by forest recovery in dry tropical or coniferous forest regions. This and other recent land cover change studies found that forest loss often occurred at a net loss of moist tropical forest cover with low recruitment of secondary forest (Clark et al 2012, Redo et al 2012, Kim et al 2015). Clark et al (2012) reported a net loss of moist tropical forest (e.g. woody and mixed woody vegetation) for Central American countries and a potential net gain in industrial palm and timber plantations between 2000 and 2010.
Table 2. Forest change estimates from Hansen et al (2013) and forest cover loss rates calculated for six Central American countries.Reprinted with permission from AAAS. (a) Country-scale forest/tree cover gain and loss (km2) between 2000 and 2013 within 4% tree cover classes.
| Tree cover 2000 | Loss within tree cover | ||||||||||
| Country | Years | Total gain | Total loss | <25% | 26%–50% | 51%–75% | 76%–100% | <25% | 26%–50% | 51%–75% | 76%–100% |
| Guatemala | 13 | 8883 | 1094 | 29 734 | 8709 | 11 952 | 57 571 | 105 | 323 | 1097 | 7357 |
| Nicaragua | 13 | 8225 | 662 | 39 402 | 8527 | 12 384 | 58 289 | 109 | 230 | 650 | 7236 |
| Honduras | 13 | 4860 | 582 | 32 713 | 11 870 | 14 297 | 52 664 | 84 | 238 | 560 | 3978 |
| El Salvador | 13 | 567 | 86 | 9961 | 2231 | 3309 | 4710 | 25 | 56 | 206 | 280 |
| Panamá | 13 | 2675 | 323 | 16 563 | 3089 | 4854 | 49 687 | 35 | 69 | 262 | 2308 |
| Costa Rica | 13 | 1653 | 382 | 11 327 | 2752 | 5663 | 31 183 | 28 | 68 | 200 | 1356 |
| (b) Country-scale percent tree cover change within 3% tree cover classes between 2000 and 2013. | |||||||||||
| Country | Total loss/total land area (excluding water) (%) | >25% tree cover loss/year 2000 >25% tree cover (%) | >50% tree cover loss/year 2000 >50% tree cover (%) | >75% tree cover loss/year 2000 >75% tree cover (%) | Total gain/year 2000 >50% tree cover (%) | >50% loss + total gain/2000 >50% tree cover (%) | Previous column less double counting pixels with both loss and gain (%) | Forest/tree cover loss (%/yr) |
|||
| Guatemala | 8.2 | 11.2 | 12.2 | 12.8 | 1.6 | 13.7 | 13.4 | −0.92 | |||
| Nicaragua | 6.9 | 10.2 | 11.2 | 12.4 | 0.9 | 12.1 | 12 | −0.83 | |||
| Honduras | 4.4 | 6.1 | 6.8 | 7.6 | 0.9 | 7.6 | 7.6 | −0.48 | |||
| El Salvador | 2.8 | 5.3 | 6.1 | 5.9 | 1.1 | 7.1 | 7.1 | −0.42 | |||
| Panamá | 3.6 | 4.6 | 4.7 | 4.6 | 0.6 | 5.3 | 5.2 | −0.36 | |||
| Costa Rica | 3.2 | 4.1 | 4.2 | 4.3 | 1 | 5.3 | 5.1 | −0.32 | |||
aForest/tree cover change rate calculated following Puyravaud (2003) for tree cover >25% considering forest loss only.
3.2. Anomalous forest loss
The total number of forest loss patches ≥2 ha identified in our analyses were 5500 (El Salvador), 16 823 (Costa Rica), 18 026 (Panamá), 36 322 (Honduras), 49 080 (Guatemala), and 69 093 (Nicaragua). We found that the countries (Guatemala, Honduras, and Nicaragua) with extensive, remote, and dense forest cover (≥50 000 km2 w/tree cover >75%) showed strong anomalous forest loss patterns, as did Panamá (table 3; see appendix C: tables 1–6 for country-level results). Overall, we found evidence that anomalous forest loss patches were substantially larger, cleared more rapidly, and were more remote in some locations than we would expect in landscapes dominated only by more typical forms of smallholder-driven land settlement (table 3). We determined that anomalous forest loss peaked between 2005 and 2009 (the 'majority years' for anomalous patches). This timing appeared coincident with that of increased cocaine flow through Central America (figures 2(a) and (b)). These results were not universal, however. For example, we found little evidence of anomalous forest loss in El Salvador, which had the lowest amount of dense forest cover out of the six counties studied (table 2(a)). In Costa Rica, we observed that anomalous forest loss was primarily the result of harvest activity within tree plantations, trees in pasture, or changes identified as crop rotation using detailed land cover data (Sesnie et al 2008, Fagan et al 2013). Relative to forest loss in other Central American countries, both El Salvador and Costa Rica showed minor differences between background and anomalous deforestation patch metrics (data not shown). In what follows, we focus only on countries and sub-regions where we detected higher rates of forest loss and more strongly anomalous forest loss primarily within high-density moist tropical forest landscapes.
Table 3. Summary of anomalous forest loss groups and patch metrics by country. Anomalous forest loss associated with clearing native forest was not identified for El Salvador and Costa Rica.
| Patch attribute | Honduras (n = 780) | Guatemala |
Guatamala |
Panamá (n = 110) | Nicaragua (n = 646) |
|---|---|---|---|---|---|
| Hectares | 102.0(135.2) | 7979.4(3146.8) | 1748.2(1089.0) | 226.3(232.0) | 179.7(138.3) |
| Min_year | 2004(3.6) | 2001(0.0) | 2001(1.2) | 2002(2.7) | 2001(1.6) |
| Max_year | 2012(2.1) | 2013(0.0) | 2012(0.8) | 2012(2.1) | 2013(1.5) |
| Maj_year | 2008(3.6) | 2005(2.0) | 2006(3.0) | 2007(2.7) | 2009(3.0) |
| Dist | 750(301.7) | 1817.8(693.6) | 1273.3(655.6) | 864.5(313.0) | 56.2(30.3) |
| Range_year | 8.0(4.0) | 12(0.0) | 11.5(1.7) | 9.6(3.2) | 11.8(2.3) |
| Start_ha | 12.2(15.3) | 546.6(306.5) | 53.8(68.7) | 15.3(18.0) | 9.8(20.8) |
| End_ha | 12.6(14.9) | 70.0(29.7) | 79.7(168.3) | 10.9(14.9) | 12.1(18.7) |
| Adj_range | 6.9(3.8) | 13.0(0.0) | 12.2(2.3) | 9.1(3.6) | 10.2(328) |
| Max_chg_ha | 40.6(30.8) | 1905.5(649.1) | 5509(314.3) | 78.4(57.5) | 72.76(57.1) |
| Min_chg_ha | 3.5(8.7) | 57.8(23.7) | 8.4(14.8) | 2.6(7.5) | 0.85(2.5) |
| Mean_ch_ha | 15.0(11.4) | 613.8(242.1) | 143.6(84.6) | 24.2(16.7) | 17.0(10.6) |
| SD_chg_ha | 12.8(9.7) | 582.3(244.1) | 158.3(88.0) | 24.7(17.6) | 21.9(15.7) |
| Chg_rate | 0.018(0.7) | −0.144(0.10) | −0.0565(0.47) | −0.11(0.6) | 0.04(0.39) |
| Chg_cv | 98.9(45.0) | 96.9(14.5) | 119.3(48.7) | 110(39.5) | 130.11(38.82) |
a,bGuatemalan anomalous forest loss patches were divided into two similar groups, however n = 5 patches were very large that were cleared over a greater number of years. cNicaraugan anomalous forest patches were also divided into two separated groups with n = 11 large patches shown in appendix B: table 2.
For Honduras, a single anomalous group stood out as a strong outlier when we compared patch metrics for anomalous and background loss groups (appendix C: table 1). The average forest loss patch-size for was more than ten times greater than all others and showed higher annual rates of change, and otherwise were well discriminated from other forest loss patches. Within Honduras, we found that the departments of Gracias a Dios, Colón, and Olancho had the largest percentage of anomalous forest loss (figure 3(a)).
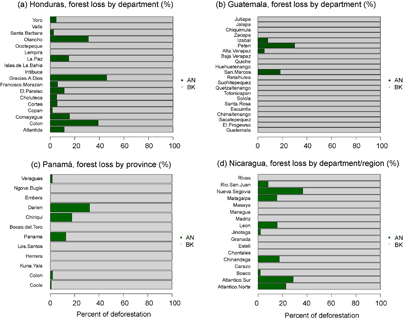
Figure 3 Percent of total anomalous (AN) and background (BK) forest loss for departments in (a) Honduras, (b) Guatemala, (c) Panamá, and (d) Nicaragua.
Download figure:
Standard image High-resolution imageGuatemala showed the highest forest loss rate among the six countries (−0.92% yr−1) and exhibited more complex forest loss patterns with many large (>1000 ha) isolated forest patches cleared. As such, we found that two groups (groups 3 and 4) showed anomalous forest loss patterns (appendix C: table 2) that were characterized by the most extensive forest areas cleared as well as the largest mean number of hectares cleared annually between 2000 and 2013 (table 3). Anomalous forest loss was found within the departments of Petén, Izabal, San Marcos and Alta Verapaz, with 'group 3' anomalous forest loss found only in the Petén (figure 3(b), appendix C: table 2). Overall, the Petén accounted for 75% of Guatemala's total forest loss between 2000 and 2013, totaling a loss of 511 058 ha for patches ≥2 ha. According to land cover data from 2001 and 2010, anomalous forest loss in San Marcos was attributed to change dynamics (e.g. crop rotation) within previously established African palm and other fruit tree plantations in the lowlands.
While Panamá's low forest loss rate (−0.36% yr−1) was similar to that of Costa Rica (−0.32% yr−1), Panamá's land cover data show that 70% of total forest loss was detected in the provinces of Darién, Chiriquí, and Panamá, as was a majority of anomalous forest loss (figure 3(c)). Anomalous forest loss patches were, on average, more than 24 times greater in size than forest loss observed in other groups (appendix C: table 3). In the Chiriquí province, 2000 and 2012 thematic land cover data indicated most anomalous forest loss was likely attributed to clearing and re-planting within plantations of African oil palm and other palms such as Euterpe edulis and Bactris gasipaes. Anomalously large forest loss patches detected were mapped as agricultural use in 2000 and oil palm or crop residue in 2012 according to land cover data for Panamá. Therefore, the majority of anomalous forest loss took place in the Darién and Panamá provinces (24 890 ha), of which approximately 23% (5600 ha) was from exotic tree plantation according to 2000 and 2012 land cover categories classified as broadleaf plantations, that were likely a part of routine timber harvests.
In Nicaragua, Landsat image striping for 2007 along the Caribbean Coast likely resulted in large false positive forest loss patches. We therefore eliminated year 2007 forest loss estimates from the dataset. We identified 6 forest loss groups for Nicaragua, with one group determined anomalous by 6 of the 15 patch metrics (group 1, n = 646) with a mean patch size 16 times greater than other forest loss groups. Like Guatemala, a second group of extremely large patches (n = 11, group 2) were also strong outliers as forest loss patches ≥1000 ha. Nicaragua had the second highest forest loss rate in the region (−0.83% yr−1), consistent with other studies that have identified eastern Nicaragua as a key forest loss hotspot, with country-wide forest loss totals near 8000 km2 between 2000 and 2010 (Redo et al 2012, Aide et al 2013). We found an estimated 80% of all forest loss in Nicaragua took place within the two easternmost Autonomous Regions of Southern and Northern Nicaragua (RAAS and RAAN, respectively) totaling 396 762 ha between 2000 and 2014 (figure 3(d)). This area was subject to forest loss from an advancing agricultural frontier (Bermúdez et al 2015) that is also linked to drug and timber trafficking activities (Colchester et al 2006, appendix A [24, 26]). Trans-border illegal drug and timber trafficking between Honduras and Nicaragua has also helped to accelerate extensive forest conversion to pasturelands (Wells et al 2007), which is the principal mode of forest transition to another land use for moist tropical forest in the region (Redo et al 2012). We determined that anomalous forest loss in Nicaragua's department of Nueva Segovia was likely attributed to an unprecedented outbreak of southern pine beetle (Dendroctonous frontalis) and subsequent large-scale salvage logging of coniferous forest in the early 2000s (Billings and Schmidtke 2002).
3.3. Time-series forest loss analysis
NMDS ordination analyses for observing dissimilarity between background and anomalous forest loss patches for Honduras, Guatemala, Nicaragua, and Panamá typically resulted in a convergent two-dimensional solution after ≤20 iterations. Results were rotated along the first axis using total number hectares cleared and overlain with the maximum number of hectares cleared in a year (figures 4(a)–(d)). In all cases, anomalous patches defined using cluster analyses were well distinguished from background forest loss patches along NMDS axis 1, which was positively correlated with the maximum forest loss per year that ranged between r = 0.66 and r = 0.87. Anomalous patches were uniquely characterized by increasingly extensive annual forest loss relative background patches. Linear mixed effects models further confirmed that in all cases, mean annual forest loss for anomalous patches differed significantly (p < 0.001) from background losses (table 4). Significant differences by 'group' were not unanticipated because anomalous and background forest loss patches were categorized according to differences in the timing and magnitude of forest loss.
Table 4. Linear mixed effects model results and ANOVA table comparing anomalous and background forest cover loss before and after 2005 for Honduras, Guatemala, Nicaragua and Panamá.
| Country | Sub-region | Exp. variables | Sum sq | Mean sq | NumDF | DenDF | F. value | Pr (>F) |
|---|---|---|---|---|---|---|---|---|
| Honduras | Gracias a Dios, Colón, Olancho | Period | 1.61 | 1.61 | 1 | 11 | 9.90 | 0.009⁎⁎ |
| Group | 54.91 | 54.91 | 1 | 61 | 338.50 | <0.001⁎⁎⁎ | ||
| Period:Group | 1.44 | 1.44 | 1 | 61 | 8.88 | 0.004⁎⁎ | ||
| Guatemala | Petén | Period | 4.18 | 4.18 | 1 | 11 | 0.55 | 0.475 |
| Group | 560.72 | 560.72 | 1 | 11 | 73.30 | <0.001⁎⁎⁎ | ||
| Period:Group | 4.05 | 4.05 | 1 | 11 | 0.53 | 0.482 | ||
| Nicaragua | RAAN, RAAS | Period | 6.26 | 6.26 | 1 | 11 | 0.91 | 0.361 |
| Group | 699.10 | 699.10 | 1 | 36 | 101.22 | <0.001⁎⁎⁎ | ||
| Period:Group | 14.21 | 14.21 | 1 | 36 | 2.06 | 0.160 | ||
| Panamá | Darién, Panamá | Period | 1.43 | 1.43 | 1 | 11 | 2.83 | 0.121 |
| Group | 68.98 | 68.98 | 1 | 36 | 136.72 | <0.001⁎⁎⁎ | ||
| Period:Group | 3.36 | 3.36 | 1 | 36 | 6.66 | 0.014⁎ |
Significance levels are ⁎⁎⁎Pr(>F) < 0.001, ⁎⁎ Pr(>F) < 0.01, ⁎Pr(>F) <0.05.
Figure 4 Ordination of anomalous and background forest loss patches for (a) Honduras, (b) Guatemala, (c) Panamá, and (d) Nicaragua using Bray–Curtis multivariate dissimilarity derived from spatial and temporal patch metrics in table 1. Ordination plots are overlaid with a Gaussian fit of the maximum number of hectares deforested in a single year and patch (blue contour lines).
Download figure:
Standard image High-resolution imageMore importantly, LME models were further used to determine potential impacts of increased cocaine trafficking in Central America by comparing anomalous and background forest loss patches before and after 2005 (figures 5(a)–(d)). The most noteworthy case was Honduras which showed a highly significant before and after affect (Period, F = 9.90, p = 0.009) and a significant non-parallel temporal difference (Period:Group, F = 8.88, p = <0.004) between anomalous and background forest loss (table 4, figure 5(a)). Similarly, the BACI contrast estimate of the potential impact of increased cocaine trafficking on forest loss for Honduras was highly significant (t-ratio = 2.98, p-value <0.004, table 5). These results were corroborative with a large increase and concentration of suspected air and marine narcotics shipments to the Honduran Caribbean Coast detected after 2005 particularly within the Gracias de Dios department (figures 2(b) and 3(a), appendix B2–4). No other country showed a significant before and after effect with the exception of Panamá where the BACI contrast estimate was significant (t-ratio = 2.98, p-value <0.014, figure 5(c)). Nicaragua and Guatemala demonstrated very little difference in annual variation in forest loss before and after 2005 between anomalous and background forest loss (figures 5(b) and (d)). Correspondingly, the BACI contrast between the pre- and post-period of increased trafficking and loss categories were not significantly different (table 5). While trafficking related forest loss has been widely reported for Guatemala (appendix A [6–17]), further model comparisons were unwarranted. Evidence of drug trafficking as a driver of increased forest loss pre-dating 2005 (appendix A [9]) likely violated the model assumption that forest loss, observed from our data, was stable prior to that period (figure 5(b)).

Figure 5 Comparison of annual forest loss per anomalous and background patches for (a) Honduras, (b) Guatemala, (c) Panamá and (d) Nicaragua before (shaded) and after (unshaded) 2005 when cocaine trafficking greatly increased through Central American countries. The red connected line is the mean number of hectares cleared per forest loss patch per year. Outlying data were removed from plots for clarity and box widths are drawn proportional to the square-root of the number of observations per year.
Download figure:
Standard image High-resolution imageTable 5. BACI contrast (difference in differences) results for Honduras, Guatemala, Nicaragua, and Panamá and lower (L.CL) and upper (U.CL) 95% confidence limits.
| Country | Sub-region | Estimate | SE | df | t-ratio | p-value | L.CL | U.CL |
|---|---|---|---|---|---|---|---|---|
| Honduras | Gracias a Dios, Colón, Olancho | 0.56 | 0.19 | 61 | 2.98 | 0.004⁎⁎ | 0.18 | 0.93 |
| Guatemala | Petén | −1.62 | 2.23 | 11 | −0.73 | 0.482 | −6.53 | 3.29 |
| Nicaragua | RAAN, RAAS | −2.14 | 1.49 | 36 | 1.43 | 0.160 | −0.89 | 5.19 |
| Panamá | Darién, Panamá | 1.05 | 0.40 | 36 | 2.6 | 0.014⁎ | 0.22 | 1.87 |
Significance levels are ⁎⁎⁎P < 0.001, ⁎⁎P < 0.01, ⁎P < 0.05.
3.4. Drug flow analysis
We compared the spatio-temporal coincidence of anomalous forest loss and cocaine flows in eastern Honduras, eastern Nicaragua, Guatemala's Petén, and Panamá's Darién that were remote locations with the highest density of anomalous forest loss (figure 6(a), appendix B2–4). These were within the most sparsely populated areas in each country with poor road infrastructure (figure 6 (b)–(c)) where 'other' (non-drug) explanations of anomalous forest loss (e.g. settlement, insect outbreaks, or palm/timber concessions or other agricultural expansion) may not fully explain the observed patterns. This was particularly true within national and internationally protected areas with limited access such as Patuca National Park, Rio Plátano Biosphere Reserve (RPBR)–UNESCO World Heritage site, and Tawahka Asangni Biosphere Reserve that comprised 32% of the anomalous forest loss in Honduras. Anomalous forest loss patterns were in extreme contrast to locations typically occupied by smallholder indigenous farms observed within these protected areas (Plumb et al 2012, Wade 2007, figures 7(a)–(c), see online supplementary animation). The Petén in Guatemala and locations inside and outside the Maya Biosphere Reserve (MBR) core area (figures 7(d)–(f) also showed extremely large and consolidated anomalous forest loss patches (>1000 ha) that were in strong contrast to multiple-use timber concessions and non-timber resource extraction areas which typically cleared forest areas well below this size (Radachowsky et al 2012). Nicaragua's Cerro Wawashang Nature Reserve demonstrated a similar pattern of anomalous forest loss (figures 7(g)–(i) in areas known for high rates of illegal logging, cocaine trafficking, and land settlement by smallholder farmers (appendix A [28:35]).
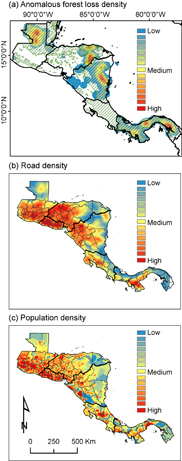
Figure 6 Mapped (a) anomalous forest loss patch density (patches/km2) within moist tropical areas (green hatched area), (b) road density (roads/km2) for department s (grey lines) and (c) human population density (humans/km2) in Central America. Patch density estimates considers all forest loss patches classed as anomalous for Guatemala, Honduras, Nicaragua, and Panamá.
Download figure:
Standard image High-resolution image
Figure 7 Anomalous and background forest loss within protected and buffer zone areas in the (a)–(c) Rio Platano Biosphere Reserve cultural zone in Honduras, (d)–(f) Maya Biosphere Reserve in Guatemala, and (g)–(i) Cerro Wawashang Nature Reserve in Nicaragua. The location highlighted in Honduras (purple rectangle) had a maximum annual forest loss of 230 ha and majority of loss in 2009 for the largest anomalous patch. The location highlighted for Guatemala (purple rectangle) had a maximum annual forest loss of 920 ha and of majority of loss in 2007 for the largest anomalous patch. The location highlighted for Nicaragua (purple rectangle) had a maximum annual forest loss of 187 ha and of majority of loss in 2010 for the largest anomalous patch.
Download figure:
Standard image High-resolution imageWhen we compared both anomalous and total forest loss to the number of primary cocaine movements, we found the strongest positive relationships in Honduras and Nicaragua, but weak relationships in Guatemala and Panamá (table 6, figures 8(a)–(d)). Stronger relationships emerged however, when we compared kg of cocaine flow detected (cocaine SDL) with anomalous forest loss data at the department level rather than at the national level (figures 9(a)–(c)). These analyses showed a stronger positive correlation between kg cocaine SDL and anomalous forest loss in the Guatemalan departments of Petén, Alta Verapaz, and Izabal combined (table 7, figure 9(a)). The same moderately positive relationship held in Nicaragua, where anomalous forest loss was more strongly correlated with the amount of narcotics detected in the Atlantic Coast's Northern Autonomous Region (RAAN) (table 7, figure 9(c)). Honduran departments Gracias a Dios, Colón, Atlántida, and Olancho showed a moderate to strong positive correlation with cocaine SDL (table 7). We found that the relationship between forest loss and cocaine SDL grew stronger in areas where CCDB records were more consistently collected such as Gracias a Dios (table 7). Time-lag effects likely exist between increased cocaine SDL and anomalous loss for Honduras (figure 9(b)), as CCDB records may fail to detect early increases in drug flows through remote parts of Central America (UNODC 2012). Anomalous forest loss in Honduras, Guatemala, and Nicaragua also tended to increase and decrease concurrently with background deforestation as they are frequently embedded within the same landscapes (figures 7(a)–(i)).
Table 6. Annual background and anomalous forest loss compared to primary narcotics movements from South American to Central American countries between 2000 and 2013. All comparisons were made using constrained smoothing splines and fitted values.
| Country | Forest loss | Pearson r | Spearman r | |
|---|---|---|---|---|
| Honduras | Background | 0.75 | 0.82 | |
| Honduras | Anomalous | 0.74 | 0.79 | |
| Guatemala | Background | 0.001 | −0.07 | |
| Guatemala | Anomalous | −0.12 | −0.07 | |
| Panamá | Background | −0.25 | 0.04 | |
| Panamá | Anomalous | −0.15 | 0.10 | |
| Nicaragua | Background | 0.85 | 0.79 | |
| Nicaragua | Anomalous | 0.33 | 0.19 | |

Figure 8 Total annual background and anomalous forest loss compared with the annual number of primary cocaine movements originating in South America and reaching (a) Panamá, (b) Guatemala, (c) Honduras, and (d) Nicaragua.
Download figure:
Standard image High-resolution imageTable 7. Annual background and anomalous forest loss compared to kilograms of cocaine, seized, delivered or lost (SDL) in sub-regions showing high anomalous deforestation and known cocaine trafficking between 2000 and 2013. All comparisons were made using constrained smoothing splines and fitted values.
| Country | Sub-region(s) | Forest loss | Pearson r | Spearman r |
|---|---|---|---|---|
| Honduras | Gracias a Dios + Colón + Atlantida + Olancho | Background | 0.54 | 0.75 |
| Honduras | Gracias a Dios + Colón + Atlantida + Olancho | Anomalous | 0.44 | 0.75 |
| Honduras | Gracias a Dios | Anomalous | 0.59 | 0.85 |
| Guatemala | Petén + Alta Verapaz + Izabal | Background | 0.74 | 0.75 |
| Guatemala | Petén + Alta Verapaz + Izabal | Anomalous | 0.67 | 0.64 |
| Guatemala | Peten | Anomalous | 0.74 | 0.70 |
| Guatemala | Izabal | Anomalous | 0.41 | 0.47 |
| Panamá | Darién + Panamá | Background | −0.40 | −0.36 |
| Panamá | Darién + Panamá | Anomalous | −0.12 | 0.23 |
| Panamá | Darién | Anomalous | 0.02 | 0.23 |
| Panamá | Panamá | Anomalous | −0.03 | 0.35 |
| Nicaragua | RAAN + RAAS | Background | 0.53 | 0.67 |
| Nicaragua | RAAN + RAAS | Anomalous | 0.11 | 0.13 |
| Nicaragua | RAAN | Anomalous | 0.75 | 0.76 |
| Nicaragua | RAAS | Anomalous | 0.27 | 0.47 |

Figure 9 Anomalous and background forest loss compared to the amount of cocaine seized, lost or delivered for the principal sub-regions with high anomalous forest loss in (a) Guatemala, (b) Honduras and (c) Nicaragua.
Download figure:
Standard image High-resolution image4. Discussion
Central America emerged as a globally preeminent zone for cocaine transit in the early 2000s, and remains a primary trafficking corridor for those moving cocaine from South to North America (UNODC 2012, appendix A [1, 4]). Of this amount, 42% of the drug flow distribution was estimated to have reached or been transported overland through the isthmus representing a 14% increase from years prior to 2010 (OAS 2013). These numbers represent a massive increase in illicit capital to the region which has become prevalent within economic and governance structures for Central American countries through money laundering (Insulza 2013). Rudel et al (2009) found that well-capitalized agro-industrial drivers of forest loss, as opposed to smallholder farming, have risen in their importance since the early 1990s. We submit that these sectors are increasing pervaded by illicit capital from drug trafficking activities and actors that have quickly become a key driver of forest loss in remote forested regions of Central America, often in collusion with other organized crime activities such as illegal logging, land grabs and consolidation through cattle ranching and mining (Richards et al 2003, Grandia 2013, McSweeney et al 2014, PRISMA 2014, appendix A [5, 11, 16, 26]). While human settlement patterns are a persistent driver of forest loss in moist tropical areas, drug trafficking and money laundering through cattle ranching is increasing cited as principal drivers in departments with high rates of forest loss such as in Guatemala's Petén (PRISMA 2014, also see http://theredddesk.org/countries/guatemala).
Countries with the highest rates of anomalous forest loss were those with more extensive dense forest cover typically in isolated moist tropical areas with a low human population density (figures 6(a)–(c)). Countries such as Honduras, Guatemala, and Nicaragua with lower human development indices (HDI) and per-capita GDP (Redo et al 2012) were also those most vulnerable to high rates of anomalous forest loss. These countries showed a higher proportion of GDP generated from narcotics trafficking activities in Central America that ranged between 10% and 14% (UNODC 2012). GDP from trafficking was strongly and positively correlated with the amount of anomalous forest loss in each of the four countries (r = 0.81).
Our multivariate analysis of spatial and temporal patch metrics helped to detect key areas of anomalous forest loss that differed significantly from background loss (table 4). Anomalous forest loss can be related to a number of proximate causes such as agricultural expansion, land settlement, and natural disturbance factors (Geist and Lambin 2002). However, our examination of time-series forest loss concurrent with counter narcotics data and drug trafficking impacts reported in the media provided both quantitative and qualitative evidence that trafficking has played a significant role in forest loss for specific locations in Central America (McSweeney et al 2014). This was most evident for the Caribbean Coast of Honduras that registered a significant increase in anomalous forest loss concurrent with increased trafficking that differed strongly from the temporal pattern of background forest loss (tables 4, 5, figure 5(a)). Our comparisons of anomalous and background forest loss using a BACI or a 'difference in differences' approach centered on year 2005 clearly highlighted increased forest loss in Honduras where a marked and sustained increase in cocaine trafficking was apparent from counter narcotics data. The total number of hectares of forest loss was 3.4 times greater per year after 2005 in the Gracias a Dios Department, where the number of kilos of cocaine detected since 2003 was eight times the amount (752 706 kg) detected in Olancho and Colón Departments combined (97 788 kg). Total forest loss for Colón and Olancho were 1.5 to 1.7 times greater after 2005 respectively.
Prior to 2005, subsistence-level farming within RPBR, located in the Gracias a Dios Department, cleared only minor forest patches <2 ha in size per year inside the more remote cultural zone (Plumb et al 2012). Wade (2007) observed a similar level of forest change in RPBR between the mid-1980s and early 2000s suggesting that lower human population numbers inside the cultural zone has likely lead to lower levels of forest clearing than that of the buffer zone. Illegal timber trafficking and logging was principally selective harvesting of commercially valuable trees such as mahogany (Swietenia macropylla) and cedar (Cedrela odorata) (Global Witness 2009). Nevertheless, we observed a significant departure from subsistence-level forest clearing within the cultural zone beginning in 2005 (figure 5(a)), that transitioned to clearing forest patches >100 ha in size in a single year, often in areas with limited or no road access (figures 7(a)–(c), see online supplementary animation).
Other locations with anomalous forest loss showed mixed relationships with cocaine trafficking data. Most anomalous forest loss detected in the Darién and Panamá provinces was within permitted timber concessions according to information posted by the Panamanian Ministry of Environment (www.miambiente.gob.pa/index.php/en/). Anomalous forest loss in Guatemala or Nicaragua were not significantly related to the timing of increased narcotics trafficking to Central America (tables 4, 5), but was more strongly correlated to cocaine shipments detected within specific departments. Surprisingly, Guatemala's Petén did not show a significant difference between anomalous and background forest loss after 2005 from our time series comparisons (tables 4, 5). The role of organized crime and drug trafficking on forest loss was first recognized as early as 2003 in Guatemala's Petén Department and MBR buffer and multiple use zones where cattle ranching was used as a mechanism to launder cocaine trafficking profits (appendix A [6–9], Hodgdon et al 2015). These areas showed the most extensive areas of anomalous forest loss (figures 7(d)–(f)). Obtaining forest loss data for years prior to 2001 is needed to more effectively model potential relationships between increased drug trafficking and increased forest loss for this area. Counter-narcotics data also suggest that the amount of cocaine transported through Guatemala's Petén began to decline between 2003 and 2012 and sharply increased within the Gracias a Dios Department in Honduras which peaked between 2009 and 2012. Nevertheless, changing human population demographics, urbanization, agricultural expansion mainly for cattle, land settlement, illegal logging, and timber concessions have also been identified as important drivers of forest loss in both the Petén and Nicaragua's Caribbean Coast (Stocks et al 2007, Redo et al 2012, Radachowsky et al 2012, Hodgdon et al 2015, Jordan et al 2016).
The degree to which the factors above are indirectly connected to cocaine trafficking and forest loss could not be fully determined from our quantitative analyses. Conversely, national statistics suggest that rural population growth is positive, but declining and that urban population growth has steadily increased between 2000 and 2014 (www.tradingeconomics.com/). Qualitative evidence from media events and other reports suggests that there are numerous possible connections between organized crime, drug trafficking, and anomalous forest loss that are likely to shift across international borders (appendix A [30–31]). In light of these connections, we estimated that the proportion of anomalous forest loss potentially linked to drug trafficking and money laundering could average as much as 20% to 25% of national forest loss in between 2001 and 2013 for countries such as Honduras, Guatemala and Nicaragua (figures 10(a)–(c)). We are more confident in the forest change data than we are in the cocaine flow data. We believe the latter to be highly conservative in terms of both the total number of trafficking events and the volume of cocaine moving through the study area over time. Indeed, due to biases implicit to the collection and estimation of drug shipment data and the unsupervised mapping approach taken in this study, it is likely that 'anomalous' forest loss greatly underestimated forest clearing resulting from drug-trafficking activities in landscapes where extremely large forest patches were cleared. Our approach primarily detected strong outliers with respect to spatial and temporal forest loss patterns at the country-scale, such as in Guatemala where the mean anomalous patch size was 1748 ha (appendix C: table 2). Spatially correlated, but less extensive forest loss patches or those in an early stage of clearing were likely allocated to background forest loss. Despite these shortcomings, our findings suggest that the data are sufficient to illustrate the likelihood and importance of drug trafficking as a driver of forest loss, especially by catalyzing rapid, large-scale forest loss as illicit proceeds are laundered through speculative (and often illegal) frontier land markets (UNODC 2012, Grandia 2013, McSweeney et al 2014, McSweeney 2015).
Figure 10 Annual smoothed anomalous forest loss for (a) Honduras, (b) Guatemala, and (c) Nicaragua indicating the percentage of national forest loss potentially attributed to narcotics trafficking.
Download figure:
Standard image High-resolution image
Three key findings of our study stand out. First, we distinguish the role of drug-trafficking activities from both conventional drivers of frontier forest change (i.e. smallholder farming along roads, logging, etc.) and from other activities that create anomalously large forest loss patches (e.g. plantation and timber management concessions, disturbances such as pine beetle outbreaks, and change dynamics in fruit tree crops). We estimated that in Honduras, Nicaragua, and Guatemala, which are responsible for the majority of Central American forest loss, drug trafficking is likely to be a principal driver of as much as one-quarter of all forest loss since the mid-2000s. Complicity between drug trafficking and other illicit trade such as illegal logging or palm oil land grabs are increasingly cited as factors contributing to the loss of native forest in Honduras, Nicaragua and Guatemala (Richards et al 2003, PRISMA 2014, appendix A [4, 9, 12, 26]). Previous forest loss studies have not explicitly recognized this dynamic in accounting for land cover change (e.g. Clark et al 2012 and Kim et al 2015), that has become progressively important in remote forest regions of Central America (Colchester et al 2006, Hodgdon et al 2015).
Second, we find that the strength of the forest loss/drug trafficking relationship varies considerably across Central American countries. This effect requires further investigation, but is likely to be related to the greater yield of trafficking profits (and thus incentives to launder trafficking profits via land use change) as illegal narcotics gain value moving northward through Central America. For example, we found that in Honduras (where the wholesale value of a kg of cocaine ranges between 8000 and 10 500 USD) to have forest loss patterns that were strongly spatio-temporally coincident with areas of sustained cocaine trafficking (Appendix B2–4). A large increase in drug shipments was more highly correlated with surges in anomalous forest loss (Pearson r = 0.74, Spearman r = 0.79). Conversely, in Panamá (where a kg of cocaine is valued at ∼2000 USD), anomalous forest loss patches were poorly correlated with the number of drug shipments (Pearson r = −0.15, Spearman r = 0.10), which was likely related to non-narco-affiliated tree plantations and forest management concessions (Velásquez Runk et al 2010).
Third, our study reveals that within countries, probable 'narco-driven' forest loss is concentrated in areas of high conservation importance (figure 7). Although we did not specifically focus our analyses on protected areas, we found that anomalous forest loss accounted for between 30% and 60% of all forest clearing within national and/or internationally designated protected area (e.g. biosphere reserve, national park or world heritage sites in Guatemala, Honduras, and Nicaragua identified from the World Database on Protected Areas www.protectedplanet.net/). Much of the forest loss within these countries was concentrated within remnant areas of moist tropical forest also observed by Clark et al (2012). We found the greatest forest loss impacts with potential links to narcotics trafficking were focused within six departments; Colón, Gracias a Dios, and Olancho of Honduras, the Petén department of Guatemala, and the RAAS and RAAN in Nicaragua. Of these, the Petén, Colón, Gracias a Dios, RAAS and RAAN showed a high density of anomalous forest loss patches (figure 6(a)). Our findings therefore help quantify a relationship between forest loss and illicit activities that likely include large-scale illegal logging that has been widely described in media, policy reports, and scholarship (UNODC 2012, Grandia 2013, McSweeney et al 2014, PRISMA 2014, appendix A [5, 8]).
5. Conclusions
Severely weakened civil governance structure resulting from increased drug trafficking, insecure land tenure, and high unemployment in remote regions of Central America has created a strong nexus between illegal logging, cattle ranching and organized crime (Broegaard 2005, Colchester et al 2006, Robinson et al 2014, PRISMA 2014). This study offers the first sustained exploration of the degree to which drug trafficking may contribute to the isthmus' high rates of forest loss. As such, our study represents, to our knowledge, the first broad-scale analysis of the potential role of drug trafficking, as opposed to drug cultivation, in forest cover change. We expect our methods to detect anomalous forest loss to be highly applicable in the many other global spaces where drug traffickers operate in and through forested landscapes (e.g. Amazonia, Golden Triangle).
The degree to which drug trafficking activities translate into forest loss is an understudied aspect of land use change that deserves greater attention. Anomalous forest loss patterns identified here are distinct from land settlement, subsistence-level, and agricultural expansion-style forest loss than have been previously observed for Central America. We estimate that anomalous patterns of forest loss associated with narcotics-trafficking may account for between 15 and 30% of annual national forest loss in Nicaragua, Guatemala, and Honduras over the past decade. While other land change factors can also be clearly identified as drivers of anomalous forest loss, such as southern pine beetle and timber concessions, we found that concentrations of forest loss likely related to drug trafficking are within many of the most culturally and biologically diverse and isolated regions of Central America. Consequently, drug trafficking is likely to operate synergistically with other drivers of land change that hasten forest loss, particularly within remote frontiers where illegal land grabs and consolidation are unimpeded by weak governance structures.
Our results underscore key threats to remaining moist tropical forest and protected areas in Central America, particularly within remote zones that are vulnerable to drug trafficking due to their isolation from law enforcement and the opportunities they afford traffickers for enrichment through profit laundering in illegal frontier land markets. The environmental impacts of drug trafficking activities are likely to have severe and lasting consequences for biodiversity, ecosystem services, and human welfare, none of which are usually considered in international drug, development or conservation policies. Land cover changes catalyzed by drug traffickers could also jeopardize international climate change mitigation strategies and investments aimed at sequestering carbon in tropical forests, namely through the United Nations' REDD+ program. Decades long efforts to develop community-based forestry concessions such as in Guatemala's Maya Biosphere Reserve multiple use zone are also threatened by traffickers, but as yet have resisted invasion where social cohesion and communal property rights are strong. This is in stark contrast to the reserve's core and buffer zones that are increasingly dominated by illicit actors who engage in ecologically destructive practices (PRISMA 2014). Reversing such trends will undoubtedly require urgent and substantive integration of national and international conservation and drug policies to ensure that global policy conventions do not continue to set aside biodiverse sites while simultaneously pursuing supply-side drug policies that perversely incentivize traffickers to operate through them.
Lastly, establishing fundamental relationships between the drug trade and environmental impacts could substantially benefit from a systematic and institutionalized drug trafficking monitoring systems. The illicit crop monitoring system of Colombia (SIMCI) which provides spatial data on annual coca field locations has proven vital to understanding how illicit factors may drive forest and other land change dynamics (Dávalos et al 2011, Sanchez-Cuervo and Aide 2013, Armenteras et al 2013). Similar efforts to establish and make available credible geospatial data regarding trafficking infrastructure such as clandestine airstrips, interdiction locations, flight and maritime tracks from relocatable over-the-horizon radar, and mapped overland routes can be used to further assess the vulnerability of human communities, rural livelihoods, and forests to drug trafficking impacts.
Acknowledgments
We thank the Open Society Foundations Grant No. OR2015-22831 which, in part, provided funding for this research. We also wish to thank the National Socio-Environmental Synthesis Center (SESYNC) for their support and numerous other collaborators who contributed national land cover data and other information valuable to our analyses. The findings and conclusions in this publication do not necessarily represent the views of the US Fish and Wildlife Service. We also thank three anonymous reviewers whose comments and suggestions helped to substantially improve this paper. The use of trade, firm, or product names is for descriptive purposes only and does not imply endorsement by the US Government.