


Abstract
Soil phosphorus (P) fertility arising from historic P inputs is a major driver of P mobilisation in agricultural runoff and increases the risk of aquatic eutrophication. To determine the environmental benefit of lowering soil P fertility, a meta-analysis of the relationship between soil test P (measured as Olsen-P) and P concentrations in agricultural drainflow and surface runoff in mostly UK soils was undertaken in relation to current eutrophication control targets (30–35 µg P L−1). At agronomic-optimum Olsen P (16–25 mg kg−1), concentrations of soluble reactive P (SRP), total dissolved P (TDP), total P (TP) and sediment-P (SS-P) in runoff were predicted by linear regression analysis to vary between 24 and 183 µg L−1, 38 and 315 µg L−1, 0.2 and 9.6 mg L−1, and 0.31 and 3.2 g kg−1, respectively. Concentrations of SRP and TDP in runoff were much more sensitive to changes in Olsen-P than were TP and SS-P concentrations, which confirms that separate strategies are required for mitigating the mobilisation of dissolved and particulate P forms. As the main driver of eutrophication, SRP concentrations in runoff were reduced on average by 60 µg L−1 (71%) by lowering soil Olsen-P from optimum (25 mg kg−1) to 10 mg kg−1. At Olsen-P concentrations below 12 mg kg−1, dissolved hydrolysable P (largely organic) became the dominant form of soluble P transported. We concluded that maintaining agronomic-optimum Olsen-P could still pose a eutrophication risk, and that a greater research focus on reducing critical soil test P through innovative agro-engineering of soils, crops and fertilisers would give long-term benefits in reducing the endemic eutrophication risk arising from legacy soil P. Soil P testing should become compulsory in priority catchments suffering, or sensitive to, eutrophication to ensure soil P reserves are fully accounted for as part of good fertiliser and manure management.
Export citation and abstract BibTeX RIS

Original content from this work may be used under the terms of the Creative Commons Attribution 3.0 licence.
Any further distribution of this work must maintain attribution to the author(s) and the title of the work, journal citation and DOI.
1. Introduction
A substantial proportion of the world's fresh waters are chemically and ecologically impaired due to continued excess nutrient pressures from agricultural activities causing eutrophication. These nutrient pressures will only worsen as agriculture intensifies, unless productivity can be increased more sustainably than in the past (Withers et al 2014a, Rockstrom et al 2017). Various mechanisms have been introduced in different countries including legislation, economic incentives and voluntary initiatives to help achieve the nutrient load reductions necessary to support ecological recovery, especially for the primary limiting nutrient phosphorus (P), (Carpenter 2008, McDowell et al 2015). Pretty (2008) argues that to be sustainable, farmers must fully embrace technological developments and extension, and move towards a more productive, regenerative and low-input agriculture, and for P there are compelling ecosystem service benefits to do so (MacDonald et al 2016). In addition to eutrophication concerns, it has become increasingly clear that the phosphate rock (PR) used to manufacture fertilizers and feed/food ingredients is a critical raw material, and that P must be managed more judiciously in the food chain to ensure future availability of P supply and affordability to agriculture (Cordell and Neset 2014, Mew 2016). A major related science and policy question is whether a transition to lower-input sustainable agricultural systems will provide the necessary environmental gain in the form of reduced P losses to meet water quality targets for eutrophication control, and how quickly any environmental benefits may be realized and whether benefits will be sustained.
One endemic source of P to freshwaters is the legacy P that has accumulated in the soil from past P surpluses across a wide range of intensive farming systems (Sharpley et al 2013, Powers et al 2016). Establishing and maintaining adequate soil P fertility according to recommended boundaries of soil test P (STP) concentrations has been a well-established, and integral part of sound nutrient management for maximising agricultural productivity (Syers et al 2008, Jordan-Meille et al 2012). However, many agricultural soils have accumulated unnecessarily high background STP levels due to past over-application of P, and one potential option to reduce both eutrophication risk and pressure on critical PR resources is to utilise the legacy P store and reduce STP concentrations (Sattari et al 2012, Withers et al 2015). Rowe et al (2016) argue for a two-stage strategy: strategy A aims to reduce STP concentrations to the agronomic optimum by wholly or partially omitting P inputs where feasible. Strategy B aims to further reduce STP levels below current recommended optimum levels without loss in production through agro-engineering–the integrated adoption of technological advances in precision farming, plant breeding, crop rotation design and microbial engineering together with a greater reliance on targeted application of recovered and recycled P. However, the environmental benefit of utilising legacy soil P based on reduced STP concentrations remains unclear because it is often assumed that agronomically optimum STP management does not pose a eutrophication risk (e.g. Higgs et al 2000). A greater emphasis on monitoring, reporting, and regulating background soil P fertility as a key source of P loss to water may lead to more significant and sustained improvements in water quality than has hitherto been achieved.
To determine the potential environmental benefit of managing STP to reduce eutrophication risk, we present the results of a meta-analysis of largely UK studies examining the relationship between soil P fertility and P concentrations in land runoff in relation to current eutrophication control targets. We hypothesized that tackling the legacy of past P management by lowering the background soil P signal from agricultural land is a fundamental step towards more effective and sustained eutrophication control. Our specific objectives were to assess whether (1) soils with agronomically-optimum STP concentrations still pose a eutrophication threat to freshwaters, (2) the eutrophication risk is significantly reduced by lowering STP concentrations below the agronomic optimum, (3) reducing STP concentrations alters the forms of P in runoff, and (4) assessment of STP needs to be refined to better predict P-eutrophication risk. We initially summarise current concepts surrounding the trade-off between soil P fertility and water quality, then outline the datasets we have used to examine this trade-off, before finally discussing the results of our meta-analysis in the context of sustainable intensification and the corresponding implications for policy. Our analysis causes us to challenge the assumption that maintaining optimum soil P fertility does not constitute a eutrophication risk at all sites, but also leads us to be optimistic over potential water quality improvements that are achievable by lowering background soil P fertility to more sustainable levels.
2. Assessing the trade-off between soil P fertility and water quality
Soil P fertility is a valuable resource and farmers recognise the important stewardship role of 'keeping the land in good heart' for their livelihood, and for producing food for future generations (Raymond et al 2016). However, building up soil P fertility for agronomic benefit has also proved to be a serious eutrophication threat because of soil P release to land runoff during storm events, and subsequent delivery to rivers, lakes, groundwaters, reservoirs and the coastal zone (Carpenter 2005, King et al 2017). A potential ecosystem service trade-off therefore exists between maintaining soil P fertility for crop production and achieving the desired improvements in chemical water quality and aquatic biodiversity (Doody et al 2016). STP thresholds for optimising crop production (sometimes termed critical soil P), and for accelerated P mobilization in land runoff (sometimes referred to as P change-points) have been identified (e.g. Bai et al 2013). One early example from the literature illustrates the apparent wide gulf between critical Olsen-P for wheat and barley yields and the change point for accelerated P loss in drain flow on silty clay loam soils at Rothamsted, England (figure 1). At this site, there is apparently no trade-off between eutrophication risk and maintaining STP at the agronomic optimum, and farmers can simply manage their soil P fertility based on regular soil analysis such that P is only applied when it is necessary to maintain the agronomic optimum STP level. Syers et al (2008) considered this was a highly efficient approach to P management.
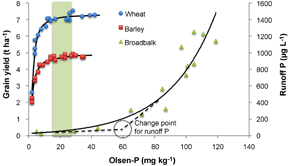
Figure 1 Data from Rothamsted showing that the Olsen-P concentrations required for optimum yield of wheat and barley on silty clay loam soils are well below the Olsen-P concentration at which P concentrations in drain flow accelerates. The green shaded area represents the band of Olsen-P (index 2) considered optimal for crop yield in the UK. The yield response data are taken from Poulton et al (2013) and the runoff soluble reactive P (SRP) data are from table 17 in Heckrath (1998).
Download figure:
Standard image High-resolution imageHowever, there are two issues arising from this strategy. Firstly, many farmers do not get their soils tested either at all, or routinely, and therefore do not regularly monitor soil P fertility to optimise their nutrient inputs for maximum efficiency. They instead rely on historic fertiliser management practices which may no longer be relevant or appropriate, and leave large P surpluses in the soil (Nesme et al 2011). Secondly, it is unclear whether maintaining an agronomic optimum STP still poses a eutrophication risk for some waterbodies. In the Broadbalk example (figure 1), runoff P concentrations in drain flow below the Olsen-P change point were considered low (<150 μg L−1) and not a eutrophication risk (Heckrath et al 1995), but these concentrations are still well above the P targets set for eutrophication control in both flowing and standing freshwaters around the world (typically in the range 20–100 μg P L−1). For example, recent in-river flume experiments across the UK suggest that soluble reactive P (SRP) concentrations need to be below 30 μg L−1 to give permanent reductions in algal growth rates and beneficial changes in periphyton community composition (Bowes et al 2012). Similarly low concentrations of total P (TP) have been advocated for eutrophication control in both rivers and lakes in other regions (Dodds et al 2002, Chambers et al 2012, Carvalho et al 2013). These low target SRP and TP concentrations (i.e. 30–35 μg L−1 for most freshwaters) are very challenging in relation to delivering the goals of sustainable intensification of agriculture, especially in the context of the multiple sources and sectors influencing P water quality in addition to agriculture (e.g. Zhang et al 2014). If eutrophication control targets cannot be achieved even under optimum soil P fertility, then some prioritization of catchment land use and acceptance of degraded waterbodies may be required (Doody et al 2016).
2.1. Datasets
To examine the trade-off between soil P fertility and water quality, we conducted a meta-analysis of all available UK data (and one EU dataset) on the relationship between soil STP (measured as Olsen-P) and concentrations of SRP, total dissolved P (TDP) and TP in land runoff, and in relation to a freshwater eutrophication control target of 30–35 μg L−1 for either flowing waters (as SRP) or standing waters (as TP). A mixture of new and previously published data from 25 individual sites covering a gradient in Olsen-P on the same soil type, and a cross-site analysis of 75 sites with variable Olsen-P concentrations covering different soil types was included. The selected sites for runoff monitoring included a mixture of replicated field experiments and farmer's fields that were monitored over various time periods. Olsen-P concentrations varied from 5 to 120 mg kg−1 measured to a depth of 10 or 15 cm.
The datasets included both surface runoff and drain flow hydrological pathways, and were separated into three groups according to the methodology used to generate them; i.e. monitoring under (1) natural rainfall, (2) simulated rainfall, and (3) by the DESPRAL laboratory test. Drain flow data generated under natural rainfall can be considered representative of runoff P delivered to the watercourse or connecting ditches, whilst all other data represented P mobilized in surface runoff, but not necessarily delivered to the watercourse on account of selectivity along delivery pathways. A summary of the datasets is given in table 1. Further site monitoring details are given in the appendix, but a brief summary is given here:
- Natural rainfall: Cockle Park, Broadbalk, Kingsbridge and Holbach were all individual experimental sites under arable cropping where unreplicated hydrologically-isolated plots with a gradient of soil Olsen-P were monitored over a series of storm events (table 1). Runoff through field drains was monitored at Cockle Park and Broadbalk, whilst surface runoff was monitored at Kingsbridge and Holbach. At two of the sites (Cockle Park and Holbach), variable additions of inorganic P fertilizer were applied over a two-year equilibration period to establish a known range in Olsen-P directly prior to monitoring. At the other two sites (Kingsbridge and Broadbalk), runoff was monitored from plot areas which had previously received different inputs of P in fertilizers and/or manures. In addition to these individual site experiments, drain flow or surface runoff from different single field sites, or field plots, of known Olsen-P status were monitored under natural rainfall following a number of storm events. There were 20 site-periods of drain runoff, and 17 site-periods of surface runoff. These additional sites are hereafter referred to as 'Other-Drain' and 'Other-Surface' and represent a cross-site analysis of soils under both grass and arable cropping (see tables S1 and S2 available at stacks.iop.org/ERL/12/063001/mmedia).
- Simulated rainfall: Four rainfall simulation experiments investigated the relationship between soil Olsen-P and the P concentrations in surface runoff from runoff trays: these experiments are referred to as ADAS soils, Slapton soils, EU soils and English soils, respectively. With the exception of Slapton soils, all rainfall simulation studies followed the same basic procedure with rainfall (either deionized or local site water) fed through a drip-screen irrigator applied to uncropped runoff boxes pre-packed with sieved (5 mm mesh) pre-wetted soils at rainfall intensities typical of temperate climates (25–60 mm hr−1) for 30 min at a 5° slope angle to generate runoff. The soils were collected from either field experiments (ADAS soils) or from farmers fields (English soils) or a mixture of these (EU soils). For Slapton soils, the runoff trays were driven into field sites (ca. 5° slopes) to a depth of 7.5 cm and left in situ under either grassland or arable cropping prior to rainfall simulation (McDowell and Sharpley 2001). Only SRP in runoff was monitored at Slapton. The EU soils and English soils experiments therefore represented a cross-site analysis, whereas the ADAS and Slapton soils represented a range of single sites (table 1). Although simulated rainfall experiments and soils packed in runoff boxes or trays (0.1–0.25 m2 and variable depth) do not represent the same hydrological conditions as field soil in situ, this experimental technique is widely used for predicting soil P-runoff P loss relationships in overland flow (Sharpley and Kleinman 2003, Kleinman et al 2004, Wang et al 2010).
- DESPRAL test: Withers et al (2007b) developed a simple laboratory soil dispersion test (DESPRAL) to estimate the potential mobilisation of dissolved and particulate P in runoff from soils during a storm event. The test was calibrated against an indoor rainfall simulation study using the same EU soils described above (Miller 2004), and has subsequently been successfully used to compare the risk of P export between fields in catchments (Withers et al 2009b, Villa et al 2014). As with all laboratory tests, the DESPRAL test only estimates the concentrations of P being released from soils into runoff under standardised conditions, and not what actually enters the watercourse as the net result of selective delivery processes. However, for the purpose of this meta-analysis, the test provides a suitable method for assessing the relative impact of Olsen-P status on TDP and TP release from different soils, just like any other surrogate laboratory test. The field soils collected for DESPRAL analysis were from rural catchments (12 sites) and field experiments (three sites) representing different lithologies, soil types and farming systems with varying levels of Olsen-P, table 1. In addition, the DESPRAL test was also undertaken on the same EU soils and English soils used in the rainfall simulation studies. For the EU soils and the Rosemaund site, SRP concentrations mobilised by the DESPRAL test were also measured.
Table 1. Datasets used in the meta-analysis to examine the relationship between P concentrations in land runoff and soil P fertility as measured by the Olsen method (Olsen et al 1954). Datasets are grouped according to type (within-site or across-site) and monitoring method.
| Dataset type | Site identifier | No. of plots/sites | Olsen-P (mg kg−1) | Soil type |
Reference | |
|---|---|---|---|---|---|---|
| (1) Natural rainfall | ||||||
| Within-site | Cockle Park | 9 | 5−18 | deep clayey, arable, drain | ADAS, unpublished | |
| Broadbalk | 15 | 5−119 | deep clayey, arable, drain | Heckrath 1998 (table 17) | ||
| Kingsbridge | 5 | 9−21 | medium, arable, surface | ADAS, unpublished | ||
| Holbach | 10 | 21−107 | medium, arable, surface | Withers et al 2009a (year 1) | ||
| Across-site | Other-drain | 17 | 5−44 | various, mixed, drain | Various—see table S1 | |
| Other surface | 12 | 5−55 | various, mixed, surface | Various—see table S2 | ||
| (2) Simulated rainfall | ||||||
| Within-site | Boxworth | 18 | 11−29 | deep clayey, arable, surface | Flynn and Withers 2005 | |
| Bridgets | 18 | 13−43 | shallow (calc), arable, surface | |||
| Pwllperian | 18 | 15−48 | medium (P-fixing), grass, surface | |||
| Rosemaund | 18 | 21−63 | medium, grass, surface | |||
| Slapton - grass | 7 | 8−64 | medium, grass, surface | McDowell and Sharpley 2001 | ||
| Slapton - arable | 8 | 21−74 | medium, arable, surface | |||
| Across-site | EU soils | 24 | 8−111 | various, various, surface | Withers et al 2007b | |
| English soils | 14 | 10−80 | various, various, surface | Hodgkinson 2007 | ||
| (3) DESPRAL test | ||||||
| Within-site | Blackwater | 6 | 11−48 | deep clayey, arable, surface | Palmer-Felgate et al 2009 and | |
| Childs Ercall | 17 | 21−91 | light sand, arable, surface | Scholefield et al 2013 | ||
| Waveney | 5 | 8−50 | medium, arable, surface | " | ||
| Sydling | 15 | 8−105 | Shallow (calc), arable, surface | " | ||
| Weaver | 5 | 20−59 | deep clayey, grass, surface | " | ||
| Cliftonthorpe | 13 | 7 = 67 | medium, mixed, surface | " | ||
| Colworth | 17 | 10−45 | deep clayey, arable, surface | " | ||
| Rosemaund | 11 | 16−79 | medium, arable, surface | " | ||
| Wye | 16 | 12−52 | medium, mixed, surface | " | ||
| Avon | 17 | 7−62 | deep clayey, mixed, surface | " | ||
| Loddington | 4 | 9−25 | deep clayey, mixed, surface | " | ||
| North Wyke | 7 | 21−49 | deep clayey, grass, surface | " | ||
| Peldon | 18 | 6−51 | deep clayey, arable, surface | Knight et al 2014 | ||
| Caythorpe | 18 | 6−21 | light sand, arable, surface | " | ||
| Great Charlton | 18 | 4−20 | medium, arable, surface | " | ||
| Across-site | EU soils | 24 | 8−111 | various, various, surface | Withers et al 2007b | |
| English soils | 14 | 10−80 | various, various, surface | Hodgkinson 2007 | ||
aSoil types are classified according to the system given in Defra (2010).
2.2. Methods and data analysis
All Olsen-P concentrations are reported in mg kg−1 after air-dried soils were sieved through a 2 mm mesh. All runoff P concentrations are reported as µg L−1, and are considered to represent the mobilization of background soil P with no, or minimal, influence of direct P losses following fresh fertilizer or manure applications. Site runoff data with a clear effect of fresh P applications on runoff P were excluded from the analysis. For all runoff samples, SRP in water was measured directly by colour according to Murphy and Riley (1962) after filtering through a 0.45 μm cellulose filter. TDP (<0.45 μm) and TP (unfiltered) were measured colorimetrically after persulphate digestion. A dissolved hydrolysable P fraction (DHP) was calculated as TDP minus SRP. The P content of the SS was not measured directly, but was estimated as the ratio of particulate P (PP, calculated as TP minus TDP) and SS. Suspended sediment was measured as the dry residue retained on a 1.2 μm filter. Where flow was monitored continuously over the experimental period, runoff P is reported as flow-weighted concentrations. For discrete runoff sampling protocols (e.g. repeated grab samples), and for replicated laboratory tests, runoff P is reported as the arithmetic mean, except for one site (Rowden) where the median value was taken to avoid bias from a fertilizer application (Haygarth et al 1998).
For each individual site, or cross-site, dataset, the effects of soil Olsen-P on runoff P concentrations were assessed by linear and non-linear regression using GENSTAT 17. Where there was a statistically significant (P <0.05) effect of Olsen-P, values of mobilized P were then estimated from the regression equation for Olsen-P concentrations at 10, 16, 25 and 50 mg kg−1. Olsen-P values of 16–25 mg kg−1 can be considered equivalent to the band of optimum P fertility classed as index 2 in England, Wales and Northern Ireland (Defra 2010). Olsen-P values of 10–15 mg kg−1 represent the band of low P fertility classed as P index 1, where a crop response to fresh P fertilizer is likely. Olsen-P values of >46 mg kg−1 represent high soil P fertility classed as index 3+, where crop responses to fresh P fertilizer are unlikely and where the risk of runoff P release is much greater. Over 40% of UK soils are currently in this P index 3+ class (PAAG 2015). The soil P index system in England and Wales uses commercial laboratories, who report results on a volumetric basis (i.e. mg L−1) rather than a weight basis (mg kg−1). However, the two reporting methods generally give very similar results for the mineral soils investigated in this study.
To assess similarity between site monitoring conditions, the datasets were separated into four groups according to the methodology used to generate the data and hydrological pathway: natural surface runoff, natural drain flow, simulated surface runoff and DESPRAL. For each data group, sequential regression analysis firstly fitted a single line to all the data, then fitted parallel lines to each set of individual data within each group (i.e. keeps the slope the same but allows the intercept to vary) and then lastly fitted the best line to each set of data (i.e. slope and intercept vary). The improvement in fit was measured at each stage and tested to see whether it was statistically significant at the 95% probability level. Finally, the same sequential regression analysis was carried out on all data (i.e. combining all groups of data).
To assess the environmental benefit of a transition to more sustainable P management, reductions in the land runoff P signal were calculated by (a) a transition from P index 3+ (taken as 50 mg kg−1) to the top of index 2 (25 mg kg−1)—strategy A, and (b) a transition from the top of index 2 (25 mg kg−1) to the bottom of index 1 (10 mg kg−1)—strategy B. The latter is a concentration that might be adopted under an agro-engineering approach (Withers et al 2014b, Rowe et al 2016).
3. Results
Statistically significant (P <0.05) relationships between soil Olsen-P and runoff P were best described by simple linear regression at the majority of sites irrespective of the methodology used to generate the data (i.e. natural rainfall, simulated rainfall or DESPRAL). Non-linear regression accounted for slightly more of the variance at some sites with very high Olsen-P concentrations, or where the highest Olsen-P value had a disproportionate influence, as similarly found by Hart and Cornish (2012). Only at one site where the range in Olsen-P concentrations was dominated by high values (Broadbalk) was a non-linear fit considerably better than a linear equivalent. A non-linear function was therefore used to predict runoff P at this site. However, for all other sites and for consistency in interpretation, linear regression analysis was used to predict runoff P concentrations at Olsen-P concentrations within the range of interest in this meta-analysis (i.e. ≤50 mg kg−1). The fitted regression parameters and estimates of runoff P concentrations at 10, 16, 25 and 50 mg kg−1 for each individual site and cross-site datasets are given in table S3.
3.1. Dissolved P in runoff
Highly significant (P < 0.001) relationships between soil Olsen-P and SRP and TDP concentrations in runoff were obtained at all but three of the 25 individual sites, and for all cross-site analyses, with 41%–95% of the variance accounted for (table S3). The three sites where there was no apparent influence of Olsen-P on runoff dissolved P (Weaver, Colworth and Rowden) were all on clayey soils with old drainage systems, longer residence times (i.e. subsoil buffering) and/or dilution with non-soil water.
3.1.1. Natural runoff
In drain flow, SRP and TDP concentrations increased up to 152 and 258 μg L−1, respectively, except at Broadbalk where they increased to over 1250 μg L−1, because of the much larger range in Olsen-P tested (table 1). At optimum soil P fertility (P index 2, 16–25 mg kg−1), SRP concentrations in drain flow for both individual sites (Cockle Park and Broadbalk) and across different sites (Other-Drain) were very similar, and varied within the relatively narrow range of 31–69 μg L−1 (table S3). TDP concentrations in drain flow within the P index 2 band varied more widely (43–116 μg L−1). Sequential regression analysis suggested there was no statistical advantage in fitting separate straight lines to the Cockle Park and Other-Drain data, and a single common relationship explained 73% of the variation in both SRP and TDP (see figure 2(a) for the SRP data). The reduction in drain flow SRP concentration by lowering Olsen-P from 50 to 25 mg kg−1, and from 25 to 10 mg kg−1, was 65 μg L−1 (55%), and 40 μg L−1 (74%), respectively (table 2). The respective reductions in TDP were 93 μg L−1 (49%), and 56 μg L−1 (57%). Very similar reductions were obtained at Broadbalk when fitted non-linearly (table 2): SRP fell by 64% (125–132 μg L−1) and TDP fell by 67% (46–50 μg L−1).
Table 2. Linear regression (y = a + bx) parameters for the relationship between Olsen-P and soluble reactive P (SRP) and total dissolved P (TDP), in runoff grouped according to runoff type and monitoring method. Predicted runoff P concentrations at soil Olsen-P concentrations of 10, 16, 25 and 50 mg kg−1 and percentage reductions in runoff SRP and TDP by lowering Olsen-P are also given. Predicted values for the Broadbalk site which was fitted by non-linear regression are also given.
| Form of P | Monitoring method/site | Regression parameters | Olsen-P (mg kg−1) | Reductions (%) | |||||||
|---|---|---|---|---|---|---|---|---|---|---|---|
| a | b | r2 | 10 | 16 | 25 | 50 | 50 to 25 | 25 to 10 | |||
| SRP | Natural Rainfall | ||||||||||
| Drainflow | −12.3 | 2.633 | 0.73 | 14 | 30 | 54 | 119 | 55 | 74 | ||
| Broadbalk | — | — | 0.87 | 23 | 39 | 69 | 194 | 64 | 67 | ||
| Surface runoff | 5.9 | 6.458 | 0.87 | 71 | 109 | 167 | 329 | 49 | 57 | ||
| Simulated Rainfall | |||||||||||
| EU and English soils | −26.2 | 4.140 | 0.64 | 15 | 40 | 77 | 181 | 57 | 81 | ||
| DESPRAL | |||||||||||
| EU soils | −19.9 | 3.780 | 0.76 | 18 | 41 | 75 | 169 | 56 | 76 | ||
| TDP | Natural Rainfall | ||||||||||
| Drainflow | 4.35 | 3.734 | 0.72 | 42 | 64 | 98 | 191 | 49 | 57 | ||
| Broadbalk | — | — | 0.87 | 25 | 43 | 75 | 207 | 64 | 67 | ||
| Surface runoff | 57.7 | 6.602 | 0.75 | 124 | 163 | 223 | 388 | 43 | 44 | ||
| Simulated Rainfall | |||||||||||
| EU and English soils | −2.9 | 4.960 | 0.66 | 47 | 77 | 121 | 245 | 51 | 61 | ||
| DESPRAL | |||||||||||
| All sites | −4.51 | 4.29 | 0.69 | 38 | 64 | 103 | 210 | 51 | 63 | ||
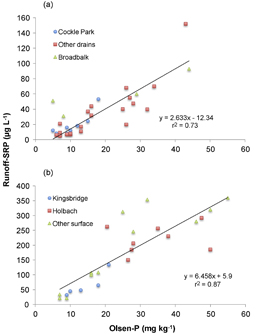
Figure 2 The relationship between soil Olsen-P concentration and concentrations of soluble reactive P (SRP) in (a) drain flow and (b) surface runoff collected from different sites under natural rainfall. The range in Olsen-P is restricted to <60 mg kg−1 to illustrate the tendency for runoff SRP to increase above an Olsen-P of 10 mg kg−1. The regression lines are those in table 2. Note the difference in scale between drain flow and surface runoff P.
Download figure:
Standard image High-resolution imageConcentrations of SRP and TDP in surface runoff under natural rainfall were much greater than in drain flow and increased up to 701 and 762 μg L−1, respectively. The fitted surface runoff SRP and TDP concentrations at optimum soil P fertility were also high: SRP values varied from 77–183 μg L−1 and TDP values ranged from 142–256 μg L−1. As with the drain flow data, the linear relationships were quite similar across sites, and all surface runoff P data could be statistically fitted just as well by a single common line with 87% of the variance in SRP, and 75% of the variance in TDP, accounted for by Olsen-P (see figure 2(b) for SRP data). Runoff SRP concentrations fell by 162 μg L−1 (49%) by lowering Olsen-P from 50 to 25 mg kg−1, and by 96 μg L−1 (57%) in lowering Olsen-P from 25 to 10 mg kg−1 (table 2). TDP concentrations correspondingly fell by over 40% (165 and 99 μg L−1).
3.1.2. Simulated surface runoff
Concentrations of SRP and TDP in surface runoff under simulated rainfall varied in a similar manner to natural surface runoff data with values up to 700 μg L−1 recorded over the same range in Olsen-P. However, fewer individual sites gave a significant (P < 0.05) effect of Olsen-P on TDP concentrations due to large variable increases in DHP, especially for the ADAS sites (figure 3). These variable DHP increases probably reflect the historic applications of organic manures and biosolids to these ADAS sites prior to sampling (see appendix). At P index 2, SRP concentrations varied from 24–151 μg L−1 and TDP concentrations from 52 to 315 μg L−1 (table 2). This 6-fold variation was noticeably greater than the typically two-fold variation found under natural rainfall, which may reflect the greater range of sites and experimental treatments tested under simulated rainfall. Sequential regression analysis suggested that runoff data generated by simulated rainfall at individual sites were better fitted by separate lines, with steeper gradients for calcareous and/or silty soils (Bridgets and Rosemaund), and shallower gradients for P-fixing soils (Slapton-grass and Pwllperian), figure 3. The Slapton-grassland site also showed a relatively high intercept suggesting much higher SRP concentrations at low levels of soil P fertility (figure 3(a)). This is most likely due to the much higher soil Olsen-P concentrations commonly found at the soil surface relative to the total sampled depth (10–15 cm) of undisturbed and fertilized grassland sites (Haygarth et al 1998, McDowell and Sharpley 2001, Hart and Cornish 2012).
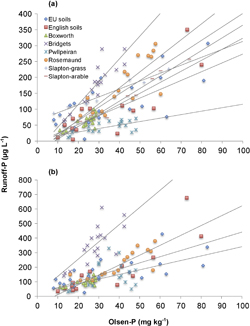
Figure 3 The relationship between soil Olsen-P concentration and concentrations of (a) soluble reactive P (SRP), and (b) total dissolved P (TDP) in surface runoff collected from different sites under simulated rainfall. Regression lines are shown for those sites showing a statistically significant (P < 0.05) relationship. Note the fewer number of significant relationships for TDP concentrations in runoff.
Download figure:
Standard image High-resolution image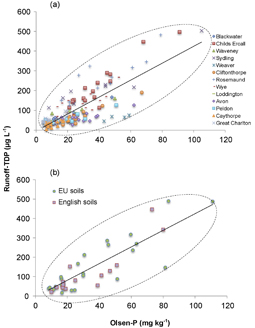
Figure 4 The relationship between soil Olsen-P concentration and concentrations of total dissolved P (TDP) in runoff predicted by the DESPRAL test for (a) individual sites, and (b) cross-site datasets (EU soils and English soils). The regression line shown is that given in table 2. The envelope encompassing the scatter across sites is shown as a dotted elliptical circle.
Download figure:
Standard image High-resolution imageFor the cross-site datasets (EU soils and English soils), a single common regression was adequate for both SRP (r2 0.64) and TDP (r2 0.66), and the fitted values for these two datasets also represented the average of the individual site predictions (table 2). The data envelope covering the scatter in runoff SRP and TDP concentrations across EU soils and English soils was also the same as that covering SRP and TDP values at individual sites under simulated rainfall. The common fitted values of SRP for the EU and English soils (table 2) are very similar to those recorded by Wang et al (2010) of 38, 54, 79 and 148 μg L−1 in similar simulated rainfall experiments on six different soils from Ontario, Canada. On average, runoff SRP concentrations therefore fell by 104 μg L−1 (57%) by lowering Olsen-P from 50 to 25 mg kg−1, and by 62 μg L−1 (81%) in lowering Olsen-P from 25 to 10 mg kg−1, table 2. TDP concentrations correspondingly fell by over 51% (124 μg L−1) and 61% (74 μg L−1).
3.1.3. DESPRAL
Highly significant linear relationships between soil Olsen-P and DESPRAL TDP concentrations were obtained for 12 of the 15 individual catchment/field sites, with 42%–91% of the variance accounted for (table S3). Olsen-P also had a large influence on TDP concentrations for the two cross-site datasets (EU soils (r2 0.73) and English soils (r2 0.76)). Combining all DESPRAL datasets, the fitted TDP concentrations within the P index 2 band varied from 38–188 μg L−1 (table S3), and the data envelope describing the scatter in runoff TDP concentrations at individual catchment/field sites was exactly the same as for the cross-site datasets (figure 4). Interestingly, this same envelope also encompassed the wide range in runoff TDP concentrations recorded under simulated rainfall. Sites with very sandy, calcareous and/or silty soils (e.g. Childs Ercall, Sydling, Rosemaund and Wye) tended to have steeper gradients and larger intercepts than clayey soils (e.g. Peldon and Avon), but sequential regression analysis suggested there was no statistical advantage in fitting parallel lines or individual lines to the DESPRAL TDP data. A single common regression function explained 69% of the variance in runoff TDP concentrations when all data were combined, suggesting that site differences were not sufficiently large to consider them behaving differently. DESPRAL TDP concentrations therefore fell by 107 μg L−1 (51%) when Olsen-P is lowered from 50 to 25 mg kg−1 and by 65 μg L−1 (63%) when Olsen-P is lowered from 25 to 10 mg kg−1 (table 2, figure 5(a)). Predicted concentrations of SRP mobilised from the EU soils by the DESPRAL test at 10, 16, 25 and 50 mg kg−1 were almost identical to those predicted from the simulated rainfall (table 2).

Figure 5 The environmental gain in reduced (a) total dissolved P (TDP), (b) total P (TP) and (c) sediment-P (SS-P) concentrations in runoff by managing soil P fertility according to P index at individual and cross-site datasets assessed by the DESPRAL test. The regression lines are the common fitted values for TDP and average values for TP and SS-P. Note the changes in scale and the lower gradients associated with TP and SS-P concentrations.
Download figure:
Standard image High-resolution image3.2. Total P in runoff
Since TP concentrations were additionally influenced by both soil dispersivity and the degree of particle P enrichment (SS-P), the effect of Olsen-P concentration on soil TP mobilization was less marked than for dissolved P concentrations. Hence, the number of sites which showed a significant effect of Olsen-P on runoff TP concentrations decreased, as well as the percentage of variance accounted for (table S3). For example under natural rainfall, TP concentrations in drain flow at Cockle Park (110–595 μg L−1) and in surface runoff at Kingsbridge (3.1–5.8 mg L−1) were not significantly influenced by Olsen-P. Under simulated rainfall, Olsen-P also had no significant effect on TP concentrations in runoff recorded from the English soils and explained only 39% of the variation in TP across the EU soils. Using the DESPRAL test, regression coefficients for TP averaged 0.48 compared to an average value of 0.75 for the effect of Olsen-P on TDP concentrations at individual sites. Similarly, Olsen-P accounted for only 58% of the variation in DESPRAL SS-P concentrations with little effect of Olsen-P at some sites (e.g. Peldon, Rosemaund), and large effects at others (e.g. Childs Ercall and Caythorpe), figure 5(c).
As expected, concentrations of TP in runoff were much greater and more variable across sites than for dissolved P fractions and typically increased up to 6 mg L−1, although values of over 10 mg L−1 were measured from bare soils under simulated rainfall. SS-P concentrations generally showed a three-fold variation around an average value of ca. 1 g kg−1 (e.g. 0.5–1.5 g kg−1), but increased up to and over 3 g kg−1 on dispersive and highly P fertile soils and under simulated rainfall. At all sites (individual sites and cross-site datasets), TP concentrations were dominated by particulate P (50%–99%) irrespective of hydrological pathway. Lowest PP contributions were recorded under natural rainfall and in drain flow, whilst the largest PP contributions (>90%) were always recorded under simulated rainfall. The DESPRAL test most clearly differentiated soil susceptibility to PP dispersion between soils because of the standardised dispersion procedure adopted. At optimum soil P fertility, TP concentrations typically ranged from 0.2–1 mg L−1 (figure 5(b)) while SS-P concentrations varied from 0.3–3 g kg−1 (figure 5(c)). The generally shallower regression slopes (compared to dissolved P fractions) suggested that high TP and SS-P values could be obtained even under low P fertility. Hence at 10 mg kg−1 Olsen-P, median TP concentrations were still high (431 μg L−1) and SS-P concentrations were 839 mg kg−1 when all data were combined.
4. Discussion
Our analysis included both individual site, and cross-site, soil fertility gradients representative of a wide range of mineral soils in a temperate climate. Although sorption theory predicts SRP release to runoff should increase exponentially with soil Olsen-P, we found linear regression functions were statistically best over the range of Olsen-P that is recommended for best practice farming in the UK. Hart and Cornish (2012) also found that linear fits were statistically most appropriate for STP-SRP runoff relationships in Australian soils even though some sites showed some non-linearity due to high STP values. Vadas et al (2005) found that a linear function best explained 77% of the variation in runoff SRP concentrations when combining USA studies using either Mehlich or Bray STP methods. Linear regression did predict negative intercepts at a number of sites in our study (table S3), which is theoretically unlikely since even a soil with a very low level of Olsen-P will release some dissolved P to runoff. This reflects the relative lack of very low Olsen-P values in the meta-analysis. Only when all drainflow data were combined was there a sufficient number of low Olsen-P values to fit a better non-linear regression, but this made very little difference to the predicted SRP values at 10, 16 and 25 mg kg−1 Olsen-P; for example non-linear regression predicted SRP values in drainflow of 14, 22 and 45 μg L−1, respectively, compared to linear regression predictions of 14, 30 and 54, μg L−1. Only at 50 mg kg−1 was there a more significant deviation in the predicted values (177 v 119 μg L−1).
The analysis included three different methods of monitoring runoff P. Dissolved P concentrations in surface runoff were considerably greater under natural rainfall than under simulated rainfall, or when using the DESPRAL test in this meta-analysis (table 2). Simulated rainfall and DESPRAL data gave very similar runoff SRP and TDP predictions. The noticeably higher dissolved P concentrations in natural surface runoff may possibly be due to some influence of recently applied P despite choosing sites with nil or very low P inputs. However, it is more likely to be due to the longer water residence times and greater interaction with soil surface layers under natural rainfall, especially where the soil develops a gradient in STP down from the surface due to lack of disturbance (e.g. grassland sites or where arable soils have been minimally cultivated). Packing air-dried soil into runoff boxes or in preparation for the DESPRAL test would lose this residence time and stratification influence when sites are sampled to 10–15 cm depth (Sharpley 2003). There were too few significant effects of Olsen-P on runoff TP or SS-P concentrations to provide a similar methods comparison. These comparisons suggest that, while simulated rainfall and DESPRAL studies are useful in separating out relative site susceptibility to management factors affecting soil P release, they may not reflect the actual concentrations mobilised within a field or catchment setting under variable rainfall intensities.
In relation to our central hypothesis that lowering STP concentrations will reduce eutrophication risk, a number of key questions arise in meeting our study objectives.
4.1. Does agronomically-optimum soil P fertility still pose a eutrophication risk?
It is often assumed that environmental thresholds of STP to limit P loss from soil are well above the optimum agronomic STP required for maximum crop production, and therefore that best practice agriculture does not pose a eutrophication risk (e.g. Higgs et al 2000 and figure 1). However this may not be the case and is incongruous with the very low and challenging SRP and TP concentrations (e.g. 30–35 μg L−1) required to limit algal growth in the majority of rivers and lakes, respectively. In this meta-analysis, fitted SRP concentrations measured in runoff at optimum soil P fertility (P index 2) were < 200 μg L−1 across the various sites tested (table 2). TDP concentrations varied slightly more widely to just over 300 μg L−1, while TP concentrations ranged up to 1 mg L−1 reflecting variation in soil dispersibility and sediment P content as one might expect.
Lowest SRP and TDP concentrations were recorded in water flowing through the monitored field drains (e.g. 31−69 μg SRP L−1), reflecting the greater opportunity for P retention as water flows down through the soil (Heathwaite and Dils 2000, Withers et al 2009b). These concentrations are low and provide a lot of optimism that reducing STP concentrations in over-fertilised soils to recommended agronomic levels will deliver substantial environmental gains. For example, the average reduction in SRP and TDP concentrations by lowering Olsen-P from 50 to 25 mg kg−1 was 56% (110 µg L−1) and 51% (124 µg L−1), respectively (table 2). This is especially relevant for the UK which has both a high percentage of over-fertilised soils (>40% have Olsen-P levels above the optimum) and a high percentage (ca. 60%) of soils with underdrainage (Withers et al 2000). Predicted SRP and TDP concentrations in surface runoff were considerably higher than in drain flow under natural rainfall, and clearly pose more of a eutrophication concern, especially in critical source areas with active hydrological connectivity (Strauss et al 2007, Doody et al 2012). Runoff TP concentrations approaching 1 mg L−1 in land runoff will greatly exceed eutrophication control targets, but the bioavailability of particulate P is very unclear and difficult to predict (Ekholm and Lehtoranta 2012).
Examples of the potential impact of the predicted SRP concentrations in drain flow and surface runoff under natural rainfall on the expected increase in SRP concentrations in UK rivers with different discharge volumes, baseflow indices and runoff contributing areas are shown in table 3. The eutrophication impact from runoff P is clearly greatest in high rainfall catchments with low baseflow indices (i.e. high runoff rates), but is substantially reduced as STP declines. However, even relatively low SRP concentrations in land drainage at P index 2 can be sufficient to raise river P concentrations above target thresholds for eutrophication control in some river systems depending on ambient baseflow P concentrations. In addition, some sites are known to deliver much larger concentrations in drain flow and surface runoff than the average values predicted in this meta-analysis. For example, the Foxbridge drain at Rosemaund draining poorly buffered dispersive silty soils under arable farming delivers average annual flow-weighted SRP concentrations of over 200 μg L−1 at optimal soil P fertility levels (Hodgkinson and Withers 2007, Withers and Hodgkinson 2009). The DESPRAL test also showed that the Rosemaund soil was highly P dispersive (figure 5(a)), with SRP concentrations still at 54 μg L−1 at 10 mg kg−1 Olsen-P (table S3). At the CENIT site in Northern Ireland, flow-weighted concentrations of SRP and TP of over 300 and 600 μg L−1, respectively in natural runoff were recorded from grazed grassland with Olsen-P levels of 25 mg kg−1 and no P additions (Watson et al 2007), suggesting that other site factors are overriding Olsen-P as the main driver of runoff P concentrations (Cassidy et al 2016). Clearly, such high-risk sites need to be identified and additional measures introduced to combat eutrophication risk.
Table 3. Estimated effect of runoff soluble reactive P (SRP) concentrations in surface runoff and drain flow at 10, 25 and 50 mg kg−1 Olsen-P on waterbody SRP concentrations for three different river typologies, and when either 20, 50 or 100% of the catchment area is contributing storm runoff. The estimates assess the additional impact of the storm runoff P and assume there is no existing P load in base flow or from the non-contributing area.
| Olsen-P | Runoff SRP |
Wansbeck |
Eden |
Avon |
||||||||
|---|---|---|---|---|---|---|---|---|---|---|---|---|
| (mg kg−1) | (µg L−1) | 20% | 50% | 100% | 20% | 50% | 100% | 20% | 50% | 100% | ||
| Surface runoff | ||||||||||||
| 10 | 71 | 16 | 30 | 43 | 28 | 43 | 54 | 2 | 4 | 7 | ||
| 25 | 167 | 38 | 71 | 100 | 65 | 102 | 127 | 4 | 9 | 17 | ||
| 50 | 329 | 76 | 141 | 197 | 127 | 202 | 250 | 7 | 17 | 33 | ||
| Drain flow | ||||||||||||
| 10 | 14 | 3 | 6 | 8 | 5 | 9 | 11 | <1 | <1 | 1 | ||
| 25 | 54 | 12 | 23 | 32 | 21 | 33 | 41 | 1 | 3 | 5 | ||
| 50 | 119 | 27 | 51 | 71 | 46 | 73 | 90 | 3 | 6 | 12 | ||
aSRP concentration predicted for grouped surface runoff and drain flow sites under natural rainfall in this meta-analysis from table 2. bMitford station on R Wansbeck, Northumberland: annual rainfall 793 mm; annual discharge 367 mm; base flow index 0.40. cTemple Sowerby station on R Eden, Cumbria: annual rainfall 1406 mm; annual discharge 1153 mm; base flow index 0.24. dEast Avon station on the R Avon, Hampshire: annual rainfall 776 mm; annual discharge 364 mm; base flow index 0.90.
4.2. Is the eutrophication risk lower if we farm at P index 1?
A key argument for making the transition towards more sustainable agriculture and lower soil P fertility is that it will benefit the environment in terms of lower eutrophication risk (Withers et al 2014b). Since positive relationships were obtained between soil Olsen-P and dissolved P in runoff, our data analysis clearly supports this argument, at least in terms of achieving target P concentrations for UK rivers (e.g. 30–35 µg L−1). Lowering Olsen-P from the top of index 2 to a suggested sustainability level of 10 mg kg−1 reduced SRP to 14 μg L−1 in natural drain flow, to 71 μg L−1 in natural surface runoff and to 15 μg L−1 in simulated runoff (EU and English soils). The average reduction in SRP across all runoff monitoring methods was 71% (60 µg L−1), table 2, but with reductions ranging from 16–108 μg L−1 (29%–91%) across all single site and cross-site datasets (table S3). In the examples illustrated in table 3, a drop to 14 μg L−1 in drain flow would increase river P concentrations by only 8, 11 and 1 μg L−1 at Mitford, Kirby Stephen and East Avon, respectively even when assuming a 100% contributing area. Reducing soil P fertility below the agronomic optimum would have far less impact on the concentrations of TP and SS-P delivered in runoff (figures 5(b) and (c)), and at many sites there was no effect of Olsen-P on TP concentrations. This strongly suggests that separate strategies are required for limiting dissolved P loss and particulate P loss on farms, although these strategies may be antagonistic if STP levels remain high under options to reduce soil erosion through minimum tillage (Dodd and Sharpley 2016).
4.3. Does lowering of STP alter the forms of P in runoff?
Phosphorus is mobilised in land runoff in a spectrum of forms of varying bioavailability which will influence the ecological impact of runoff P in different types of waterbody and at different times of year (Edwards and Withers 2007). Whilst there is general consensus that SRP is largely bioavailable, there is much more uncertainty over the algal availability of DHP and PP fractions, particularly for flowing waters (Reynolds and Davies 2001, Ekholm and Lehtoranta 2012). Aquatic macrophytes will exploit P-fertile river bed sediments formed from eroding soil particles (Jones et al 2012), and bed sediments can act as a source of SRP into the water column when diffusion gradients and redox conditions are favourable (Haggard et al 2005, Jeppesen et al 2005, Musolff et al 2017). This suggests that particulate P export in runoff can be more ecologically relevant than just the direct and low algal bioavailability of eroding soil particles. This is an important aspect for the development of eutrophication control policy because particulate forms in runoff were dominant at all levels of Olsen-P in our analysis, except for some grassland sites that provide better soil protection (table S1 and S2). Hence, we found that the proportion of runoff P in particulate form increased only slightly as STP declined, and high concentrations of SS-P were obtained even at low Olsen-P (figure 5(c)). Land use management to reduce vulnerability to soil erosion will therefore be a more important factor controlling PP in runoff than soil Olsen-P content (Quinton et al 2003).
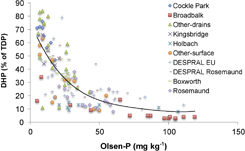
Our analysis also suggests that as soil fertility decreases, a significantly larger proportion of the soluble P loss in runoff will occur in the DHP form. When all datasets showing a significant (P < 0.05) effect on %DHP are combined, non-linear regression suggests that once Olsen-P drops below 12 mg kg−1, DHP will become the dominant soluble P form in runoff (figure 6). High concentrations of DHP were also recorded at sites receiving regular inputs of bioresources (e.g. Bridgets and Pwllpeiran). The majority of DHP is considered to be organic, and significant, but variable amounts of utilizable DHP have been monitored in land runoff (e.g. Darch et al 2014), and in UK rivers (Whitton and Neal 2011). As farming systems recycle more P in bioresources and adopt more agro-ecological approaches to soil management in the future (Withers et al 2014b), one can anticipate that the ecological importance of the DHP fractions will increase. Further work is required to understand the significance of DHP and PP fractions for eutrophication and target setting, especially for flowing waters.
Figure 6 The proportion (% of total dissolved P (TDP)) of dissolved hydrolysable P (DHP) in runoff decreases as Olsen-P increases. A common line is drawn through all the sites where there was a significant effect of Olsen-P on DHP %.
Download figure:
Standard image High-resolution image
4.4. Do we need a revised or new soil fertility test to assess eutrophication risk?
Our analysis showed large site variability in the concentrations of SRP, TDP and TP mobilized at any given level of Olsen-P. This was especially noticeable when the wider range of sites were assessed under simulated rainfall, and by the DESPRAL test. Typically steeper regression slopes were obtained for low P retentive sandy and silty soils compared to more P-retentive clayey and P fixing soils (figures 3 and 4). Site differences in SRP release to runoff will relate to differences in soil P buffering capacity as has been found by others (Hart and Cornish 2012, Daly et al 2015), and soil type is used to refine interpretation of STP values for agronomic advice in some regions (Jordan-Meille et al 2012). Some sites such as the Slapton-grassland site also released disproportionally large concentrations of SRP because of the build-up of P at the surface of undisturbed soils that is not reflected in routine STP analysis (McDowell and Sharpley 2001). This suggests that modification of STP methods to take account of soil P buffering capacity and soil P stratification will help facilitate more accurate and environmentally-aware P input management (Ehlert et al 2003). Differences in TDP and TP will additionally be influenced by the history of land management (e.g. manures), hydrological status (e.g. permeability) and soil dispersibility (e.g. erosion risk).
An additional notable feature of this meta-analysis was the increase in site variability in runoff P as Olsen-P increased. For example, excluding the Slapton-grass site, the max-min range in SRP concentrations under simulated rainfall was 37, 62, 117 and 269 μg L−1 at 10, 16, 25 and 50 mg kg−1, respectively (figure 4(b)). The corresponding range in TDP concentrations was 54, 46, 75 and 188 µg L−1 (figure 5(a)). A similar trend was noted for TP concentrations. However, data obtained under natural rainfall did not show this site variability to the same extent, possibly because the range in sites was more limited or other site factors had a modifying influence. The trend for much lower site variability in runoff P concentrations under low soil P fertility suggests that strategies to reduce Olsen-P may obviate the need to introduce more sophisticated STP methods to take account of soil P buffering when predicting soil P release, at least under the site conditions tested here. It is also interesting to note that despite site variability in TDP concentrations predicted by the DESPRAL test, there was no statistical advantage in treating the sites differently, and a single common regression line explained variation in runoff P across many different sites within the EU and English soil datasets. Hence a generic policy focus on simply reducing STP in agricultural soils would probably have more general positive environmental impact than a focus on trying to account for site differences in background P loss risk due to soil P buffering.
5. Managing soil fertility for eutrophication control
Source control is a central concept for eutrophication control strategies and soil P status is a major source driver of the background P signal mobilised from agricultural soils during rainfall events. Although other site factors such as hydrology and soil stability are equally or more important factors driving field and catchment TP export (e.g. Shore et al 2014), lowering the background STP signal from farmed soils is a key management option with potential long-term benefit for restoring good water quality and ecological status in freshwaters (Carpenter 2005, Sharpley et al 2013). Our analysis clearly shows that reducing STP concentrations brings environmental gain in reduced concentrations in land runoff, especially in SRP concentrations, which currently drive eutrophication control targets in UK rivers. However this environmental gain introduces a potential trade-off for farmers because building up soil STP concentrations reduces the risk of yield loss or crop quality caused by a shortage of soil P supply. Acceptance of lower crop yields or quality over a larger land area for environmental gain will not be economically attractive without financial recompense.
Recent reviews suggest that lowering high soil P fertility to the agronomic optimum by reducing or omitting P inputs is unlikely to lead to large crop yield reductions due to the continued mobilization of legacy P stores (Johnston et al 2014, Rowe et al 2016). There is clearly an economic incentive to do so, although in some regions with high livestock densities (and manure P loadings) this will be difficult to achieve (Senthilkumar et al 2012), unless additional measures such as dietary manipulation are put in place. The yield or quality impacts of lowering Olsen-P concentrations below the agronomic optimum are less clear. Release of legacy soil P not extracted by Olsen to cushion any shortfall in soil P supply may not hold for all environmental conditions (e.g. cold dry springs). For example, Bailey et al (2014) found that grass swards on soils with an Olsen P concentration of < 20 mg L−1 were becoming P deficient in mid-season. However, data presented by Johnston et al (2014) for winter wheat in the UK show that crops can yield just as well at P index 0 and 1 in some years as at P index 2, which suggests there is scope to improve soil and crop management to reduce reliance on so much available P in the soil. Sylvester-Bradley and Withers (2012) argue for more innovation in crop breeding, fertilizer formulation, system management and sensor technology to reduce crop P demand, mobilize more soil P resources and better target P inputs more evenly during the growing season to meet crop P requirements. Clearly these uncertainties need to be resolved before a paradigm shift to farming under lower critical STP concentrations can progress.
Equally, additional work is required to explore the impacts of climate change on the loadings and forms of P mobilised from agricultural land and delivered to rivers and streams (Withers and Jarvie 2008, Michalak 2016). Recent work in the UK by Ockenden et al (2016) suggests, for example, that with the projected increase in winter rainfall for some catchments, annual event P loads might increase by around 9% on average, if agricultural practices remain unchanged. The same work suggests that high P concentrations associated with summer storm events following prolonged dry spells could result in more frequent, or longer duration, high P concentrations associated with low flow in the future, with a corresponding increase in the length of time that current P water quality threshold concentrations are exceeded. These preliminary results suggest that in order to improve the scope for sustainable intensification of agriculture, in the context of climate change, farm management practices should increasingly target controllable risk factors, including soil P status, as demonstrated herein.
6. Conclusions
Excess phosphorus is the major cause of failure to achieve good ecological status in UK freshwaters under the EU Water Framework Directive (Environment Agency 2015), and stringent standards for SRP in rivers and TP in lakes have been set to limit eutrophication. Source apportionment suggests around 30% of P in the UK comes from agricultural sources, and the 'fair share' planning approach used in river basin management planning means the agricultural sector must deal with the proportion of the problem they are responsible for creating. A range of policy mechanisms are in place including legislation in Northern Ireland, advisory schemes such as Catchment Sensitive Farming, and more novel catchment based approaches including nutrient trading, although it is widely acknowledged that more actions will be needed to close the phosphorus gap to achieving good status. Soil P fertility built up from previous applications of fertilizers and manures (legacy soil P) poses an endemic eutrophication risk by increasing the background concentrations of SRP and TP in runoff from agricultural land.
One key policy option for eutrophication control, that would also reduce reliance on a costly and finite resource, is to put more emphasis on reducing soil P fertility by utilising this legacy soil P (Rowe et al 2016). This meta-analysis of largely UK data has shown highly significant (P < 0.001) linear relationships between soil P fertility (as measured by Olsen-P) and P concentrations in drain flow and surface runoff across a number of different sites, and using different monitoring methods (natural rainfall, simulated rainfall and the DESPRAL laboratory dispersion test). Runoff P concentrations were higher in surface runoff than in drainflow, especially under natural rainfall and therefore pose a greater eutrophication risk, depending on the hydrological connectivity of the source area. As the main driver of eutrophication, dissolved P (SRP) concentrations were considerably more sensitive than total P concentrations to changes in Olsen-P status due to the dominance of particulate P forms in runoff. This confirms that land use management to reduce vulnerability to soil erosion will be a more important factor controlling PP in runoff than soil Olsen-P content, and suggests that separate strategies are required for mitigating dissolved and particulate P transfer in runoff.
Lowering Olsen-P to the agronomic optimum (e.g. from 50 to 25 mg kg−1) reduced SRP and TDP concentrations in different types of runoff on average by 49%–64% and 43%–64%, respectively. Lowering Olsen-P to 10 mg kg−1 (below critical STP) further reduced SRP and TDP concentrations by 57%–81% and 44%–67%, respectively, and with a much greater likelihood of reaching the challenging UK eutrophication control targets, especially in surface water catchments with a low baseflow index. Lowering STP also reduced the variability in runoff P signals between sites, which suggests that simply focusing on reducing soil fertility will deliver greater overall environmental gains than attempting to refine soil P tests to predict site to site variation in eutrophication risk. Reductions in runoff P from soils would also help to buffer the additional P footprint associated with P losses following fresh P applications to soils and other more point-source driven P inputs to freshwaters. Some sites will still remain a risk even at lower soil P fertility and it will be important to identify these high-risk sites. As SRP concentrations in runoff decline, it is likely that less available P forms will become more dominant, and these fractions may well become more ecologically relevant for driving standards.
We conclude that a greater emphasis on lowering soil P fertility will bring significant and multiple environmental gains, and consider that soil testing for P should be compulsory in priority catchments sensitive to eutrophication to facilitate more effective nutrient management planning. The potential environmental and resource utilisation benefits from lowering STP also suggest that the trade-off between maintaining critical STP to avoid the risk of yield loss caused by a shortage in soil P supply and eutrophication risk needs to be examined in more detail. This presents a research challenge to develop innovative agro-engineering options to overcome the risk of yield loss from lowering critical STP concentrations. Further research is also required to clarify the future impacts of climate change, which are likely to put even more emphasis on controlling the agricultural drivers of P loss such as soil P fertility.
Appendix
1. Cockle Park
Cockle Park is an experimental field drainage facility in North-West England with a permeable fine loam topsoil over a poorly structured, slowly permeable clay subsoil. The facility consists of nine unreplicated hydrologically-isolated (by polythene barriers at least 1 m deep) 0.25 ha plots, which were monitored and sampled over two successive winters in 2012/13 and 2013/2014. A main drain ran the length of each plot (100 m) and 3 perpendicular lateral drains ran across the width of each plot (25 m), all with gravel backfill to within 30 cm of the surface. In addition, the site was mole drained (perpendicular to the lateral drains) in 2009 at a depth of 0.5 m (2 m spacing). Further details of the hydrological design are given by Armstrong (1984). Stormwater (surface runoff and drainflow) from each plot drained downslope into a concrete chamber for sampling. Flows were monitored using a 'V' notch weir tank flow meter linked to head recorders. Water depth was continuously monitored by a pressure transducer linked to a datalogger which triggered an automatic pump sampler to take samples at specified intervals. Flow in both surface runoff and drainflow was continuously monitored, but only drainflow was sampled as this is the dominant pathway.
A range of Olsen-P values was established across the plots by adding varying rates of triplesuperphosphate (TSP) inorganic fertiliser in autumn 2010 and again in autumn 2011. The final Olsen-P concentrations ranged from 5–18 mg kg−1 in autumn 2013. The site was left fallow until autumn 2013 when winter wheat was sown. Monitoring of drainflow and surface runoff started in autumn 2012 and finished in spring 2014. A total of seven storm events were sampled over the experimental period and captured a wide range of event size (2.7–9.4 mm of drain discharge). Samples of drainflow were collected using Aquamatic samplers controlled by data loggers. Once 1 mm of drainage had occurred in a storm, twelve samples were taken at 30 minute intervals, and four of these samples were selected for laboratory determination of suspended sediment (SS), soluble reactive P (SRP), total dissolved P (TDP) and total P (TP). Samples were taken immediately after the storm and samples for SRP and TDP immediately filtered on site. The samples to be analysed were selected to represent initiation of flow, peak flow and recession flow. Runoff P concentration data were used in conjunction with spot discharges to give an instantaneous P loads, and these loads were combined to provide a flow-weighted P concentration based on total drain discharge per event for each plot.
2. Broadbalk
Drainflow from selected plots of the Broadbalk long-term experiment at Rothamsted receiving inputs of either nil P, fertiliser P and/or manure P (farmyard manure) since 1852 in various combinations was sampled on 12 separate occasions during October 1992 to March 1995. Not all drains were sampled on the same date as some drains did not flow on some sampling dates. Samples were collected after the drains had been running freely for a few hours and therefore the measured concentrations are probably more representative of the falling limb of the hydrograph (i.e. longer residence time with the soil). Further details of the site and experimental layout are given in Heckrath et al (1995) and Heckrath (1998), and the specific data included in this analysis is specified in table 17 on p117 of Heckrath (1998).
3. Kingsbridge
At a farm in Devon where surface runoff is regularly generated under natural rainfall, runoff traps were established in five experimental plots (15 m × 3 m) across three fields with similar soil type, but representing a continuum of soil Olsen-P levels from 9–21 mg P kg−1. All plots were at right angles to the tramlines with a slope of between 10%–15%. The soil type across the fields was classified as Milford Association and consisted of well-drained fine loamy reddish soils over Devonian siltstone and sandstone rock.
The plots were not replicated at each location, but were simply used to record variation in SS and P concentrations in surface runoff from a range of storm events over the period December 2012 to March 2013 (0.2–10.7 mm of runoff). The design of the runoff plots was similar to that used previously for assessing the effects of fertilizer and manure treatments on P loss in surface runoff in this region (Withers and Bailey 2003). Runoff volume from a total of seven individual storm events was measured over the experimental period using a tipping bucket flow meter linked to a datalogger, with a known proportion of the runoff diverted to a collection tank for sampling. At the end of each storm, the depth of water in the collection tank was measured, then thoroughly stirred before sampling one-third of the way between the water surface and the bottom of the tank. Filtered (SRP, TDP) and unfiltered samples (SS, TP) were collected for analysis of as for Cockle Park.
4. Holbach
Fifteen unreplicated plots (15 m long × 2 m wide) were established on a uniform 5°-sloping field (Holbach) with a highly dispersive silty loam soil (Bromyard Association) at Rosemaund in central England. Different concentrations of Olsen-P were established on the plots by adding various rates of TSP fertilizer over a two-year equilibration period starting in 1998. The plots were hydrologically isolated by a gravel trench upslope of the plots and metal dividers along their length, and surface runoff was monitored over three winter periods during 2001–2004 Overland flow was collected via a 110 mm gutter pipe located at the end of each plot and fed by connecting pipes into a 160-litre plastic reception tank. After each major storm event, the runoff that had collected in the tank was measured and thoroughly stirred prior to taking a representative 250 ml sub-sample for determination of SS, SRP, TDP and TP. Further details of the experimental design, treatments and monitoring protocols are given by Withers et al (2009a). Here we use the soil analysis and surface runoff data generated in the first monitoring year, when only the larger storm events giving 10–15 mm or more of rain over a 24–48 hour period were monitored and runoff volumes were more substantial and uniform (Withers et al 2009a). Filtered (SRP, TDP) and unfiltered samples (SS, TP) were collected for analysis as for Cockle Park.
5. Other drain
A review was undertaken of field and catchment studies in the UK where P export was monitored in drainflow from areas with variable background Olsen-P status, but receiving either no P or minimal fresh P inputs (e.g. from grazing animals or fertilizer/manure applications). A summary of site and monitoring details are given in table S1.
6. Other surface
A review was undertaken of field and catchment studies in the UK where P export was monitored in surface runoff from areas with variable background Olsen-P status, but receiving either no P or minimal fresh P inputs. A summary of site and monitoring details are given in table S2.
7. EU soils
Representative bulked samples (0–10 cm) of topsoil collected from 24 selected experimental field sites across Europe using a common sampling regime were allowed to air dry naturally, sieved through 5 mm and then packed into trays measuring 0.5 m long, 0.25 m wide and 0.085 m deep to a bulk density of 1.3 g cm3. The trays had perforated bases to allow drainage and were fitted with an outlet tube at one end to allow the collection of sheet run-off. After standardized pre-wetting to field capacity, the trays were placed at an angle of 5° and simulated rainfall applied at a rate of 60 mm hr−1 for 30 min. To simulate the kinetic energy of raindrop impact, deionized water was fed by gravity through hypodermic needles and randomly dispersed through a wire mesh 9 m above the soil surface. Overland flow was collected for three successive 10 min periods after rainfall was initiated, the run-off volumes measured, and subsamples taken for determination of SS and P fractions. The loads for each 10 min period were summed and divided by the total 30 min runoff volume to give an average event flow-weighted P concentration. This runoff P dataset has previously been used to calibrate the DESPRAL laboratory test for estimating the dissolved and sediment-associated P that could be mobilized during a standardized storm event (Withers et al 2007b). Here we use the runoff P dataset to examine the effect of Olsen-P concentration measured for each EU soil for the first simulated rainfall. The different sites sampled covered a wide range of underlying lithology, soil types and farming systems as detailed in Miller (2004) and Withers et al (2007b). Filtered (SRP, TDP) and unfiltered samples (SS, TP) were collected for analysis of as for Cockle Park.
8. ADAS soils
Five field sites representative of major calcareous and non-calcareous soil types in England and Wales were established in 1994 to monitor the build-up of Olsen-P from six annual applications of either sewage sludge, livestock manure or inorganic fertilizer in relation to a nil P control. Three sites (Boxworth, Bridgets and Gleadthorpe) grew arable crops and two sites (Pwllpeiran and Rosemaund) grew grass. The soils varied in texture (5%–39% clay) and the treatments generated a range of Olsen-P levels at the end of the experiment. Full details of these replicated trials are given by Flynn and Withers (2005). In this meta-analysis, the Gleadthorpe site was excluded as Olsen-P values were too high and outside of the range of interest.
To investigate the effect of soil P build-up on the potential for P loss in surface run-off, soils from replicate plots of selected treatments at each site were subjected to a rainfall simulation experiment in February 2001. The soils were air-dried, seived to 2 mm, packed into boxes (0.24 m wide and 0.99 m long) to field bulk density, and pre-wetted to field-capacity moisture content. Each box was subjected to 30 minutes of simulated rainfall from a drip-screen rainfall simulator at a rate of 25 mm h−1 using local tapwater. The total amount of run-off collected was measured and a sub-sample taken for determination of SRP, TDP, TP and SS. Further details are given in Flynn and Withers (2005).
9. English soils
Samples of field topsoils (0–10 cm) representative of major soil types in England were collected from 14 sites under either arable or grassland cropping in 2006. After air-drying and sieving through 5 mm, the soils were packed into trays measuring 0.5 m long and 0.25 m wide to a bulk density of 1.3 g cm3. The soil trays used for the simulation were 300 mm deep with outlets both at the base, to allow some drainage, and at the soil surface to collect surface runoff. Each soil was filled with LYTAG™ (lightweight aggregate) up to within 9 cm of the outlet pipe directing surface flow to a reception and covered with a geotextile fabric which allowed drainage to take place but prevented ingress of soil into the voids in the LYTAG layer. Soil was then placed over the LYTAG, to fill the top 9 cm of the tray. The soil was packed in three 3 cm layers to a bulk density of 1.3 g cm3. Each layer required 4.875 kg of soil that was added individually and then tamped down to the required 3 cm depth before the next layer was added.
The trays had perforated bases to allow drainage and were fitted with an outlet tube at one end to allow the collection of sheet run-off. After standardized pre-wetting to field capacity, the trays were placed at an angle of 5° and simulated rainfall applied at a rate of 60 mm hr−1 for 30 min. To simulate the kinetic energy of raindrop impact, deionized water was fed by gravity through hypodermic needles and randomly dispersed through a wire mesh 9 m above the soil surface. Overland flow was collected for three successive 10 min periods after rainfall was initiated, the run-off volumes measured, and subsamples taken for determination of SS and P fractions as described for Cockle Park above. The loads for each 10 min period were summed and divided by the total 30 min runoff volume to give an average event flow-weighted P concentration. Further details of all the sites sampled are given in Hodgkinson (2007).
10. Slapton soils
Samples of runoff were collected from eight grassland and eight cultivated soils within the Slapton Ley catchment Devon, UK. on 5% slopes and with varying levels of Olsen-P soil fertility. Boxes (100 cm long, 15 cm wide and 7.5 cm deep) were driven into the soil with a hammer and simulated rainfall applied to them for 30 min at an intensity of 50 mm hr−1. Subsamples of the first 250 mL of surface runoff and of all surface runoff combined (first 250 mL plus the remaining volume, usually 6 L) were filtered (<0.45 mm), stored at 4C in the dark and analysed for SRP within one week. Further details are given in McDowell and Sharpley (2001). One soil under grass was omitted as the Olsen-P concentration (1 mg kg−1) was well below the detection limit set for the meta-analysis.
11. DESPRAL sampling sites
The field soils collected for DESPRAL analysis were from a number of different rural catchments (12 sites) and field experiments (three sites). The three experiment sites were previously established by building up different soil P fertility levels over a 2 yr period through applications of inorganic fertilizer; there were three replicates of nine Olsen-P levels at each site, and full details are provided in Knight et al (2014). At each of the catchment sites, fields or plots with similar soil type, but varying in Olsen-P concentrations were sampled (5 cm depth) and the samples gently air-dried, sieved through 5.6 mm and then dispersed according to the standardised DESPRAL methodology (Withers et al 2007b). Briefly, in the DESPRAL test, 50 g of air-dried, sieved soil is uniformly and gently shaken with distilled water in a litre cylinder for one minute. The cylinder is then left to stand for 280 seconds, representing the settling times for particles >20 μm. At the end of each settling period, a 40 ml aliquot of the dispersed suspension was taken and divided up for determination of SS, TDP and TP. The analysis was done in triplicate, except at the field experimental sites where it was done in duplicate. Further details of the sites sampled are given in Palmer-Felgate et al (2009) and Scholefield et al (2013).
Acknowledgments
This paper was produced as part of the Sustainable Arable LINK Project LK09136 funded by Defra, Biotechnology and Biological Sciences Research Council, Scottish Government, Home-Grown Cereals Authority, Potato Council, Agrivert, Origin Fertilisers, Omex Agriculture, Ostara Nutrient Recovery Technologies, Speciality Fertiliser Products, Severn Trent Water and Virotec Europe. These funding bodies did not influence the analysis of data and the conclusions drawn from this study. Data from projects PE0112, PE0121 and WQ0100NIT were funded by Department for Environment, Food and Rural Affairs, UK. Data from project SL02 as funded by the United Kingdom Water Industry Research Ltd. Thanks are also due to Dr Goswin Heckrath, Aarhus University, Denmark for his helpful comments on Broadbalk, and to Dr Rachel Cassidy and Dr Catherine Watson, AFBI, Northern Ireland for their helpful discussion on data from the CENIT site.