

Abstract
Anthropogenic climate change is leading to the intensification of extreme rainfall due to an increase in atmospheric water holding capacity at higher temperatures as governed by the Clausius-Clapeyron (C-C) relationship. However, the rainfall-temperature sensitivity (termed scaling) often deviates from the C-C relationship. This manuscript uses classifications prescribed by regional-scale atmospheric circulation patterns to investigate whether deviations from the C-C relationship in tropical Australia can be explained by differing weather types (WT). We show that the rainfall-temperature scaling differs depending on the WTs, with the difference increasing with rainfall magnitude. All monsoonal WTs have similar scaling, in excess of the C-C relationship, while trade winds (the driest WTs) result in the greatest scaling, up to twice that of the C-C relationship. Finally, we show the scaling for each WT also varies spatially, illustrating that both local factors and the WT will contribute to the behaviour of rainfall under warming.
Export citation and abstract BibTeX RIS

Original content from this work may be used under the terms of the Creative Commons Attribution 4.0 license. Any further distribution of this work must maintain attribution to the author(s) and the title of the work, journal citation and DOI.
1. Introduction
There is broad consensus within the scientific community on the presence of climate change and an anomalous rise in global average surface temperatures leading to more frequent atmospheric and marine heatwaves [1]. These changes have been forecast to contribute to increasingly frequent and intense storm events which translate to a corresponding increase in flooding [2]. However, several studies have shown little to no evidence of increases in flood magnitudes, despite documented increases in precipitation extremes, with many even indicating a decline e.g. [3–13]. Many of these studies suggest changes to other hydrometeorological factors including antecedent atmospheric conditions and snowmelt and their interaction with catchment properties such as the catchment size as possible explanations for the dichotomous rainfall/flood changes.
For catchments dominated by rain-induced pluvial flooding, such as urban catchments and smaller rural catchments, understanding the historical day-to-day sensitivity of rainfall to temperature (termed scaling) is a crucial line of evidence for informing future changes to flooding [14, 15]. Assuming invariant relative humidity and the absence of changes to large-scale (regional) circulation patterns, thermodynamic factors suggest a 7%/°C increase in the maximum amount of low-level moisture in the atmosphere, and hence extreme precipitation, as governed by the Clausius-Clapeyron (C-C) relationship [16, 17]. This mechanism of moisture holding content increasing rainfall has been successfully represented in several weather and climate models [18–21], and is found to be consistent with historically observed temperature sensitivities, thus evidencing support of the C-C scaling relationship in projecting rainfall extremes [22–25].
However, scaling behaviour is dependent on several factors, resulting in deviation from C-C scaling. The foremost is the severity of the rainfall event, with more extreme rainfall events demonstrating greater sensitivity to temperature [26]. Further inconsistency occurs with storm duration with sub-daily (e.g. hourly) rainfall scaling close to 14%/°C, often termed super C-C scaling, and longer duration (e.g. daily) rainfall scaling close to or below the C-C rate [27]. Scaling also depends on seasonality, with greater scaling observed in winter months as opposed to summer months due to lower moisture availability for higher summer temperatures [28]. Global analysis has found a latitudinal gradient for the relationship between the extreme daily rainfall intensity and surface air temperature, where monotonic increases with temperature (positive scaling) is observed at higher latitudes (>55°N) and a monotonic decrease (negative scaling) within the tropics (20°S–20°N) [25, 29, 30], an observation which contradicts historical increases in extreme rainfall across the tropical zone [24, 31, 32].
Limitations in moisture availability have been suggested to explain the occurrence of negative scaling [26], but it has also been suggested warmer temperatures may be associated with different synoptic systems and hence have different meteorological mechanisms or precipitation regimes [33]. Alternatively, other studies have suggested that a local cooling effect associated with extreme rainfall events reduces the apparent scaling rates [18, 34]. Though this has been refuted, and the use of convective point temperature suggested to better capture rainfall-temperature scaling [35]. Dew point temperature measures changes in atmospheric moisture holding capacity, as the definition of dew point is the temperature at which a parcel of air needs to be cooled at a constant pressure for saturation to occur (100% relative humidity), hence accounting for possible humidity limitations. Studies using dew point temperature for rainfall-temperature scaling have found much better correspondence to the C-C relationship, but departures still exist [25, 36–40]. With different synoptic conditions affecting precipitation regimes and deviations from the C-C relationship remaining when moisture limitations are accounted for, this study forms a timely opportunity to understand what, if any, is the effect of synoptic conditions on rainfall-temperature scaling.
Above C-C scaling may arise as a statistical artefact from the mixing of different storm types (e.g. convective vs large-scale) [41], or from cloud physics, where latent heat release induces a positive feedback resulting in greater storm invigoration at higher temperatures [17, 42]. Indeed, convective rainfall-temperature sensitivity is much greater than that of stratiform rainfall which is observed to scale at approximately the C-C rate [43, 44]. Often studies of rainfall-temperature scaling assign departures from C-C scaling to thermodynamic factors [31, 45]. However, there is evidence to suggest that thermodynamic factors mostly drive short-duration (e.g. sub-daily) extremes and that, as the temporal aggregation of extreme events grows, moisture advection through regional-scale circulation becomes increasingly important and the weather type framework takes over and drives the process [46]. The coupled response of precipitation extremes to thermodynamic and dynamical changes is evidenced to shape the scaling factors obtained [39, 47], where dynamic contribution modifies regional response, amplifying the scaling in most land areas and often dominating across subtropical regions [48]. However, the above scaling studies continue to focus on the thermodynamic contribution to changes in precipitation extremes neglecting changing atmospheric circulations which have the potential to influence future extreme rainfall projections [47, 48].
The rainfall-temperature scaling that will apply in a warmer future will most likely depend on both (a) the proportion of regional-scale weather types (WTs) occurring and (b) the air temperature in which storms develop. But the effect of synoptic conditions on rainfall-temperature scaling has only been studied in limited detail with regional-scale flow cyclonicity found to impact rainfall-temperature scaling in the UK [49]. Here, we examine the relationship between rainfall and both surface air and dew point temperature, discretised into several regional-scale WTs which cover Northern Tropical Australia and surrounding oceans (i.e. 105°–165°E, 25°S–0°). The region is characteristic for its negative scaling with air temperature [26, 31, 50] and is well documented as experiencing a short wet season from December to March influenced by low level westerlies followed by a long dry season for the remainder of the year [51–55]. We aim to answer the question: is rainfall-temperature scaling conditioned on regional-scale circulation WTs independent of thermodynamic changes, and hence, will the scaling of each WT behave in a unique manner in response to global warming?
2. Data and method
2.1. Weather typing
Moron et al [46] classified 6 hourly low-level winds from 37 wet seasons (November to March) from 1979 to 2016 into six distinct WTs. The WTs were computed using cluster analysis (k-means) of 6 hourly ERA-Interim winds at 850 hPa and were found to be a varying combination of different phenomena operating at various time scales including the diurnal and the annual cycles, interannual variations such as El Niño-Southern Oscillation (ENSO), intra-seasonal Madden Julian Oscillation (MJO), as well as faster transient phenomena such as low pressure travelling across Northern Australia. The WTs may be clustered into two broad systems, 'trade wind' and 'monsoonal' and are summarised in table 1.
Table 1. Comparative summary of the weather types (WT) where wet season is defined as November to March. Rainfall and temperature statistics are derived as an average of the 308 weather stations operating for the time of interest. Refer to Moron et al [46] for further information on WTs.
| Weather Type | WT1 | WT2 | WT3 | WT4 | WT5 | WT6 |
|---|---|---|---|---|---|---|
| Atmospheric Circulation | Trade Wind | Transitional | Monsoonal | Monsoonal | Monsoonal | Trade Wind |
| Primary Direction of 850 hPa wind over Northern Australia | East | East | East | West | West | West |
| Avg. Air Temp (°C) | 27.4 | 27.7 | 27.3 | 27.1 | 27.3 | 27.6 |
| Avg. Dew Temp (°C) | 21.2 | 22.1 | 22.9 | 23.3 | 22.9 | 22.2 |
| Avg. Wet Season Rainfall (mm/day) | 12.2 | 14.0 | 17.4 | 20.8 | 19.6 | 13.7 |
| WT Frequency (in days/wet season in Nov-March) | 35 | 24 | 25 | 19 | 22 | 26 |
WT1 and WT6 are characterized by trade winds over tropical Australia, where winds extend over Indonesia in WT1 and weak westerly flows are established north of 5°S in WT6. WT1 is almost restricted to pre-monsoon and post-monsoon seasons, while WT6 frequency is less seasonal, occurring either during (and then mostly corresponding to 'breaks') or after the monsoon. Comparatively, the least seasonal WT, monsoonal WT3, is associated with a zonal monsoon trough centred around 12°S and extending till 135°E, corresponding to the 'moist East Regime' in Darwin [56]. The remaining monsoonal systems WT4 and WT5 occur mostly from mid-December to early March. WT4, the most active phase of the monsoon, is primarily associated with a low pressure system, centred around 18°S and 120°E and with a strong westerly wind regime over most of Northern Australia (not inclusive of the Eastern coast of Queensland), corresponding to the 'deep west regime' [56]. WT5 however is better associated to the 'shallow west regime' [56], showing correspondence to fast westerlies NE of Cape York. Lastly, WT2, which lies in a phase between trade-winds and monsoonal activity known as 'transitional', is characterised by weak synoptic winds and a seasonal peak from mid-November to mid-December during the pre-monsoon season [54]. Further details on the WTs can be found in Moron, et al [46].
Less rainfall occurs for trade-wind WTs and more for monsoonal ones (table 1). Average air temperature is relatively consistent between the WTs unlike dew point temperatures which are higher for monsoonal ones. The frequency of WTs during the wet season also varies, with trade wind WTs occurring more frequently than monsoonal WTs on average, especially on either end of the wet season (not shown, see figure 3(g) of Moron, et al [46]).
2.2. Rainfall-temperature scaling
For this study, Australian Bureau of Meteorology (BoM) weather station data consisting of daily rainfall, daily mean dry bulb temperature and daily mean dew point temperature, used extensively in previous studies [31, 36], were matched with the 6 hourly sub-daily WT dataset. The 6 hourly WTs were aggregated to daily values, with the most prevalent WT chosen as the daily WT, though it should be noted that most WTs persist for several days [46]. A total of 308 weather stations were used with only wet days (>1 mm) considered for analysis.
To analyse the rainfall-temperature scaling relationship for each WT pairs of rainfall and corresponding temperature are needed. Often studies use all non-zero rainfall observations [27], whilst some use the maximum intensity within a storm [41, 57]. Here we use wet days (>1 mm) paired with both mean daily dry bulb temperature and mean daily dew point temperature, which are then analysed using quantile regression to estimate the scaling coefficient for the temperature-rainfall relationship [57]. To ensure reliability in our quantile analysis, scaling is only calculated where there are more than 50 pairs of rainfall and corresponding temperature observations conditioned on WT.
Conventionally, most studies bin pairs of precipitation and temperature data into equal width or equal sample temperature bins, for which the extreme precipitation percentiles for each bin are calculated or fitted from a distribution. The trend in the precipitation percentiles are then either visually inspected [27] or analysed through linear regression techniques [26], to determine the scaling of extreme precipitation with temperature. This method results in smaller sample sizes to analyse, possibly reducing the accuracy of the investigation. Furthermore, the binning methodology relies on the assumption that widths of the temperature bins are appropriately determined, as well as what outlier data is excluded to ensure the result is not biased [57]. The use of quantile regression has been presented as an alternative to the binning approach, whereby it has been shown to provide a more flexible and unbiased framework for determining the scaling of extreme precipitation events with temperature, thereby negating the need to assume bin sizes or exclude outlier data [57].
A key difference between quantile regression and linear regression is that the absolute deviation of the errors is minimised with a penalty weighting of p for under-prediction and (1-p) for over-prediction, as opposed to the minimisation of the sum of squared errors used by linear regression techniques. Consider the set of data pairs (xi, yi) for i = 1, ..., n. (in this context, xi is the surface temperature observations and yi is the rainfall), then the quantile regression can be expressed as [58]:

where 0 < p < 1 is the quantile and  is an error term with zero expectation. The parameters
  and
and  are chosen to minimize the cost function D defined as
The scaling relationship is given by β1(p) by taking the log value for the daily rainfall measurements in millimetres and using the transformed equation  to give the scaling rate as a percentage increase/decrease per degree Celsius [31]. Where the scaling relationship is presented as a function of temperature a RLOESS (Robust Locally Weighted Smoothing) second order local polynomial regression is applied to the mean. This non-parametric approach to fitting a smooth curve to noisy data is based on applying a weighting to data surrounding the point of analysis, whereby a lower weighting is assigned to outliers in the regression, such that it reveals the underlying temperature-rainfall scaling of the WTs [58].
3. Results and discussion
3.1. Aggregated temperature-rainfall relationship
To assess the relationship between temperature and rainfall across northern (tropical) Australia, we first pooled data across all stations from wet days (>1 mm) to confirm linearity of the rainfall-temperature relationship and to reduce noise from limited data samples [29, 59]. As dew point temperature has been shown to be a better indicator of atmospheric moisture (than temperature) in calculating scaling relationships [37, 39], the results focus on the relationship of rainfall with dew point temperature, with results for temperature presented in Supplementary Information(available online at stacks.iop.org/ERL/15/094098/mmedia). The average relationship between rainfall and dew point temperature across northern Australia is presented in figure 1.
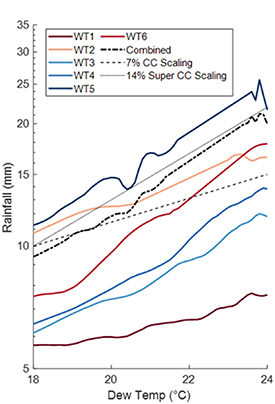
Figure 1. Relationship between mean daily rainfall and dew point temperature for each weather type using a second order polynomial RLOESS. C-C scaling (7%/°C) and super C-C scaling (14%/°C) are represented as dotted lines. Raw data is presented in figure S2 and the scaling for a single station (001013) is tabled in table S2 as an example.
Download figure:
Standard image High-resolution imageFor the interested reader the mean daily rainfall and air temperature for each WT are presented in figure S1, with fitted relationships presented in figure S3. There is a negative linear scaling for all WTs (excluding WT1 which shows a unique almost flat linear scaling), highlighting great sensitivity to thermal warming (figure S3). This is unlike the relationship in figure 1 that shows positive scaling with dew point temperature confirming previous findings that dew point temperature is a better indicator of atmospheric moisture and related rainfall intensity [25, 35, 36].
The monsoonal WT3, WT4 and WT5 and trade wind WT6 have very similar scaling and represent the greatest sensitivity to changes in dew point temperature. Close to super C-C scaling is found with the monsoonal (WT3, WT4 and WT5) but also trade wind WTs (WT6). This suggests that scaling in excess C-C is not necessarily an effect of mixing seasons or weather systems. WT1 and WT2 have scaling similar to that of the 7% C-C rate.
For both air and dew point temperature, the scaling is approximately linear and does not display a 'hook' like shape where the scaling reverses at higher temperatures. Whilst all WTs show that rainfall is positively correlated with dew point temperature and negatively correlated with air temperature, the slope of the relationships, and hence degree of association, is different, evidencing the different behavioural patterns of each system. The WTs individually replicate behaviour seen when cumulatively analysed (e.g. positive scaling with dew point temperature). Individually, the WTs appear to respond differently to a change in temperature.
3.2. Temperature-rainfall scaling with percentile
Figure 2 presents the median scaling for each WT, where the scaling has been estimated at each station individually first using dew point temperature and then taking a median across stations. The sensitivity with rainfall (non-exceedance) percentile is presented as this is known to modify the scaling calculated. For the interested reader is repeated using air temperature in figure S4.

Figure 2. Rainfall scaling of each weather type with dew point temperature. Scaling is calculated using quantile regression for each site and the (spatial) median is presented for different (non-exceedance) percentiles.
Download figure:
Standard image High-resolution image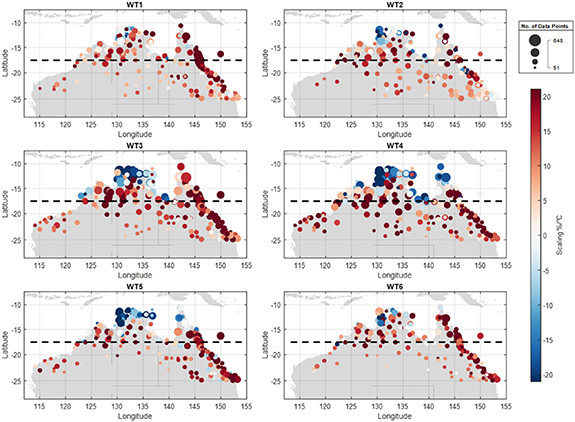
Figure 3. Spatial distribution of 50th percentile daily precipitation scaling with average daily dew point temperature across tropical Australia for each weather type. Areas of large spatial variation include northern Australia above 17.5°S and central tropical Australia below 17.5°S (separated by dashed line). Figures S7 and S8 present the spatial variation in greater detail. For the interested reader figure S9 presents the scaling aggregated across weather type. Circle size represents the number of available observations at that location.
Download figure:
Standard image High-resolution imageThere is a minimal increase in the scaling for air temperature for the most extreme events, but this is not evident with dew point temperatures confirming dew point temperature is a more robust covariate for investigating rainfall-temperature relationships being insensitive to the (non-exceedance) percentile. There is suitable evidence to support the use of dew point temperature response in the tropics [31, 36], and therefore we can consider the positive scaling relationships to have greater reliability as they better match long-term historical extreme rainfall intensity increases in the region [32].
Regardless of the percentile, WT6 produces the strongest positive scaling, consistently greater than 10%/°C. WT4, WT3 and WT1 initially demonstrate scaling greater than 10%/°C, closer to super C-C scaling, but decrease with increasing intensity, falling closer to the 7%/°C C-C rate at the most extreme percentiles. WT2 and WT5 consistently scale below 10%/°C and generally scale at, or just above, the C-C rate.
3.3. Spatial variability of temperature-rainfall scaling
The overall relationship between temperature and rainfall across WTs is presented in figures 1 and 2, but there is large spatial variation present between sites hence care is needed when interpreting spatially averaged scaling rates. As there is little difference between the scaling for different percentiles for dew point temperature, and lower percentiles exhibited less variability, figure 3 presents the 50th percentile of extreme rainfall event scaling of dew point temperature at 308 weather stations across Tropical Australia. For the interested reader figures S5 and S6 present the scaling with dew point temperature for the 90th and 99th percentile respectively. As the results differ little for higher percentiles the focus remains on the 50th percentile.
Figure 3 shows a distinct spatial variability in scaling across the continent with further variations exhibited among the six WTs. There is greater scaling further south and towards the east coast, particularly for WT3 and WT6. Although the at-site differences in scaling between WTs are predominately not significant, the spatial variation of the scaling highlights that the WTs are each subject to local factors as topography, slope orientation, etc which alter their response to temperature. There is no relationship between the difference in scaling between WTs and the sample size confirming the results are not an artefact related to differing sample size [57].
The greatest differences exist between northern Australia (blue outline) and central tropical Australia (red outline), demarcated by approximately 17.5°S. While the average scaling for (all) northern Australia stations is positive, a large number of stations exhibit negative scaling. This is very different to the largely positive scaling in the central (inland) tropical region of Australia where the moist air layer is less deep.
The analysis presented in figure 2 is repeated under different geographical regions (on each side of 17.5°S) to capture the influence of the latitudinal gradient of the rainfall-temperature relationship. Figure 4 presents figure 2 repeated for stations north of 17.5°S and figure 5 for stations south of 17.5°S. Here, ANOVA (analysis of variance) tests present that the rainfall scaling between WTs are significantly different from each other except for a few cases for each regions. The details of the ANOVA tests are available in table S1 and figure S10 of Supporting Information. Closer to the tropics (north of 17.5°S), in a similar fashion to figure 2, trade wind WT6 produces the strongest positive scaling, especially windward of the Great Dividing range, however moving southwards (figure 3), monsoonal WT3 demonstrates significantly more positive scaling. A greater confidence in scaling is captured south of the latitudinal threshold (figure 5), with less variable uncertainty produced for all WTs in this region, suggesting temperature induced changes in weather dynamics may be easier to constrain when moving away from the tropics.
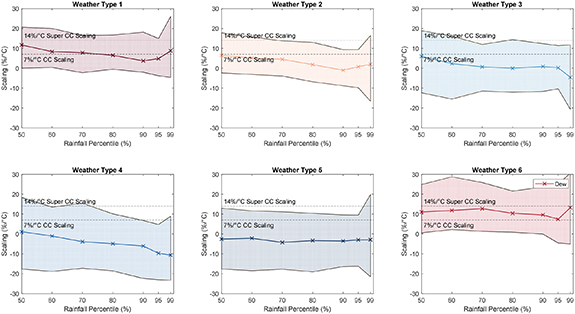
Figure 4. Rainfall scaling of each weather type with dew point temperature north of 17.5°S. Scaling is calculated using quantile regression for each site and the (spatial) median is presented for different (non-exceedance) percentiles. Each panel presents the statistical; dispersion (by interquartile range) associated each weather type for various (non-exceedance) percentiles.
Download figure:
Standard image High-resolution image
Figure 5. Rainfall scaling of each WT with dew point temperature south of 17.5°S. Scaling is calculated using quantile regression for each site and the (spatial) median is presented for different (non-exceedance) percentiles. Each panel presents the statistical; dispersion (by interquartile range) associated each weather type for various (non-exceedance) percentiles.
Download figure:
Standard image High-resolution image
Unlike the global results in figure 2, both trade wind WT1 and WT2 in scale lower in the northern region of Australia (figure 4), with WT1 scaling closer to the 7%/°C C-C scaling threshold and WT6 consistently below the 14%/°C super C-C scaling threshold at various percentiles.
This region exhibits a unique behaviour, with monsoonal WT5, increasing marginally in scaling at higher percentiles. The remaining WTs evidence a decline with increasing percentile, a similar result to that seen in figure 2. Interestingly, the monsoonal WT3, WT4 and WT5 demonstrate greater negative scaling compared to the trade wind and transitional WTs which produce significant variation in the region. In the north we find many stations with negative scaling rates and increasingly positive scaling as we move further inland (figure S7).
Irrespective of WT, the local scaling in each region demonstrates similarities to scaling over increasing percentile when analysed collectively across tropical Australia as in figure 2, however, the scaling among WTs varies with location as in figure 3. This highlights that local effects can alter the behaviour of weather systems. These effects can range from topographic variation, wind direction (leeward vs windward), moisture availability and surface temperature variability. Locations closer to the tropics demonstrate significantly more variability in scaling for the WTs whereas stations towards central Australia record more consistent scaling (figure S8). This highlights the presence of a latitudinal effect on scaling however, there is also a longitudinal variation, where the Eastern coast of Australia presents significantly more positive scaling—where there is probably a moderate-to-strong interaction with topography. For example, the Great Dividing Range along the Eastern coast of Australia may alter the way WTs interact, with easterly WTs affected by orographic lifting, and longer lasting wet events sustaining higher scaling rates at the daily scale.
4. Conclusions and implications for future studies
This study investigated the rainfall-temperature scaling relationship for tropical Australia across discretised regional-scale atmospheric patterns known as WTs. The scaling for each WT was found to be different highlighting that the rainfall-temperature scaling is not independent of dynamical changes [60], particularly in the tropics. Moreover, the scaling relationship was found to vary spatially, suggesting local as well as atmospheric effects influence the rainfall-temperature scaling relationship.
Scaling calculated using dew point temperature (as opposed to air temperature) was more consistent with the C-C relation and more stable with increasing rainfall percentile as well as spatial location across tropical Australia [31, 36, 61]. This is considered more reflective of the largely uniform observed historical increases in extreme rainfall due to warming conditions in the tropics. Monsoonal WTs (WT3, WT4, and WT5) were found have relatively similar scaling compared to the remaining WTs, generally above C-C, and varying with percentile in a similar fashion. The scaling for monsoonal WTs was found to decrease equatorward, broadly switching from positive to negative scaling rates around 17.5°S. The most sensitive WT was trade-wind WT6, responding with C-C scaling up to twice C-C in a warming environment. The consistent greater C-C scaling found for all WTs suggests that super C-C scaling may not be an artefact result of mixing WTs as speculated by other authors [41]. Indeed, scaling rates have been conditioned here on specific WT and by consequence changes in precipitation intensity along the (dew point) temperature range cannot be attributed to changes in weather systems.
Greater than C-C scaling is observed for daily rainfall whereas previously most studies identified super C-C scaling only for very short rainfall durations [42]. Indeed, higher scaling rates under anticyclonic conditions have also been reported in the UK but only for sub-daily (hourly) rainfall [49].
The stronger dependence of rainfall intensity to dew point temperature during trade-wind dominated conditions may arise due to the traveling speed of storms. Indeed, if trade windstorms move slower than monsoonal storms, they are expected to produce higher rainfall intensity locally, thereby increasing the scaling rate, especially on windward slopes where local interaction with topography may extend the duration of rainy events. In that context, the large scaling on the east coast may possibly be in response to additional (forced) convection as a result of orographic lifting. Alternatively, it is possible that trade-wind WTs encapsulate both regional-scale (at lower temperature) and small-scale convective precipitation (at higher temperature) artificially inflating the scaling rate [41, 43]. Finally, this increase may also be associated with dynamic restructuring, where the increased latent heat leads to stronger ascent, thus providing the additional increase in precipitation, amplifying the thermodynamic response by a factor of two [47].
The warming of the climate due to anthropogenic effects is well under way, but our understanding of how this will change thermodynamic and dynamical characteristics is far from well understood [48]. Changes in precipitation extremes under a warming climate are subject to substantial uncertainty [47]. The coupled scaling response of moisture driven intensification and regional-scale atmospheric contributions applied in this study aims to improve future projections of regional extreme precipitation. Studies that concentrate on only thermodynamic changes will find spatially homogeneous increases in scaling [48], a result that may not be able to address the anomalies at a regional scale.
There remains controversy over using rainfall-temperature relationships for projection of future rainfall and flood risk, as day-to-day variability may not be representative of a temporal trend [23, 62–64]. But the uncertainty from climate models and the necessity to project rainfall for future infrastructure design and planning has led to the use of temperature scaling to project rainfall [65, 66]. Previous studies have established frameworks for rainfall projection that accommodate changing WTs, with stochastic rainfall models conditioned on climatological WTs [67, 68] and models that can project extreme rainfall driven by rainfall-temperature sensitivities [69]. The results presented here suggest the combination of such models would provide far more robust and detailed rainfall projections, allowing us to better understand changes to future rainfall extremes.
Acknowledgments
This work has been undertaken as part of a Discovery Project (DP200101326, Assessing Water Supply Security in a Nonstationary Environment) funded by the Australian Research Council. Climate data was obtained from the Australian Bureau of Meteorology and can be found at www.bom.gov.au/climate/. Weather types are available on request from the authors. Conrad Wasko receives funding from the University of Melbourne McKenzie Postdoctoral Fellowships Program.
Data availability statement
The data that support the findings of this study are available upon reasonable request from the authors.