

Abstract
Recent extreme fire seasons in California have prompted utilities such as Pacific Gas and Electric to pre-emptively de-energize portions of the electrical grid during periods of extreme fire weather to reduce the risk of powerline-related fire ignitions. The policy was deployed in 2019, resulting in 12 million person-days of power outages and widespread societal disruption. Retrospective weather and vegetation moisture data highlight hotspots of historical risk across northern California. We estimate an average of 1.6 million person-days of de-energization per year, based on recent historical climate conditions and assuming publicly stated utility de-energization thresholds. We further estimate an additional 70% increase in the population affected by de-energization when vegetation remains abnormally dry later into autumn—suggesting that climate change will likely increase population vulnerable to de-energization. Adaptation efforts to curtail fire risk can be beneficial, but efforts to prepare affected populations, modernize the grid, and refine decision-making surrounding such policies have high potential to reduce the magnitude of negative externalities experienced during the 2019 de-energization events.
Export citation and abstract BibTeX RIS
1. Introduction
Wildfire-related hazards and associated costs have escalated in recent decades across much of the western U.S. resulting from several converging factors, including human settlement patterns; a warming and drying climate shaping increasingly severe fire seasons; fuel accumulation from a century of fire suppression; and abundant ignition sources (Abatzoglou and Williams 2016, Schoennagel et al 2017, Radeloff et al 2018). California represents an epicenter of human-centric fire impacts, with a large population and fire-adapted ecosystems. In 2017 and 2018, multiple catastrophic wildfires across California produced over 150 fatalities, the loss of over 25 000 homes, and $50 billion USD in damages. These catastrophes were enabled by exceptionally warm summer temperatures and the extension of anomalously warm and dry conditions into autumn (Williams et al 2019, Goss et al 2020), when offshore winds such as Santa Ana winds in southern California and Diablo winds in the San Francisco Bay Area commence (Abatzoglou et al 2013, Smith et al 2018).
Unprecedented destruction during recent fire seasons has triggered efforts to mitigate future risk, including statewide investment in rapid fire detection, increased vegetation management, and ignition reduction. One specific tactic focuses on so-called 'powerline fires' caused by electrical transmission and/or distribution infrastructure. While powerlines account for only 1% of fire ignitions statewide (Keeley and Syphard 2018), half of the 20 most destructive fires in state history were caused by powerlines, including the deadly 2018 Camp Fire (Nauslar et al 2018, CalFire 2020).
Ensuing litigation and scrutiny have prompted large investor-owned utilities to implement de-energizing policies in order to negate powerline-caused ignitions during extreme fire weather conditions. After entering bankruptcy in response to the deadly northern California fires in October 2017 and November 2018, the largest electrical utility in California, Pacific Gas and Electric (PG&E), implemented extensive pre-emptive de-energization events in 2019 following strategies deployed in portions of southern California over the past decade. Termed a Public Safety Power Shutoff (PSPS), PG&E de-energized portions of the electric grid based on predicted critical fire weather conditions.
The delayed seasonal onset of precipitation in 2019 kept vegetation dry into October and November, prompting multiple large-scale PSPS. While some have highlighted successes of PSPS in limiting powerline-caused fires during autumn 2019, the vast scope of resultant outages led to public outcry due to the serious negative externalities stemming from widespread and in many cases prolonged, multi-day power outages—including closure of businesses and schools, as well as communication system breakdowns (including loss of internet and cell phone coverage). Furthermore, the wholesale implementation of PSPS across a large and diverse geographic territory illuminated stark differences in levels of resilience and adaptability among individuals and communities. Disproportionately adverse impacts were felt in disadvantaged communities both in rural areas and across portions of the urbanized San Francisco Bay Area, including the direct financial impact of preparing for and recovering from outages of initially unknown duration (e.g. temporary loss of wages, spoilage of stored food, and securement of backup power supplies). In addition, individuals with disabilities who rely on electricity for respiratory support systems such as breathing aids and mobility devices such as electric wheelchairs faced substantial challenges during PSPS in 2019. Collectively, costs of PSPS in 2019 were estimated at $10 billion USD (Senate Committee Hearing, 2019)—comparable to costs of many recent large fire events.
Here, we compare the scope of implemented PSPS and affected population during 2019 to estimates based on the objective de-energization criteria. We further quantify the climatological footprint of de-energization criteria across Northern California using 13-years of output from a high-resolution weather model and resultant population exposure given current grid sectionalization and population. Finally, we tabulate the additional population-based exposure through experiments that allow dry vegetation moisture to persist into autumn given observed and projected increases in autumn aridity (Goss et al 2020). Geospatial efforts such as these can help inform energy sector and public policy adaptation approaches to escalating wildfire challenges in California and other fire-prone regions of the globe.
2. Datasets and methods
Public-facing criteria for PSPS, as stated by PG&E in April 2020, include predicted elevated fire weather conditions (wind speeds >11.15 m s−1 and relative humidity, RH <20%) and dry vegetation (i.e. fuels). Other factors, such as issuances of Red Flag Warnings by the National Weather Service, are also considered. We used hourly meteorological data during Oct 2000-Sep 2013 from the Weather Research and Forecasting (WRF) model run at a 4-km horizontal resolution across North America (Liu et al 2017) to estimate occurrence of fire weather conditions meeting stated PSPS criteria (i.e. wind speeds >11.15 m s−1, RH <20%, and 'dry fuels'). We complement the climatological analysis and facilitate a comparison with implemented PSPS during 2019 using hourly wind speed and RH from a high-resolution operational weather prediction model (High Resolution Rapid Refresh Model, HRRR, Blaylock et al 2017) and fuel moisture metrics from gridMET (Abatzoglou 2013).
In contrast to stated PSPS thresholds for wind speed and RH, the criteria for dry fuels (as defined by PG&E) are ambiguous. Hourly mean wind speed, air temperature, precipitation, relative humidity, and downward shortwave radiation flux at the surface from WRF were used to calculate a suite of daily fire danger indices from the National Fire Danger Rating System (NFDRS, (Cohen and Deeming 1985). From these indices we used 10-hr and 100-hr dead fuel moisture (DFM) that approximate fuel dryness for varied-diameter vegetation. Two metrics as proxies for live fuel moisture (LFM) were also used: Energy Release Component (ERC) from NFDRS (using a single fuel model ubiquitously used in the western US, dense conifer), and soil moisture in the top 1-m from WRF. We calculated the percent normalized soil moisture for each grid cell by linearly transforming daily data bounded by the local maximum and minimum per the period of record as 100 and 0, respectively following the generalized approach of Jolly et al (2015). While most efforts to monitor LFM are in-situ or guided by remote sensing, proxies like soil moisture are being increasingly considered and ERC is a commonly used output from NFDRS that is broadly used in fire potential monitoring that entrains modeled LFM and DFM.
We developed empirical criteria for dry fuels conducive to the occurrence of large powerline-caused fires by pairing observed powerline-caused fires with fuel moisture metrics on the date of fire discovery. A total of 770 wildfires on PG&E lands were officially classified as powerline ignitions between Oct 2000–Sep 2013 (CalFire 2020, Short 2014; figure 1(a)). We note this likely does not comprise the entire population of powerline caused fires, as fires currently under litigation are often listed with no official known cause. We explicitly focus on DFM and LFM concurrent with the top two percent of powerline-caused fires by burned area. The top two percent of powerline-caused fires were ≥ 40 ha, a threshold that has been broadly used to distinguish large fires in previous studies (Abatzoglou, Balch, Bradley, & Kolden, 2018).

Figure 1. (a) Location of all (black) and large (>40 ha, red) powerline-caused wildfires within PG&E lands during 2000–2013. Aggregated land cover classifications from MODIS denoted by colors. (b) Cumulative distribution of 10-hr (solid) and 100-hr (dashed) dead fuel moisture for large (red) and other (black) powerline caused fires. (c) Cumulative distribution of Percent Normalized Soil Moisture (solid) and Energy Release Component (ERC, dashed) for large (red) and other (black) powerline caused fires.
Download figure:
Standard image High-resolution imageLarge powerline-caused fires occurred under distinctly drier DFM and LFM than other powerline-caused fires with approximately 80% of large fires coincident with dry DFM, defined as FM10≤5% and FM100≤8% (figure 1(b)), and dry LFM, defined as ERC ≥65 and percent normalized soil moisture ≤ 40 (figure 1(c)). These thresholds provide a quantitative basis for dry DFM and LFM and are in general agreement with previous studies and operational fire management. Complementary analysis using hourly wind speeds and relative humidity show that many of these large powerline-caused fires ignited on days with substantially lower maximum hourly wind speeds than those stated by PSPS criteria (figure S1 (https://stacks.iop.org/ERL/15/094046/mmedia)). Hereafter, we exclude areas with more than 75% 'unburnable' land covers defined as agriculture, barren, or urban from MODIS as well as lands that average <300 mm of precipitation per year that support lower levels of biomass. While fires do occur in non-agricultural semi-arid lands, primarily found on the leeside of the coast range in central California and southern San Joaquin Valley, they represent only ∼25% of powerline fires on PG&E lands during 2000–2013. Moreover, this subset of powerline fires generally occur outside of significantly populated regions—substantially reducing risks to the wildland-urban interface and are primarily located outside of defined PSPS zones as of 2019.
We formally defined PSPS conditions as coincident hourly RH≤20% and wind speed ≥ 10 m s−1 being met at least one hour in a calendar day with dry fuels using the aforementioned criteria (FM10≤5%, FM100≤8%, ERC ≥65, and percent normalized soil moisture ≤ 40; percent normalized soil moisture was not available for 2019 and omitted in estimates). We used a slightly reduced wind speed criteria given the underprediction of modeled maximum wind speed in complex terrain (Jiménez and Dudhia 2012), particularly given flow nonlinearities associated with downslope wind storms (Smith et al 2014, 2018), as well as forecasts that may include models of finer horizontal resolution or different parameterization schemes (that may resolve slightly stronger localized wind speeds) and forecast error (that may forecast winds stronger than observed, particularly if ensemble forecasts are used). We further explore the sensitivity of thresholds for wind speed and DFM.
We complement our analysis using a dry autumn vegetation experiment that fixes dead and live fuel moisture during October-November of each year to September climatological average—effectively propagating late summer vegetation dryness into late autumn. Wind speed, relative humidity, and FM10 are left unchanged. This experiment effectively provides a measure of the potential added de-energization incurred during anomalously dry autumns—conditions similar to those that have historically enabled many large wind-driven wildfires in California.
Potential de-energization days were mapped to PG&E PSPS zones and used to estimate population exposure. Given the propensity for transmission lines to extend across PSPS zones, we performed two calculations—one using all grid cells within each PSPS zone includes widespread lower-voltage transmission lines (D-lines), and the other limited to grid cells containing high-voltage (T–1) transmission lines. Gridded 1-km population estimates for the year 2020 (CIESIN, 2018) were used to approximate the number of person-days directly affected by de-energization. This was accomplished by tabulating the population within each PSPS polygon and assuming that de-energization occurs for the entire day meeting criteria and remains for the subsequent day given the stated delays in restoring power by PG&E. We acknowledge the length of de-energizations is likely to vary substantially from event to event based on the magnitude of fire weather conditions and resultant impacts on infrastructure.
Implemented PSPS were acquired from the California Public Utilities Commission (CPUC, 2020). These data report the date and time of PSPS commencement and energy restoration as well as affected residential customers. Person days of de-energization were calculated by multiplying each implemented PSPS by the duration of each de-energization and population in each zone. The latter was approximately by multiplying the number of affected residential customers by 2.96 persons per household, per the California statewide average (US Census Bureau, 2019).
3. Results
Approximate 12 million person-days of de-energization through PSPS were implemented across PG&E lands in 2019. More than half of these outages occurred during a single 3-day period (26–28 October) that brought widespread PSPS to a substantial fraction of PG&E total customers, ultimately leading to 7.5 million person-hours of de-energization (figures 2(a), (c)). By contrast, our analysis yields a lower estimated affected population, totaling just over eight million person-days in 2019—including 4.8 million person-days during the 26–28 October event (figures 2(b), (c)). The disparity between implemented and estimated de-energization, ostensibly using the same objective criteria, is evidenced by the more widespread nature of affected regions during the 26–28 October 2019 event, including the more densely populated portions of the San Francisco Bay Area (figures 2(a), (b)).
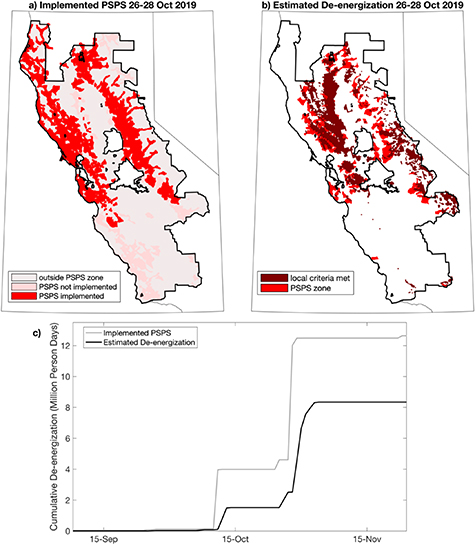
Figure 2. Maps illustrating the extent of (a) implemented PSPS and (b) estimated de-energization based on local weather and fuel moisture conditions meeting PSPS criteria (see methods) and mapped to PSPS zones during 26–28 Oct 2019 event across PG&E lands (black border). In panel (a) areas colored pink were in zones where PSPS were not implemented, and areas in beige were outside a PSPS zone; dark red in panel (b) reflect pixels where local criteria were met. (c) Time series of cumulative person days of de-energization from PG&E for 2019 from implemented PSPS (grey) and estimated exposure based on objective criteria mapped to PSPS zones (black).
Download figure:
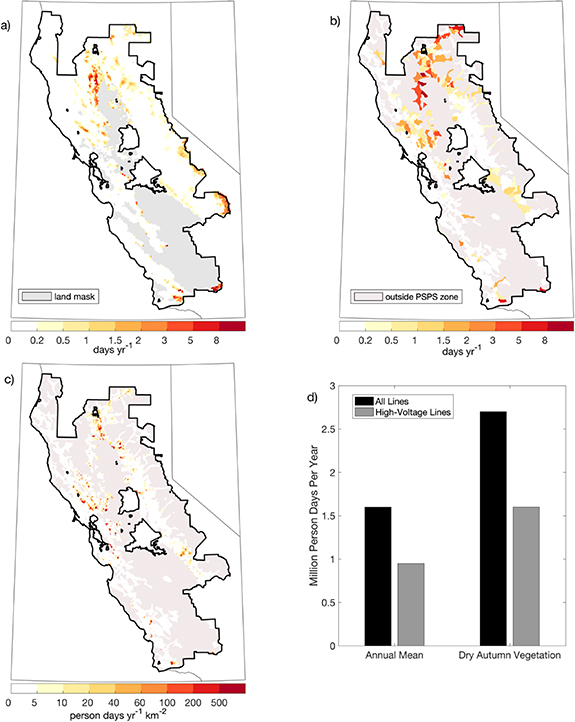
Standard image High-resolution imageClimatological analysis shows hotspots where criteria for de-energization are met, on average, 2–8 d per year across northern and eastern portions of the PG&E service area, including 1–2 d per year across the periphery of the greater San Francisco Bay Area where population density is higher (figure 3(a)). When these local de-energization hotspots are mapped to PSPS polygons, we find prominent zones of de-energization in the northern portion of the service area as well as more densely populated regions that are prone to larger population-based exposure (figures 3(b)–(c)). We estimate an annual average population exposure of 1.6 million person-days per year—well less than implemented 2019 PSPS exposure (figure 3(d)). We find large interannual variability in population exposure ranging from 0.3 to 4.1 million person-days per year, with approximately 70% of person-days during Sep–Oct.
Figure 3. Average number of days per year during 2001–2013 meeting de-energization criteria for (a) local conditions (gray shows unburnable land mask, see methods), and (b) PSPS zones (beige shows land not subject to PSPS as of 2019). (c) Estimated population exposure from PSPS in annual person-days km−2. (d) Summaries of average annual person-days of de-energization for PG&E lands and for dry autumn vegetation experiments. Black and grey bars show differences in affected population considering all and only high-voltage transmission lines, respectively.
Download figure:
Standard image High-resolution image
Additionally, we find an additional 1.12 million person-days per year of de-energization exposure (70% increase) with the persistence of anomalously dry vegetation into October and November (figure 3(d))—a potential analogue for warming and drying autumns as a result of climate change. Dry fuels, especially later in autumn, predispose the region to heightened wind-driven fire risk, and thus to potential de-energization, due to the increased prevalence of seasonal offshore winds at this time of year.
We find substantial sensitivity to wind speed and fuel moisture thresholds for de-energization (figure S2). Notably, we show a 210% increase in population exposure using 1 m s−1 decrease in wind speed thresholds (i.e. 9 m s−1), and a 32% increase in population exposure using 1% higher dead fuel moisture thresholds (i.e. FM10≤6%, FM100≤9%). These results suggesting that objective criteria to de-energize are highly sensitive to threshold criteria as well as model errors or biases.
4. Discussion and conclusions
The confluence of extreme fire weather and fire-prone vegetation suitable for powerline-caused ignitions is widespread across northern California, with many risk hotspots located in topographically aligned corridors coincident with transmission lines. In 2019, however, PG&E implemented PSPS somewhat beyond that objectively meeting criteria for de-energization. The noted differences may be a consequence of a variety of factors, possibly including the criteria for defining dry fuels, increased risk aversion following recent fire catastrophes, and differences in wind speeds across predictive weather models used in the decision-making process by PG&E. Likewise, our estimates of de-energization included only one full calendar day after criteria were met. Such estimates underestimate the time-to-restoration in some cases given the caution applied in re-energizing distribution lines after potentially damaging wind events, and thus likely partially account for the difference in actual versus estimated population exposure.
Despite lingering uncertainties regarding background, we emphasize that an annual average of 1.6 million person-days of de-energization is expected across the PG&E service area under recent historical climate conditions, including several communities that will be subject to frequent de-energization. This represents a potentially large societal and economic burden, as was evidenced by the observed effects in 2019. We therefore suggest that targeted efforts to refine objective criteria for issuing PSPS and other fire early warning systems has the potential to substantially mitigate the observed negative societal impacts of PSPS. Indeed, the prospect of repeated PSPS events may elevate incentives for micro-grid development by electric utilities and investment in off-grid systems for generation and storage to improve resilience to PSPS.
There are potentially significant concerns relating to the socioeconomic equity of such an approach, however, especially in marginalized, low-income, or otherwise vulnerable communities. Frequent de-energization events in high fire risk areas may act to further amplify pre-existing disparities between communities with the capacity and resources to adapt to these disruptions and communities without such capacity (Collins 2008, Wigtil et al 2016); marginalized communities are already at greater risk of exposure to wildfire due to limited adaptive capacity to mitigate exposure (Ojerio et al 2011). While further analysis is required to quantify the negative externalities of PSPS in a broader societal context, it is clear that solutions must be the product of collective decision-making from entities beyond electric utilities (such as local, regional, and state-level governments, energy regulators, and community stakeholder groups) to ensure vulnerable residents are protected and not increasingly marginalized through outcomes shaped by ongoing de-energization events.
Furthermore, while de-energization may reduce the frequency of powerline fires, it will not reduce other human-caused ignitions during offshore wind events (Kolden and Abatzoglou 2018). While this study focused on much of northern California, de-energization to mitigate fire disasters is already implemented by utility providers in southern California and is being considered in other fire-prone regions around the globe—suggesting that similar analyses are likely to be applicable in other geographies.
Finally, we emphasize that climate change is likely to increase wildfire activity throughout California (Westerling 2018). Warming temperatures, increased evaporative demand, as well as a narrowing wet season (Swain et al 2018) will lead to further aridification of vegetation and enable an extension of such conditions later into autumn (Goss et al 2020), when offshore winds are common. While slightly decreased offshore winds are projected in southern California (Guzman‐Morales and Gershunov 2019), there is no such evidence for a decrease in autumn offshore winds in northern California. Thus, on balance, continued climate change will likely yield an increase in extreme fire weather conditions that meet current de-energization criteria. Our findings in the present study strongly suggest that increasing autumn aridity will likely contribute to substantially increased de-energization burdens in a warming climate, absent utility-scale interventions. Continued efforts to reduce fire impacts to communities through reduced ignitions, advancement of fire resilient communities, and vegetation management (Smith et al 2016) are needed in light of the dual threats of an expansion of the wildland urban interface and climate change.
Acknowledgments
The data that support the findings of this study are openly available. D L S was supported by a joint collaboration between the Institute of the Environment and Sustainability at the University of California, Los Angeles; the Center for Climate and Weather Extremes at the National Center for Atmospheric Research; and the Nature Conservancy of California. J T A and C A K were partially supported by NSF grant DMS-1520873.