

Abstract
We used historical Landsat imagery to monitor forest degradation from charcoal production in the main supplying region of the Mozambican capital, Maputo, during a ten-year period (2008–2018). We applied a change detection method that exploits temporal NDVI dynamics associated with charcoal production. This forest degradation temporal sequence exposes the magnitude and the spatial and temporal dynamics of charcoal production, which is the main forest degradation driver in sub-Saharan Africa. The annual area under charcoal production has been steadily increasing since 2008 and reached 11 673 ha in 2018. The total forest degraded extent in the study area during the 10-year study period covered 79 630 ha, which represents 68% of the available mopane woodlands in 2008. Only 5% of the available mopane woodlands area remain undisturbed in the study area. Total gross carbon emissions associated charcoal production during this 10-year period were estimated in 1.13 Mt. These results mark forest degradation from charcoal production as the main driver of forest cover change in southern Mozambique. They also denote that, while charcoal production may be relatively localized in space, its implications for forest cover change and carbon emissions in a sub-Saharan African context are relevant at larger geographical scales. This study represents a proof of concept of the feasibility of medium resolution Earth observation data to monitor forest degradation from charcoal production in the context of the growing urban energy demand. It also highlights the potential opportunities to improve REDD+ monitoring, reporting and verification efforts in sub-Saharan Africa as a first step toward designing effective management and policy interventions.
Export citation and abstract BibTeX RIS

Original content from this work may be used under the terms of the Creative Commons Attribution 3.0 licence. Any further distribution of this work must maintain attribution to the author(s) and the title of the work, journal citation and DOI.
Introduction
African tropical woodlands account for large uncertainties in the global carbon balance (Ciais et al 2011, Valentini et al 2014). Existing inventory observations are sparse, and the lack of long-term monitoring strategies limits our ability to study changes in these systems (Pelletier et al 2018). As a consequence, terrestrial ecosystem models have not normally been calibrated and validated for tropical woodlands (Ciais et al 2011, Hill et al 2013, Mitchard et al 2013a). While it is increasingly acknowledged that forest degradation accounts for a significant component of carbon emissions, its contribution to changes in carbon stocks in sub Saharan Africa (SSA) remains uncertain (Bombelli et al 2009, Ciais et al 2011).
Forest degradation refers to a loss of carbon stock within forests that remain forests (IPCC 2003). This loss implies a reduction of the capacity of a forest to provide goods and services (FAO 2006). Forest degradation includes several processes with different drivers and impacts on carbon stocks. Guidelines of programs for reducing emissions from deforestation and degradation, conservation and management of forest carbon stocks (e.g. REDD+) encourage countries to identify and describe individual activities and drivers causing forest degradation as an initial step to define suitable methods for measuring, verifying and reporting, as well as formulating appropriate strategies and policies (Herold et al 2011). However, quantitative information on the drivers and activities causing forest degradation and their contribution to forest emissions are largely unknown (Hosonuma et al 2013). A critical step in estimating forest degradation is a well-designed field-sampling scheme to collect carbon stock data on the ground (GOFC-GOLD 2016, Herold et al 2011). However, the forest inventory programs of countries in the region lack consistent measurements to assess carbon stock changes over time.
Degradation implies changes in the structure of the forest and does not involve a change in land use, and it is often not detectable with passive remote sensing imagery (De Fries et al 2007, Herold and Johns 2007, Herold et al 2011). Thus, while forest degradation processes associated with major canopy fires, large infrastructure projects and mining activities can be consistently detected with medium and high spatial resolution imagery, subtle and smaller scale processes such as fuelwood collection, charcoal production and non-timber forest product collection have proved to be extremely hard to detect with optical remote sensing data (GOFC-GOLD 2016). Active remote sensing technologies such as an L-band synthetic aperture radar (SAR) are capable of detecting forest degradation locally (Ryan et al 2012, Mitchard et al 2013b), yet, these data are not currently publicly available, and thus not currently suitable for wide area monitoring.
Charcoal production is indicated as a main component of forest degradation in SSA (Chidumayo and Gumbo 2013, Hosonuma et al 2013). Nevertheless, forest degradation driven by charcoal production is still insufficiently understood and poorly quantified (Bolognesi et al 2015). Regional data on charcoal are usually generated from surveys and compilation of official national statistics, but the charcoal sector is largely informal and poorly regulated and this information is often unreliable and incomplete. Because of the localized and itinerant nature of charcoal production, traditional forest inventory sampling schemes and permanent sample plots may not be suited to capture information about charcoal production. As a result, our understanding of the drivers, the spatial and temporal dynamics and intensity of the processes is limited. Most countries in SSA lack reliable estimates of the real magnitude of charcoal's influence on the regional forest carbon balance. Charcoal production involves a selective removal of trees within a certain area that leaves clear-cuts at small spatial scales or removes portions of aboveground biomass (AGB). This partial removal of trees does not necessarily result in significant variations of the spectral signal at medium spatial resolution because the remaining vegetation and the rapid tree regeneration maintain a mostly vegetated surface.
The African urban population is rapidly growing. While only 30% of the African population lived in urban centers in 2000, this figure will reach 60% by the year 2050 (United Nations Human Settlements Programme 2010, Grant 2015). Close to 80% of African urban households use charcoal as their main source of cooking fuel. Charcoal is expected to remain the main source of energy in the near future and its overall consumption will rise by 2040. The growing urban charcoal demand is triggering a shift in traditional charcoal production patterns. The new patterns involve higher AGB extractions and more intense forest degradation. Concurrently, as more medium resolution sensors (e.g. Landsat-8, Sentinel-2, DMC) become available, the potential availability of images during the short temporal window in which the process is observable increases. Thus, a process previously undetectable could now theoretically be observed with optical medium resolution remote sensing imagery in areas of intense charcoal production. This manuscript exploits the Landsat archive to characterize the spatial and temporal dynamics of charcoal production in a main supply area of an African capital. Our work sheds light on the magnitude and pace of the main forest degradation process in SSA and its contribution to carbon emissions. This is, to our knowledge, the first multitemporal analysis of forest degradation from charcoal production in SSA using medium resolution remote sensing EO data.
Study area
The study area is the Mabalane district in the province of Gaza, southern Mozambique (figures 1 and 2). The district has an area of 9107 km2 and it is located approximately 300 km away from Maputo, the capital and main urban area of the country with 2270 778 inhabitants (Instituto Nacional de Estatística—INE 2017). The climate is tropical arid with annual rainfall averaging 530 mm, concentrated from November to March and average annual temperature of 24.2 °C. The area is dominated by mopane (Colophospermum mopane) and cimbirre (Androstachys johnsonii) woodlands. Both tree species form monospecific stands. Combretum-dominated woodlands are found in areas previously used for charcoal production. Charcoal production in Mabalane is highly selective and the majority of the production is concentrated in mopane stands with large trees. Charcoal production is the main driver of forest degradation in Mabalane (Woollen et al 2016). Due to soil fertility limitations, farming is restricted to land around villages and floodplains of major rivers in the south of the district (Hengl et al 2015). As a consequence, seasonal management fires associated with agricultural practices are not frequent. Low intensity grazing is also a main livelihood in the study area.

Figure 1. Location map of the study area (Mabalane district).
Download figure:
Standard image High-resolution image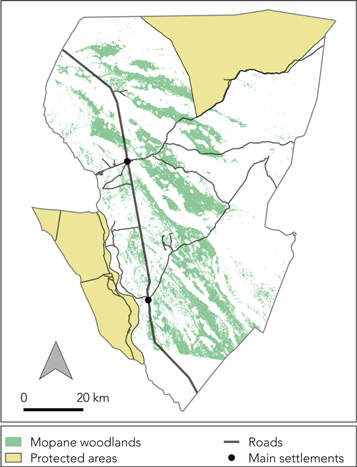
Figure 2. Distribution of mopane woodlands, protected areas, roads and main settlements in Mabalane district.
Download figure:
Standard image High-resolution imageDatasets
We used annual cloud free images from the Landsat archive between 2007 and 2018. Images between 2007 and 2012 corresponded to Landsat 5 TM and Landsat 7 ETM + and images after March 2013 were from Landsat 8 OLI. Images from the three sensors were Tier 1 calibrated top of atmosphere reflectance (Chander et al 2009). Band reflectance between the different sensors were intercalibrated to enable comparison (Roy et al 2016). Landsat scene Path 168 Row 76 covers 97% of the study area. The area not included in the scene in the southernmost tip of the district is dominated by agricultural use and was therefore left out of the analysis.
Intense tree regeneration after charcoal production commonly results in a rapid recovery of the spectral signal to pre-disturbance values within a year (figure 3).

Figure 3. NDVI phenological curves for charcoal production site (orange) and undisturbed mopane woodlands (blue). Red box identifies period of charcoal production. NDVI remain lower than in undisturbed mopane woodlands for approximately 200 d after charcoal production disturbance. Then, vegetation regeneration results in higher NDVI values than in undisturbed mopane woodlands.
Download figure:
Standard image High-resolution imageThus, consistent monitoring of forest degradation from charcoal production requires annual imagery. Annual images were selected from the same acquisition window to facilitate comparison between successive years. This acquisition window was identified to maximize the spectral differences between charcoal and non-charcoal production sites. Rainy season images provide reasonable separability but frequent cloud coverage hinders its availability for every year during the study period. In the other hand, the contrast between vegetated surfaces gradually decreases as the dry season progresses and dry season images are often contaminated by aerosols and smoke from regional seasonal fires. Thus, the transition months between rainy and dry seasons (April–June) were identified as the most suitable acquisition window to ensure sufficient spectral separability while offering enough cloud free images over the study period (figure 3). We acquired cloud free images within the selected acquisition window for every year between 2007 and 2018 with the exception of 2012, for which there were no images available. We used a set of WorldView-2 high-resolution images (2 m) to generate an independent validation dataset. This set of images included data for the years 2013, 2014 and 2016 (table 1) and were obtained from the NASA National Geospatial Intelligence Agency (NGA) archive (Neigh et al 2013). To quantify the impact of charcoal production on AGB we collected field information on dominant stand height and basal area for undisturbed mopane woodlands and charcoal production sites (see supplementary materials, available online at stacks.iop.org/ERL/15/015001/mmedia).
Table 1. High-resolution images per year for validation exercise.
| Year | Number of images | Area covered (km2) |
|---|---|---|
| 2013 | 4 | 818.34 |
| 2014 | 5 | 1353.76 |
| 2016 | 6 | 2058.40 |
Methods
We map the annual evolution of forest degradation from charcoal production in Mabalane district between 2007 and 2018 based on historical Landsat imagery. Charcoal production results in a partial reduction of AGB (Ribot 1993) and a consequent short-lived decline in NDVI values. Because of an intense post-disturbance vegetation regeneration, NDVI values experience a rapid recovery in the successive year (figure 4).

Figure 4. Flow chart of annual forest degradation associated with charcoal production change detection approach.
Download figure:
Standard image High-resolution imageWe apply a change detection method that exploits temporal dynamics of the NDVI signal associated with charcoal production (Tucker et al 1985) (figure 5). The change analysis focused on the mopane woodlands of the study area where the majority of charcoal production occurs. Mopane woodlands extent at the beginning of the study period was defined from a 2007 LCLU map created for this purpose using Landsat 5 and 7 imagery and a supervised classification algorithm (see supplementary materials). The mapping strategy implements an image differencing approach between NDVI images of the same season (April–June) from successive years (equation (3)). Significant drops in the NDVI signal of consecutive years are associated with charcoal production AGB removals (figure 6).
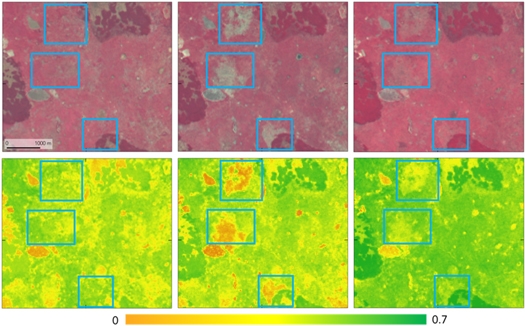
Figure 5. Detail of changes in mopane woodlands from charcoal production (blue squares) over a three-year period. Top row: OLI Landsat 8 false color (854) from April to June acquisition window. Bottom row: corresponding NDVI images. The decrease in NVI values after charcoal production is soon compensated a year after disturbance.
Download figure:
Standard image High-resolution image
Figure 6. Detail of Landsat 8-based detection of charcoal production areas. OLI Landsat 8 false color (854) for (A) 2013 and (B) 2014; (C) areas of intense interannual NDVI variation associated with charcoal production; (D) kiln scars in near infrared band of WorldView-2 high-resolution (2 m) for subset area (red box in C).
Download figure:
Standard image High-resolution imageAtmospheric effects and interannual seasonal variations are a potential source of variability in the spectral signal of stable land surfaces over time. These variations can affect interannual change detection based on image differencing. To account for these potential variations, we intercalibrated NDVI image pairs from consecutive years taking as reference the NDVI variations from year to year in known stable mopane woodland locations (equations (1) and (2)). These reference mopane woodland locations were extracted from an ad-hoc LCLU map created from 2018 Landsat 8 imagery (see supplementary materials).


where C is the intercalibration factor between images from successive years;  is the average NDVI value for undisturbed mopane woodlands in year t;
  is the average NDVI value for undisturbed mopane woodlands in year t − 1;
  is the calibrated NDVI value in year t − 1.

where D is the NDVI variation between successive years;  is the NDVI value in year t;
  is the NDVI value in year t − 1.
Forest degradation extent was mapped from difference images using a region growing approach. Seeds were selected using the Otsu's thresholding approach. Otsu's thresholding is a clustering-based image thresholding that assumes a bimodal histogram and maximizes interclass variance (Otsu 1979). Given that charcoal production is the main driver of forest disturbance within the mopane woodlands of the study region, a bimodal distribution is expected. Subsequently regions were allowed to grow from seeds until pixel values exceeded a pre-established NDVI threshold defined from the distribution of NDVI values in seed pixels. While the first stage of this process avoids the definition of ad-hoc thresholds. The second reduces the potential sensitivity of clustering-based image thresholding to the relative size of the charcoal production sites. The outcome was a forest degradation map for each year in the study period.
Since NDVI variations cannot be directly related to changes in forest AGB stocks, we applied an extraction rate obtained from field observations to estimate AGB extractions and gross carbon emissions:

where AGBy is the total AGB extracted in a given year y; Fdegy is the annual forest degradation extent; agby is the sum of standing AGB in the degraded forest extracted from Bouvet et al (2018) and, ER is the AGB extraction rate obtained from field measurements. Similarly, CEy corresponds to the annual gross carbon emissions in a certain year and CF is the default carbon fraction of dry matter (Penman et al 2003) (see supplementary materials).
Results
We produced a dataset of annual forest degradation maps between 2008 and 2018 for the district of Mabalane based on historical Landsat imagery (figure 7). We validated annual maps for 2013, 2014 and 2016 using an independent dataset generated from visual interpretation of WorldView-2 high-resolution images (2 m) (table 1). The validation dataset included 279 points blindly selected within the mopane woodlands, with 152 points in sites without charcoal production and 127 in charcoal production sites. The comparison against the validation dataset produced a commission error of 2% and omission error of 6.3% with a Kappa coefficient of 0.92 (table 2, Case 1). In 3.93% of the cases, the location of the charcoal production validation points was not mapped as forest degradation in the medium resolution dataset but they were nearby (less than 100 m). These areas correspond to pixels at the border of charcoal production areas, where AGB removal is less intense with lower associated NDVI variations. When these edge points were considered within the charcoal production areas, commission and omission error were 2% and 2.4%, respectively, and Kappa coefficient rose to 0.96 (table 2, Case 2).

Figure 7. Map of annual forest degradation from charcoal production from 2008 to 2018 in the district of Mabalane.
Download figure:
Standard image High-resolution imageTable 2. Accuracy assessment of forest degradation maps (commission and omission error and kappa coefficient).
| Commission error (%) | Omission error (%) | Kappa coefficient | |
|---|---|---|---|
| Case 1 | 2.0 | 6.3 | 0.92 |
| Case 2 | 2.0 | 2.4 | 0.96 |
The estimated total charcoal production area in the study area from 2008 to 2018 covered 79 630 ha. Total AGB extractions associated charcoal production during this period were estimated in 2.27 Mt and the corresponding gross carbon emissions in 1.13 Mt (table 3). These estimates imply that only 5850 ha of mopane woodlands remain intact in 2018. Thus, 68% of the available mopane area in 2008 has been disturbed over a 10-year period and just 5% of this area still remains undisturbed. The remaining 27% of mopane woodlands corresponds to protected areas and small and scattered mopane patches left behind during the advance of the forest degradation frontier.
Table 3. Annual aboveground biomass (Mg) and gross carbon emissions (Mg) in the study area.
| Year | AGB (Mg) | Gross carbon emissions (Mg) |
|---|---|---|
| 2008 | 81 956 | 40 978 |
| 2009 | 56 989 | 28 495 |
| 2010 | 64 330 | 32 165 |
| 2011 | 148 407 | 74 203 |
| 2013 | 287 195 | 143 597 |
| 2014 | 317 987 | 158 994 |
| 2015 | 343 923 | 171 961 |
| 2016 | 572 281 | 286 140 |
| 2017 | 267 601 | 133 800 |
| 2018 | 127 741 | 63 871 |
Annual charcoal production areas have steadily grown over time with a clear increase in production after 2013 and a sharp peak in the year 2017, when it reached close to 18 000 ha. Partial figures for 2018 season anticipate values in the same order of magnitude to those of the precedent years (11 673 ha) (figure 8). If this growth is sustained over the next few years, all mopane woodlands in the study area will have been under charcoal production by the year 2023.

Figure 8. Evolution of forest degradation extent and forest loss extent (Hansen et al 2013) in Mabalane district and forest loss extent in southern Mozambique (Maputo and Gaza provinces). While the area of Mabalane (9107 km2) is approximately 10 times smaller than southern Mozambique (98 402 km2), figures are in the same order of magnitude.
Download figure:
Standard image High-resolution imageThe pattern of forest degradation in Mabalane districts follows the distribution of the mopane woodlands, progressively moving in South–North and West–East directions outwards from the district main villages and following the main roads. In 2008, charcoal production areas were found within a 15 km radius of Mabalane town. In 2010 the largest proportion of the production took place at 29 km and in 2014 at 66 km. In 2018, the forest degradation frontier was at 81 km of Mabalane town (figure 9). On the ground, this progression takes place in several hotspots scattered throughout the landscape, corresponding to the several charcoal operators. Production of consecutive years often takes place in neighboring areas and moves elsewhere when large undisturbed mopane stands become scarce (figure 10). This pattern results in a fragmented landscape of disturbed and undisturbed woodlands. Over time, as charcoal production continues in the same area, forest degradation extent increases but landscape fragmentation decreases as most of the mopane stands are already disturbed.
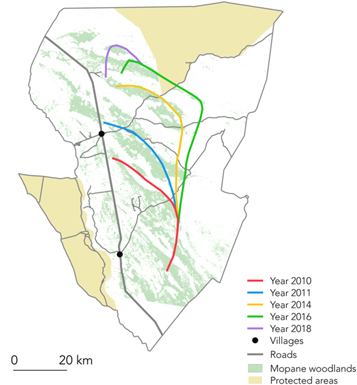
Figure 9. Evolution of the forest degradation front over time in the district of Mabalane.
Download figure:
Standard image High-resolution image
Figure 10. Detail of the evolution of forest degradation from charcoal production from 2013 to 2018 in three subsets of mopane woodlands in the Mabalane district.
Download figure:
Standard image High-resolution image
Forest loss and forest degradation are largely independent processes in the study area, with only 3.3% of charcoal production sites mapped as deforestation. A comparison of the figures from these two processes provides a perspective of the relevance of the forest degradation associated with charcoal production process. Forest degradation extent in the Mabalane district is significantly higher than forest loss. While forest loss summed 3245 ha during the study period, the area of degraded forest due to charcoal production covered 79 630 ha, representing 96% of total forest cover change area. More revealing, forest degradation is the Mabalane district is higher than forest loss in the two southernmost Mozambique provinces combined (75 924 ha).
Discussion
This study presents a proof of concept of the feasibility of using multitemporal medium resolution Earth observation data to monitor forest degradation related to charcoal production with high accuracy. The partial removal of AGB associated with charcoal production has traditionally had a limited and short-lived impact in the spectral signal of medium resolution sensors. While the structure and composition of the woodlands are severely transformed, the remaining vegetation and abundant tree regeneration often result in a rapid recovery of the vegetation cover. Yet, as demand for charcoal in African cities rises, charcoal production patterns intensify, extracting more AGB per unit area and covering larger extents. As a consequence, a process that was hardly visible with medium resolution imagery before, is now increasingly detectable provided cloud free observations images at the right temporal windows exist. As more imagery from comparable medium resolution sensors (e.g. Landsat 8, Sentinel 2, DMC) becomes accessible, data availability will not represent a major restriction to implement similar approaches across SSA in the near future. The characterization of charcoal production forest degradation over time provides a better understanding on its contribution to overall forest cover change. Our work underlines the potential of multitemporal medium resolution Earth.
Observation data to provide operational information and support the development of more precise REDD+ measurement, reporting and verification systems in the Miombo region and SSA. The integration of medium resolution-based information with higher spatial resolution remote sensing data and field information opens the door to improve the currently poorly characterized contribution of forest degradation to forest emissions in SSA. While active remote sensing technologies such as L-band SAR has showed potential for detecting forest degradation (Ryan et al 2012), these data are not currently publicly available, and thus not currently suitable for wide area monitoring. This will undoubtedly change with the upcoming availability of active remote sensing datasets such as from NASA's GEDI Lidar, NASA/ISRO's L-band NISAR mission, and ESA's P-Band BIOMASS mission. The synergies between optical and upcoming active remote sensing datasets will improve our capabilities to monitor forest degradation.
Our work reveals the spatial and temporal dynamics of forest degradation associated with charcoal production in a major supply region of an African capital. The case of Maputo urban area is a representative example of energy demands in large urban centers across the Miombo region and many other large cities of SSA. As the main charcoal supplier to a large urban area, the Mabalane district serves to contextualize the current impact of urban energy demand on forest resources. Given urban population growth projections, it also helps to forecast the potential impact of this demand on forest resources in the future.
The 10-year study period provides an assessment of the magnitude and pace of this forest change process, in which forest degradation is expected to disturb all mopane woodlands in the study area within a 20-year cycle. Our results also offer a perspective of the relevance of forest degradation associated with charcoal production in the carbon balance of SSA forests. In this case study, the impact of forest degradation in the Mabalane district is comparable to forest loss in the entire southern Mozambique, making charcoal production the main contributor to forest cover change. Sedano et al (2016) reported that charcoal production could extract up to 80% of AGB in tropical dry woodlands of central Mozambique. If similar numbers are considered in this context, gross carbon emissions from forest degradation would, despite just partially removing AGB, be comparable to those of deforestation in southern Mozambique. Furthermore, ecosystem model simulations have showed that, in similar environmental conditions, woodlands could require more than 80 years to recover from standard charcoal production AGB removals (Silva et al 2019). Thus, while charcoal production may be relatively localized in space, its implications in terms of forest cover change area and carbon emissions in the SSA context are relevant at larger geographical scales. The current focus on deforestation has resulted in a number of related policy interventions at national and international levels in SSA. In contrast, forest degradation from charcoal production has been mostly overlooked. Yet, its growing relevance calls for specific actions to address this forest cover change driver.
Our analysis indicates that charcoal production constitutes and independent driver of forest degradation, not associated with other processes of forest cover change. While this finding is supported by previous studies in the region (Sedano et al 2016), this production pattern may not be uniform across SSA. Additional research is still required in other woodlands of the region with higher precipitation and more fertile soils where charcoal production could be a secondary product of agricultural expansion. It is also worth mentioning that our forest degradation estimates are likely to provide a conservative account of the magnitude of the process. Commercial and household-level charcoal production coexist in the study area. In some locations, household charcoal production could account for up to 10% of the production (Luz et al 2015, Baumert et al 2016). Household-level production is a slower process that extracts comparatively less AGB per ha and thus, it is harder to detect with medium resolution imagery. Forest degradation estimates reported in this study are expected to miss the household component.
Malimbwi et al (2010) and Silva et al (2019) identified several consecutive waves of charcoal production in mopane woodlands of central Mozambique, each wave being less selective in terms of tree species and size. Ahrends et al (2010), reported a similar spatial pattern of forest degradation drivers in eastern Africa. In Mabalane, the forest degradation frontier has advanced around 10 km per year during the study period. Following this trend, all mopane woodlands in the Mabalane district will have been disturbed by charcoal production by year 2023. Whereas commercial charcoal production is likely to shift for undisturbed woodlands elsewhere and increase pressure on protected areas, household-level production is expected to continue in the area. Household-level production often operates in already degraded woodlands, harvesting smaller trees and substituting mopane trees with other secondary species such as Combretum spp. (Woollen et al 2016). The subsequent waves of charcoal production have a cumulative impact on the structure and composition of the woodlands (Wurster 2010, Kalaba 2014, Sedano et al 2016), intensifying forest degradation and further compromising ecosystem services provision for local communities (Silva et al 2019).
Despite its relative lack of attention in the research literature, charcoal production could have further impact on ecosystem services (Woollen et al 2016). For instance, changes in forest structure may alter the vertical distribution of fuel and modify the current fire regime dominated by ground fires towards more intense crown fires. Structural changes could potentially have an impact on the long-term stability of the woodlands. The intense sprouting regeneration of the main charcoal tree species in the region introduces a major change from the original stands. Evidence from coppice forest of various species in the Mediterranean Basin have showed growth and health decline following increased in drought stress. Thus, forests dominated by sprouting regeneration as a consequence of charcoal production could potentially be more vulnerable to droughts and climatic variability associated with climate change in the region.
While we do not intend to revisit old fuel crisis narratives, this work presents some evidence that the intensity of the current urban demand could be triggering a shift of charcoal production patterns. In this new context, household-level charcoal production becomes increasingly less dominant in favor of more intense commercial charcoal production (Luz et al 2015). These emerging production patterns result in more intense and faster spreading forest degradation, whose environmental consequences can no longer be considered local. The development and evolution of new charcoal narratives should take advantage and incorporate growing evidence from Earth observation data.
This study focuses on the impact of charcoal production on forest degradation and its direct effect on ecosystem services provision for local communities. Yet, on a more general perspective, any policy intervention towards reducing carbon emissions should also consider the potential consequences on carbon emissions of using other energy sources instead of charcoal.
Conclusion
We used historical Landsat imagery to monitor forest degradation from charcoal production in the main supplying region of a southern African capital during a ten-year period (2008–2018). We implemented a change analysis approach using NDVI images from consecutive years that exploits temporal NDVI dynamics associated with charcoal production. This approach is supported by the increasing availability of medium resolution EO data that provides the imagery required to capture a subtle and transient forest degradation process. The approach also operates in a background of growing urban energy demand that results in more intense charcoal production patterns. As a consequence of these elements, a process that could be hardly detected before (GOFC-GOLD 2016), could now be increasingly monitored with medium resolution EO data.
The study provides, to our knowledge, the first representation of forest degradation specifically from charcoal production in SSA over time. The results improve our understanding of spatial and temporal dynamics of forest degradation associated with charcoal production and expose the magnitude and pace of this process linked to urban energy demand. While often operating in localized charcoal production sites, its impact in terms of forest degradation extent and carbon emissions is relevant at larger geographical scales. Thus, forest degradation from charcoal production could potentially become the main driver of forest cover change in some parts of the Miombo region and SSA. Our study underlines the relevance of including explicit estimates of forest degradation from charcoal production in sub-Saharan African REDD+monitoring, reporting and verification efforts and as a first step to design effective management and policy interventions.
Acknowledgments
This study is part of the 'Forest degradation driven by charcoal production: characterization, quantification and forecasting to improve carbon monitoring systems in southern Africa' project and it is supported by from NASA Carbon Monitoring System (16-CMS16–0041). DigitalGlobe imagery were used under the National Geospatial-Intelligence Agency's (NGA) NextView License Agreement. (© 2014 DigitalGlobe, Inc. Licensed under NextView).
Data availability statement
The data that support the findings of this study are available from the corresponding author upon reasonable request. The data are not publicly available for legal and/or ethical reasons.