

Abstract
Despite modest emissions reductions of air pollutants in recent years, China still suffers from poor air quality, and the outlook for future air quality in China is uncertain. We explore the impact of two disparate 2050 emissions scenarios relative to 2015 in the context of a changing climate with the Geophysical Fluid Dynamics Laboratory Atmospheric Model version 3 (GFDL-AM3) chemistry-climate model. We impose the same near-term climate change for both emission scenarios by setting global sea surface temperature (SST) and sea ice cover (SIC) to the average over 2010–2019 and 2046–2055, respectively, from a three-member ensemble of GFDL coupled climate model simulations under the RCP8.5 (Representative Concentration Pathway) scenario. By the 2050s, annual mean surface ozone increases throughout China by up to 8 ppbv from climate change alone (estimated by holding air pollutants at 2015 levels while setting SIC and SST to 2050 conditions in the model) and by 8–12 ppbv in a scenario in which emissions of ozone precursors nitrogen oxides (NOx) and anthropogenic volatile organic compounds (VOCs) increase by ∼10%. In a scenario in which NOx and anthropogenic VOC emissions decline by 60%, annual mean surface ozone over China decreases by 16–20 ppbv in the 2050s relative to the 2010s. The ozone increase from climate change alone results in an additional 62 000 premature deaths in China as compared to 330 000 fewer premature deaths by the 2050s under a strong emissions mitigation scenario. In springtime over Southwestern China in the 2050s, the model projects 9–12 ppbv enhancements to surface ozone from the stratosphere (diagnosed with a model tracer) and from international anthropogenic emissions (diagnosed by differencing AM3 simulations with the same emissions within China but higher versus lower emissions in the rest of the world). Our findings highlight the effectiveness of emissions controls in reducing the health burden in China due to air pollution, and also the potential for climate change and rising global emissions to offset, at least partially, some of the ozone decreases attained with regional emission reductions in China.
Export citation and abstract BibTeX RIS

Original content from this work may be used under the terms of the Creative Commons Attribution 3.0 licence. Any further distribution of this work must maintain attribution to the author(s) and the title of the work, journal citation and DOI.
1. Introduction
Exposure to surface ozone causes hundreds of thousands of premature deaths worldwide each year (Cohen et al 2017), and is associated with morbidity, damage to ecosystems and crops, and in the upper troposphere is an important greenhouse gas (Myhre et al 2013, Jhun et al 2014, Tai et al 2014, Yue and Unger 2014). In China, 67 000 premature deaths were attributed to ozone in 2015, among the largest premature mortality from ozone air pollution in the world (Cohen et al 2017). Some tropospheric ozone originates in the stratosphere, which occasionally may enhance concentrations at the surface and impact air quality in some regions and seasons (Langford et al 2009, Lin et al 2012). In addition to emissions, climate change influences ozone air quality through changes in temperature, atmospheric circulation, precipitation, and dry deposition (Jacob and Winner 2009, Fiore et al 2015). Though there is now evidence that emissions of ozone precursors have declined slightly in recent years in certain parts of China (Liu et al 2017), the future of ozone air quality in China remains uncertain and depends strongly on future emissions policies and climate change. Recent evidence points to an increase in ozone concentrations associated with particulate matter decreases in recent years in China due to the weakening of the aerosol sink of peroxy radicals (Li et al 2018), implying a growing need for considering future ozone air quality over China.
Over China specifically, Chen et al (2018) projected a 1–10 ppbv increase in annual mean ozone by 2055 (compared to 2015) using the RCP8.5 scenario in the GFDL-CM3 climate model and a statistical downscaling technique based on observed ozone distributions. Zhu and Liao (2016) used a nested version of the global chemical transport model GEOS-Chem with the RCP emissions scenarios and found increases in annual mean surface ozone of 6–12 ppbv by 2050 (relative to 2000) in the RCP6.0 and RCP8.5 scenario, and decreases of up to 6 ppbv in RCP2.6 and RCP4.5. Wang et al (2013) also used GEOS-Chem but with the SRES A1B scenario, finding summertime increase in mean surface ozone of 0.4 ppbv due to climate change alone, and an increase of 11.6 ppbv due to emissions changes alone over the period 2000–2050. Liu et al (2013) found autumn season increases in surface ozone of up to 6.1 ppbv from emissions alone and 1.5 ppbv from climate change in the Pearl River Delta region of China, using the Weather Research and Forecasting with Chemistry model (WRF-Chem) and the SRES A1B future emissions scenario. Fiore et al (2012) synthesized several multimodel studies using a variety of future emissions projections on emissions and climate-driven changes to future ozone, and found a wide range (±4 ppbv) for climate-driven ozone and emissions-driven ozone (−4 to +10 ppbv) over East Asia, though their domain included Korea and Japan. Models are in qualitative agreement on future climate-driven ozone over China, but the sign and magnitude of change vary strongly with the selected emissions scenario.
Here, we use a more recent emissions inventory, ECLIPSE v5a (Evaluating the Climate and Air Quality Impacts of Short-Lived Pollutants) CLE (Current Legislation) and Maximum technically Feasible Reduction (MFR) scenarios for estimates of future emissions globally and over China (Stohl et al 2015). These future emissions projections include substantial improvements over previous emissions scenarios, especially over China, where large changes have recently occurred. ECLIPSE takes into account new emissions control policies announced under China's 12th five-year plan that were not previously considered in other inventories. It also considers a number of newer emissions standards released after 2010 and includes integrated policies that include both energy-saving measures and end-of-pipe controls (Wang et al 2014). ECLIPSE also represents a wider range of possible emissions futures for China and the rest of the world, which is an improvement over the SRES and RCP scenarios. Kirtman et al (2013) compared air pollutant emissions projections under SRES and RCPs, finding that the RCP emissions were smaller than SRES by a factor of 1.2–3.
We focus on the impact of climate change and emissions scenarios on surface ozone over China (section 3), using GFDL-AM3, described and evaluated in section 2 and supplementary information (available online at stacks.iop.org/ERL/14/074030/mmedia). We examine the impact of stratospheric-tropospheric transport and the sensitivity of surface ozone to temperature on future ozone levels in China (section 3). Finally, using methodology from a recent long term study of ozone mortality (Turner et al 2016), we calculate the human health burden in China associated with future ozone exposure projections (section 4).
2. Methods
We use the atmospheric component of the NOAA GFDL AM3 (Donner et al 2011) to perform simulations of present and future climate under different emissions scenarios provided by the ECLIPSE v5a inventory. ECLIPSE provides present-day (2015) emissions of SO2, NOx, NH3, NMVOC, BC, OC, PM2.5, PM10, and CO, and future emissions in the current legislation (CLE) and MFR (Stohl et al 2015). CLE and MFR are described in further detail in the supplement. We simulate a base-case for comparison with future scenarios, with year 2015 emissions (where MFR and CLE emissions are identical) and 2015 climate. All simulations, both present-day base case and future projections for 2050 are 10 years in length and repeat 2015 (or 2050) climate and emissions continuously for those 10 years. Climatic conditions are specified using global sea surface temperatures (SST) and sea ice cover (SIC) according to decadal averages for the years 2010–2019 for present day and 2046–2055 for the future from a three-member ensemble of GFDL-CM3 transient simulations under the RCP8.5 high warming scenario. The decadal averages of the combined three-member ensembles help dampen climate variability arising from the ocean (but atmospheric variability remains).
The CLE and MFR scenarios do not provide concentrations of CO2 and other long-lived greenhouse gases needed to drive climate forcing. As such, we use the long-lived greenhouse gases from the RCP8.5 scenario that are consistent with the SST and SIC in our 2015 and 2050 AM3 simulations. We impose the same SSTs, SICs, and well-mixed greenhouse gases (RCP8.5) in 2050 for both air pollution scenarios (CLE and MFR) to facilitate a more direct comparison between the roles of emission changes under the CLE versus MFR scenario. Coupling a high warming scenario such as RCP8.5 with a strong air pollution emissions mitigation scenario such as MFR is indicative of a future with aggressive end-of-pipe air pollution control technology limiting NOx but doing little to mitigate long-lived greenhouse gases such as CO2. Qualitatively, this RCP8.5-MFR scenario is similar to the SSP5-8.5 scenario for phase 6 of the Coupled Model Intercomparison Project (CMIP6), which combines a strong air pollution control scenario in the Shared Socioeconimc Pathway 5 (SSP5) with a high warming endpoint (8.5 W m−2 radiative forcing by 2100) (O'Neill et al 2016). In all of our simulations, methane concentrations are held at 2015 levels with respect to atmospheric chemistry, but increase according to RCP8.5 for the radiative effect by imposing different methane abundances in the chemistry versus radiative transfer modules. CO2 and other tropospheric nonreactive greenhouse gases are also prescribed to 2050 levels. These simulations include the combined impact of climate and emissions changes.
We also simulate the impact of future climate change alone on surface ozone by holding anthropogenic emissions of aerosols and ozone precursors at 2015 levels but using a 2050 decadal mean climate. We chose to use 2015 emissions as the fixed baseline because emissions are identical between CLE and MFR for the year 2015, but are vastly different in the future. We take the difference between the present-day simulation and the future time-slice simulations to quantify the change in surface ozone. To estimate the impact of Chinese emissions reductions alone on ozone air quality beyond China (e.g. Western US), we simulate 2050 with MFR emissions over China (CHMFR in table 1) but CLE emissions elsewhere and subtract this simulation from the simulation with CLE emissions applied globally. The difference between the CHMFR simulation and the global MFR emissions provides an estimate of how growth in global emissions outside of China could influence future air quality over China.
Table 1. Simulation name, emissions scenarios (CLE/MFR and year of emissions), climate change scenario (year of SST and SIC input from RCP8.5 three-member ensemble simulations of GFDL-CM3), and emissions of NOx, NMVOC, and CO over China and globally. Units for NOx: Tg NO2 yr−1; units for NMVOC: Tg NMVOC yr−1; units for CO: Tg CO yr−1.
| China emissions | Global emissions | |||||||
|---|---|---|---|---|---|---|---|---|
| Name | Emission scenario | NOx | NMVOC | CO | NOx | NMVOC | CO | Climate change scenario |
| 2015 | CLE 2015 | 20.6 | 24.2 | 163 | 91.5 | 108 | 520 | 2015 |
| 2050 CLE | CLE 2050 | 25.1 | 25.5 | 120 | 112 | 121 | 501 | 2050 |
| 2050 MFR | MFR 2050 | 8.52 | 9.04 | 45.2 | 31.4 | 50.3 | 165 | 2050 |
| 2050 CLIM | CLE 2015 | 20.6 | 24.2 | 163 | 91.5 | 108 | 520 | 2050 |
| 2050 CHMFR | MFR over China only, CLE elsewhere | 8.52 | 9.04 | 45.2 | 91.5 | 108 | 520 | 2050 |
To quantify stratospheric ozone influence in surface air, all of our simulations use the 'O3S_e90' tracer approach to quantify stratospheric contributions to surface ozone as defined in Lin et al (2012). Briefly, this stratospheric ozone tagging method utilizes a tropopause tracer with a globally uniform surface source and a 90 d e-folding lifetime (Prather et al 2011) to define the tropopause. Stratospheric air is defined as where the e90 mixing ratio is less than 85 ppbv, and ozone in the stratosphere is tagged as 'O3S_e90'. We estimate changes in the stratospheric ozone contribution to surface air as the difference in this tracer between simulations.
The GFDL-AM3 present-day (2015) simulation is evaluated against hourly observations from 1494 monitoring stations across 364 cities in China from the period of 1 January 2015–31 December 2015 in section 4 of the supplementary information. Figure S3 shows monthly mean maximum daily 8 h average values (MDA8) across a geographically diverse set of urban locations throughout China. Although the model is biased high due to uncertainties in emissions of anthropogenic and biogenic precursors, uncertainties in ozone sinks such as dry deposition, and inability of the coarse resolution model (∼200 km by 200 km) to resolve ozone titration and other chemical processes occurring at local scales, we focus our analysis on differences between model simulations of the future and present. To the extent that biases impact ozone concentrations in an equivalent manner in the present and future, our estimates of changes should be minimally affected by this mean state bias. Earlier work suggests that despite similarly high biases in the eastern US in summer, the modeled response to NOx emissions reductions phased in from the late 1990s–2000s is captured (Clifton et al 2014, Rieder et al 2015). Therefore, to our best understanding we expect that the bias stems from simulating the mean ozone abundances rather than the sensitivity of ozone to changes in emissions or meteorology. Rieder et al (2015) and Chen et al (2018) used a quantile mapping bias correction method on GFDL-AM3 ozone, using the same correction for both present and future, assuming bias is systematic and stationary. However, since we focus on changes in ozone concentration and mortality between 2015 and 2050, applying their method would simply result in cancellation of the bias correction.
3. Projected changes in surface ozone concentrations over China in the 21st century
3.1. From emissions within and outside China
Figure 1 shows the spatial distribution of NMVOC, NOx, and CO emissions in 2015 and the difference between 2015 and 2050 for the MFR and CLE scenarios over China. In the CLE scenario, NOx emissions are projected to stay similar to 2015 levels by 2050, with modest increases (up to about 5 Gg NO2 yr−1 in local hotspots) in eastern China. Anthropogenic NMVOC emissions are projected to increase by upwards of 10 Gg NMVOC yr−1 only on the Shandong Peninsula, surrounded by decreases of similar magnitude elsewhere in eastern China. CO emissions are projected to decrease uniformly throughout China by 2050. In the MFR scenario, emissions of all three species are projected to decrease throughout China. Table 1 and figure S1 shows the total emissions for CLE and MFR totaled over eastern China (100 °E–130°E, 20 °N–50 °N), and figure S2 shows the global total emissions. In MFR, global emissions of NOx, NMVOCs, and CO are more than halved by 2050. MFR can therefore be considered an optimistic scenario in contrast with a more status-quo scenario in CLE.
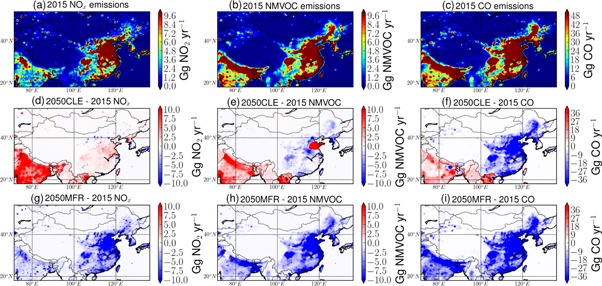
Figure 1. Emissions of NOx (left column), NMVOC (middle column), and CO (right column) for 2015 (panel (a)–(c)), a 2050–2015 difference in the CLE scenario (panels (d)–(f)), and a 2050–2015 difference in the MFR scenario (panels (g)–(i)). Units are Gg (species) per year.
Download figure:
Standard image High-resolution imageDuring spring and summer, when ozone concentrations are generally highest across China (figures S3 and S4), decadal average seasonal mean Chinese MDA8 surface ozone increases by up to 10 ppbv, respectively, from the 2015 to 2050 CLE simulations (figure 2(a), see figure S5 for all seasons), reflecting increases in precursor NOx and VOC emissions. Increases in ozone in eastern China, especially near the Shandong peninsula, are significant at the 95% confidence level according to a Student's t-test. Changes in southern and western China are also significant, particularly in spring over the majority of western China. The ozone increase over the Tibetan Plateau region in southwestern China partially reflects the influence from the nearby Indo-Gangetic Plain, where emissions of ozone precursors are projected to increase by 50%. In contrast with CLE, statistically significant ozone decreases occur uniformly in the MFR scenario in every season (figures 2(b), S7), echoing the changes in emissions of ozone precursors in the ECLIPSE inventory (figure 1 and table 1). Ozone decreases are highest in summer (JJA, figure S6), when they reach upward of 20 ppbv over almost the entire domain, and lowest in winter (DJF, figure S6). Ozone decreases are largest in the central and southern parts of eastern China, mostly at or below the latitude of the Yellow Sea. The standard deviation of annual mean MDA8 ozone in present-day simulations is 1.7 ppbv averaged over China and less than 2 ppbv for any given season (figure S7), suggesting that the changes in future ozone in CLE and MFR and subsequent changes described below are significant compared to internal variability.
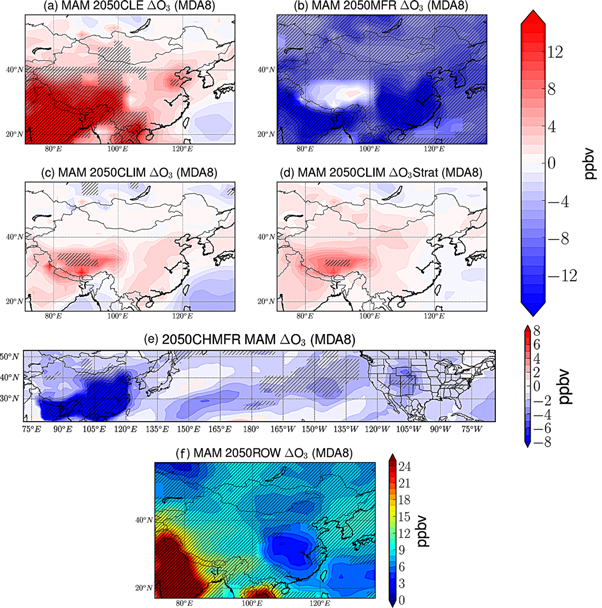
Figure 2. Change from 2015 to 2050 in springtime (MAM) decadal average maximum daily 8 h average ozone (MDA8) in the GFDL AM3 simulations during (a) CLE secnario, (b) MFR, (c) CLIM, (d) CLIM for the stratospheric O3 component of surface O3, (e) CHMFR, and (f) ROW (rest of world). Hatching represents statistical significance at 95% confidence level (assessed by Student's t-test).
Download figure:
Standard image High-resolution imageFigure 2(e) shows the change in MDA8 surface ozone due to a major reduction in ozone precursor emissions over China only by 2050 with the rest of the world following CLE (referred to hereafter as 2050CHMFR). The 2050CHMFR hybrid scenario is differenced against 2050CLE (higher emissions CLE scenario everywhere, including China), thus isolating the impact of Chinese emissions reductions alone. In the springtime, when observations and models indicate intercontinental transport of air pollution over the Pacific peaks (Task Force on Hemispheric of Air Pollution 2010), significant (hatching) surface ozone decreases of up to 6–8 ppbv occur in the western US. These changes are largest over higher elevations in the US (Rocky Mountains), which are more susceptible to changes in free tropospheric ozone transport. While climate variability will modulate the impact of Chinese emissions reductions on US surface ozone via intercontinental transport (which can be amplified or dampened by variability in stratosphere-troposphere transport as shown in Lin et al 2015), our results imply that aggressive emission reductions over China would reduce ozone concentrations over the western US.
We further examine the implications for air quality over China in 2050 if China aggressively reduces ozone precursor emissions according to MFR but the rest of the world follows CLE instead of MFR. Here, the hybrid scenario described above is differenced against 2050MFR (instead of 2050CLE), thereby isolating the influence of the emissions difference between CLE and MFR in the rest of the world on China (called 2050ROW). Under this scenario, we find statistically significant higher surface MDA8 ozone in springtime (figure 2(f), all seasons figure S8) across most of China, largest (up to 15 ppbv) in western China in close proximity to India. Emissions of NOx in India increase by 25% in CLE and 50% specifically in northwest India, which strongly impacts western China ozone concentrations in all seasons. In eastern China, increases are smaller (less than 6 ppbv) due to a larger influence of local emissions. However, the influence of foreign emissions still impacts several areas in eastern China by 15 ppbv or more in the summer (figure S8). Increases in ozone of up to 9 ppbv occur in south China, which may reflect an influence of pollution from countries in Southeast Asia.
3.2. From climate change
Surface MDA8 ozone changes in the 2050CLIM simulation relative to the 2015 simulation (in which precursors of ozone and aerosols are held at 2015 levels) are shown in figure 2(c) (see figure S9 for all other seasons). Consistent with previous work, ozone increases due to future climate change in polluted regions (e.g. high emissions in figure 1). The increases are largest in the summer and fall months in Western China (up to 8 ppbv, figure S9), but occur year round, with an annual mean increase of about 4 ppbv over populous eastern China. Statistical significance is most widespread in western China especially over the Tibetan Plateau and in close proximity to India. The increases in surface ozone near major cities on the east coast of China, near the Yangtze River region, and sporadically in other areas are only significant in autumn. While climate-driven changes in surface ozone are generally smaller in magnitude than the emission-driven changes, as expected, these 4 ppbv seasonal increases in the heavily populated eastern portion of China could become more important in meeting ozone targets in the future as China aims to reduce its air pollution health burden. These climate-driven O3 changes would likely be smaller if a future emissions scenario such as MFR in 2050 was used as the fixed baseline, since the sensitivity of O3 to temperature decreases with decreasing regional NOx emissions (Rasmussen et al 2012).
We find that the springtime increases in southwestern China reflect increasing stratospheric ozone. Figure 2(d) shows the change in the stratospheric ozone component of springtime surface MDA8 ozone (O3S; see figure S10 for all seasons) in 2050CLIM from 2015 to 2050. The change in O3S over the Tibetan Plateau or anywhere else in China is statistically significant at the 95% confidence level only in spring (hatching in figure 2(d)). This O3S increase also occurs in 2050CLE and 2050MFR (figures S11 and S12), which are driven by the same 2050 SSTs and sea ice as 2050CLIM, suggesting that this enhanced stratospheric transport is a robust feature of future climate change in this model. In the spring, climate-driven stratospheric ozone contributes as much as 12 ppbv to surface ozone over the high elevation Tibetan Plateau, or 15% compared to present-day surface ozone levels in an area that is not as heavily influenced by localized anthropogenic emissions compared to populated urban centers of eastern China. The surface ozone increase in 2050 in the MFR scenario in spring (figure 1(c)) in this region suggests that climate-driven increases in stratospheric influence on surface air are sufficient to offset the ozone reductions produced by the widespread emissions decreases in the MFR scenario (figure 1). Surface ozone increases in 2050 are also enhanced in the CLE scenario (which has the same climate forcing, but also includes air pollutant emission changes) by the stratospheric component.
Figure 3 shows the MDA8 surface ozone versus maximum daily temperature (Tmax) slope (ppbv K−1) in summer time over China in 2015 and in 2050 in the climate change only scenario (2050CLIM). Correlations between Tmax and MDA8 ozone are shown in figure S13. In 2015, ozone increases by roughly 3 ppbv K−1 in the summer in the Beijing region. By 2050, climate change results in more than doubling of this slope (about 7 ppbv K−1) in the same region, suggesting that ozone levels will be more sensitive to temperature changes in the future. The slope of the O3–Tmax relationship increases by at least 0.25 ppbv K−1 for the entire northern half of China, and the areas of greater slope are extended further into western China (figure 3(c)). Associated with this slope increase, we find a northward shift of the jet stream latitude, as defined by the maximum of the 500 hPa zonal wind (gray contour lines in figure 3), from 2015 to 2050. In the 2015 simulation, the jet position is approximately at 40 °N latitude (darkest gray/black contours) near the northern China border with Mongolia, but by 2050 shifts northward by about 8 °N latitude. This northward shift is also demonstrated by the differences in 500 hPa zonal wind in figure 3(c) and is associated with the projected increase in O3–Tmax slope in the northern part of China. This is consistent with Barnes and Fiore (2013), who found that over the Northeastern US the O3–Tmax slope is greatest a few degrees south of the latitude with maximum jet wind speed.
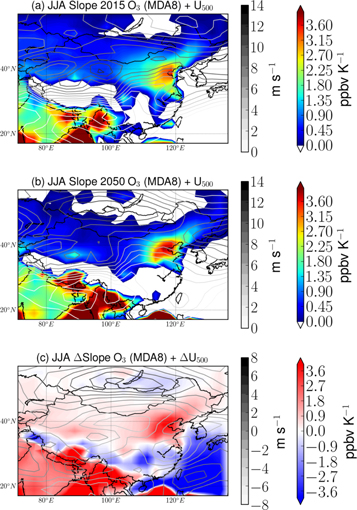
Figure 3. Summer (JJA) sensitivity of ozone to maximum surface temperature in (a) 2015 and (b) 2050CLIM, and (c) difference. Gray contour lines show the JJA 500 hPa height zonal wind for each year and the difference.
Download figure:
Standard image High-resolution image4. Ozone-related mortality over China
Using the difference in our model simulations for 2050 versus 2015 in the CLE, MFR, and CLIM scenario and concentration-response factors from a recent long-term ozone mortality study (Turner et al 2016), we calculate the change in annual premature mortality due to future ozone in China. Mortality calculations are completed using the equation below:

where M is the change in mortality, M0 is the county-level baseline mortality rate for China, P is the population from the 2010 Chinese census, CRF is the concentration response factor obtained from Turner et al (2016), and ΔO3 is the change in the running three-month mean of daily 1 h maximum values of surface ozone concentration between 2015 and 2050 in each scenario. Turner et al (2016) is chosen as a more recent estimate based on an updated cohort with a longer follow-up than previous estimates. The concentration response factor is the 'hazard ratio' as defined in Turner et al (2016) and is the slope of the log-linear relationship between concentration and mortality. A caveat to this calculation is that the CRF was developed from US populations. The relatively coarse model resolution may not be able to fully resolve health burden impacts at local scale. We also do not include population aging in our mortality estimates, which was recently shown to play a significant role in future mortality in China (Chen et al 2018). County-level baseline-mortality rates were obtained from the Chinese Center for Disease Control and Prevention.
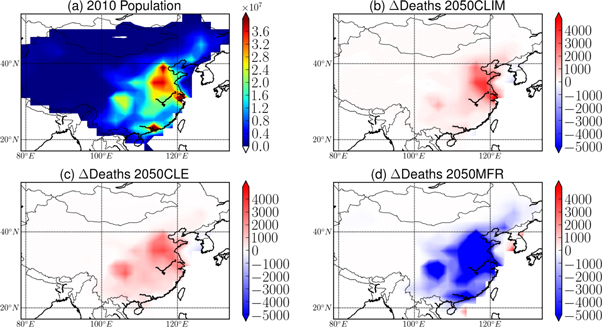
In figure 4 we present the change in annual all-cause mortality between 2015 and 2050 due to climate change (CLIM), CLE emissions, and MFR emissions. These mortality changes are computed from the decadal average change in ozone between 2015 and 2050, and thus ignore possible transient variations in mortality that may occur in the years between. Baseline 2010 population is shown in figure 4(a). The ozone change due to climate change alone results in an additional 61 884 annual premature deaths (standard deviation of 674) in China by 2050. Not all ozone changes in the climate change scenario are statistically significant at the 95% confidence level. In the CLE scenario, which projects emissions in China to roughly stay the same or slightly increase (see figure 1 and table 1), an additional 79 786 premature deaths (standard deviation of 698) are expected. Since climate change is also a factor in the CLE scenario, this suggests that the ozone climate penalty, or the amount of ozone concentration increase due to climate change alone, makes up a significant portion of the human health burden associated with the CLE simulation, though due to climate variability, simulation results are not exactly linear. In the MFR scenario, we project that 334 822 premature deaths (standard deviation of 2880) can be avoided. Ozone changes associated with CLE and MFR are statistically significant throughout most of the entire domain. 'Though only a fraction of 1% of China's total population, this number of avoided premature deaths is a significant fraction (one-quarter to one-third) of the estimated total number of annual premature deaths attributed to ozone in present-day worldwide (1.04–1.23 million) in Malley et al (2017). That work utilized the same CRF from Turner et al (2016), which estimates a CRF of 1.02 per 10 ppbv O3 increase, much larger than the CRF of 1.001 per 10 ppbv developed in Jerret et al (2009).' The largest numbers of increasing or decreasing premature deaths occur in eastern China, where both population and ozone concentrations are highest. However, in the MFR scenario, reductions in mortality extend as far west as the Sichuan province and as far south as the south China coast. Aggressive emissions reductions will therefore have far-reaching benefits to human health, but even if ozone precursor emissions are controlled there may be a modest impact of climate change that dampens the emissions reductions benefits.
Figure 4. (a) 2010 baseline population in China, (b) change in premature deaths between 2015 and 2050 due to climate change alone (2050CLIM scenario) (c) change in premature deaths between 2015 and 2050 due to CLE scenario (2050CLE, includes climate change), and (d) change in premature deaths between 2015 and 2050 due to MFR scenario (2050MFR, includes climate change). Units are number of deaths.
Download figure:
Standard image High-resolution image
5. Discussion and conclusions
With our decades-long chemistry-climate model simulations, we investigated a range of possible futures over China under different regional and global emission scenarios. Our findings highlight the strong leverage possible over much of China by continuing to implement domestic controls on ozone precursor emissions to improve air quality in contrast to the further degradation of air quality under a scenario in which emissions continue to increase to mid-century. Premature mortality is estimated to increase in China by 2050 compared to 2015 in the CLE scenario by nearly 80 000 deaths, while emissions decreases in the MFR scenario would result in more than 330 000 avoided premature deaths. Our results show that emission controls on ozone precursor emissions as projected under the MFR scenario would largely improve air quality and health in China.
We examine non-local factors influencing future air quality over China. A sensitivity simulation in which temperatures are consistent with the high-warming RCP8.5 scenario but air pollutants and precursors remain at 2015 levels demonstrates the potential for climate change to further increase ozone and associated mortality, including via an enhanced sensitivity of ozone to temperature and a springtime enhancement of stratospheric ozone in the lower troposphere over the remote high-altitude southwestern China region in springtime. The impact of future climate change on the ability to meet air quality standards should not be overlooked, especially in southwestern China where stratospheric influence on surface air due to climate change is an important contributor to surface level ozone. Climate change may dampen future mortality benefits, as climate change alone contributes up to 62 000 premature deaths over China by 2050 compared to 2015. In addition to avoiding the worst effects of climate change in China, future mitigation of greenhouse gas emissions will have an added co-benefit of reducing air pollution-related mortality. We find that a continued rise in global emissions including over South Asia can offset some of the gains attained via controlling emissions within China alone. Our results also suggest that reductions in emissions in northern India will lead to lower ozone levels over western China. China may therefore benefit by encouraging widespread emissions reductions throughout all of Asia. Higher resolution modeling that better resolves air pollution transport at the India–China border will be important for improved estimates of the international contribution. The use of multiple models to better assess robustness of results of a single model should also be a priority for future work. Our results imply that, as China moves to reduce its air pollution health burden, the influence from international pollution transport, especially from neighboring India, may become increasingly important for improving air quality and meeting national standards.
Acknowledgments
We acknowledge a Columbia Global Policy Grant for funding this research. MAK and MZH acknowledge the National Institutes of Health Institutional Research T32 Training Grant (T32 ES023770), the National Institute of Environmental Health Sciences (NIEHS) Individual Fellowship Grant (F31 ES029372) and Center Core Grant (P30 ES009089). AMF acknowledges support from the Vetlesen Foundation. We thank Vaishali Naik for providing scripts to help process emissions files. This work was not funded or sponsored by NASA. The authors declare no competing interests. (Lamont Publication Number 8322.)
Data availability
Data is available on request to corresponding author.