

Abstract
The context in which trees and forests grow in cities is highly variable and influences the provision of ecological, social, and economic benefits. Understanding the spatial extent, structure, and composition of forests is necessary to guide urban forest policy and management, yet current forest assessment methodologies vary widely in scale, sampling intensity, and focus. Current definitions of the urban forest include all trees growing in the urban environment, and have been translated to the design of urban forest assessments. However, such broad assessments may aggregate types of urban forest that differ significantly in usage and management needs. For example, street trees occur in highly developed environments, and are planted and cared for on an individual basis, whereas forested natural areas often occur in parkland, are managed at the stand level, and are primarily sustained by natural processes such as regeneration. We use multiple datasets for New York City to compare the outcomes from assessments of the entire urban forest, street trees, and forested natural areas. We find that non-stratified assessments of the entire urban forest are biased towards abundant canopy types in cities (e.g. street trees) and underestimate the condition of forested natural areas due to their uneven spatial arrangement. These natural areas account for one quarter of the city's tree canopy, but represent the majority of trees both numerically and in terms of biomass. Non-stratified assessments of urban forest canopy should be modified to accurately represent the true composition of different urban forest types to inform effective policy and management.
Export citation and abstract BibTeX RIS

Original content from this work may be used under the terms of the Creative Commons Attribution 3.0 licence. Any further distribution of this work must maintain attribution to the author(s) and the title of the work, journal citation and DOI.
Corrections were made to this article on 16 March 2020. Acknowledgments were amended.
Introduction
Trees and forests are important components of urban greenspace, providing diverse economic, ecological, and social benefits (Roy et al 2012). As more land is converted to urban uses and as city populations increase, the focus on enhancing and sustaining urban forests to secure the benefits they provide becomes more important (Getter and Rowe 2006, Young 2011, Nilon et al 2017, Hölscher et al 2019). Urban forest assessments are the basis upon which their benefits are quantified, policy is determined, and management is implemented (McPherson 1992, Brack 2002, Cowett and Bassuk 2017). However, methods for urban forest assessment vary markedly in scale and focus (Wilson et al 2004, Corona 2016), yielding contradictory conclusions about the status of forest biodiversity and invasive species (Pregitzer et al 2019). For cities to sustain and enhance urban forests, assessments that accurately characterize the urban forest to inform policy and management are needed.
The number and species of trees are highly variable across urban landscapes (Reid et al 2017). The context in which an urban tree grows is directly related to the benefits that tree provides and the management that the tree, or forest stand, requires. For example, planted street trees grow in highly-designed and maintained environments, are sourced from nursery stock rather than germinate in place from seed (Conway and Vander Vecht 2015), and are arranged in a spatially uniform way along streets, courtyards, and parks. Further, they occur in close proximity to buildings, and so can provide shading or cooling which provides energy offsets at local scales (Akbari 2002). In contrast, trees in urban forested natural areas grow together within a stand, or collection of stands, and are concentrated in less uniform patterns as patches across the landscape within parks or nature reserves. Forested natural areas are primarily sustained though natural regeneration, are influenced by successional dynamics, and on death trees often decompose in place. Forested natural areas can support habitat for native plants and animals that require larger patches (Nielsen et al 2013, Soga et al 2014, Salvati et al 2017), offer human health benefits related to nature-based experiences (Müller et al 2018), and have disproportionately high measures of some ecosystem services compared to other types of urban greenspace (Vieira et al 2018). Separate assessments of street trees and forested natural areas have been developed in local municipalities to inform management (Chacalo et al 1994, Galvin 1999), yet are not commonly put into the context of assessments or policy needs of the entire urban forest (Nowak and Greenfield 2018b).
Current definitions of urban forests (Konijnendijk et al 2006) deviate from those of forests more generally. Definitions of (non-urban) forest vary internationally and are based on land cover, land use, or administrative unit. Criteria used to define forest include minimum canopy cover (10%–40%), size (0.05–1 ha), stocking (area occupied by trees, >10%), and width (>20 m) of typically undeveloped forest land (Lund 2002). In contrast, definitions of urban forest are typically broader, and include all trees within a given area defined as urban (Nowak 1994, Konijnendijk et al 2006). As such, any type of tree found within municipal boundaries is included, meaning that 'urban forest' includes trees growing individually in streets, yards or parkland, as well as trees growing grouped together in stands. Such an inclusive classification makes 'urban forest' synonymous with 'urban tree canopy' (Alonzo et al 2016). Yet the classification contrasts with historical, and many contemporary definitions, of forest land; definitions which only appropriately apply to urban trees in 'forested natural areas' found within cities.
Forests, as they are traditionally defined, are found within and across some of the world's largest and densest cities. For example, some of the larger urban forested natural areas include Seward Park (121 ha) in Seattle (US), Richmond Park (955 ha) in London (UK), Metropolitan Natural Park (232 ha) in Panama City (Panama), and Stanley Park (405 ha) in Vancouver (Canada). In New York City (US) forested natural areas are made up of mostly native tree species (82%) and are similar in structure to forest types found in rural areas of New York State (Pregitzer et al 2019). Although forest patches in cities vary in size, stand age, and species composition, trees in these stands experience the same ecological processes, and are often subject to the same management objectives as non-urban forests. Management of these forest patches should then occur at the stand and not individual-tree scale. In contrast, landscaped and street tree management focuses primarily on individual-tree care, which can include activities that require significant investment on a per-tree basis such as engineering a tree pit, planting, watering, sidewalk repair, pruning, and tree replacement upon mortality (McPherson et al 1999, Mullaney et al 2015). Street trees also occur within highly-designed and challenging growing conditions (Lu et al 2010), which often restricts the choice of species that can be planted (Saebo et al 2003), and which leads to higher and variable mortality rates (Roman and Scatena 2011). Given the differences between these two common types of urban canopy, grouping them under a broad definition of urban forest aggregates trees growing in different environments, that provide different services, and require different management. Yet the broad definition has led to citywide urban canopy assessments (Nowak et al 2008), which are used to provide an aggregate view of urban forest which may therefore be unrepresentative of natural area forests.
We use multiple datasets from New York City to evaluate how three urban forest field assessment methodologies shape conceptions of urban forest composition and structure. We ask how different types of urban forest, specifically forested natural areas and street tree populations, compare to assessments conducted across the entire urban forest (or canopy). We compare common measures of composition including the amount and distribution of tree canopy, proportion of native species, tree density, and aboveground biomass. These analyses provide comparative evidence of how urban forest assessments can inform, or misinform, conceptions and policy for urban forests.
Methods
To quantify the contribution that different types of urban forest (i.e. forested natural areas and individually grown trees) make to the total tree canopy in NYC we used an ecological cover type map that was created using available land cover, LiDAR derivatives, multispectral imagery, and thematic GIS datasets (O'Neil-Dunne et al 2014). We used the ecological cover type map level 2 classifications which defines land use and land cover into 14 unique cover classes to calculate the total amount of land covered by different types of tree canopy, non-tree covered greenspace (e.g. mowed lawn), and the built environment (e.g. roads, buildings). We then calculated the amount of tree canopy cover for all sub classes that were classified as natural area forests and non-natural area forests using the spatial distribution in ecological cover type map. Areas of open water were excluded for this calculation. To provide a more granular spatial assessment, we also looked at these data at the level of the five counties within New York City (Bronx, Queens, Kings, New York, and Richmond counties). For this part of the analysis, data from all field assessments were aggregated by county, in addition to the entire city, to quantify differences in spatial distribution of the types of tree canopy. A table showing the hectares in each canopy-type category summarized by county and the entire city can be found in the supplemental materials (supplemental table 1 is available online at stacks.iop.org/ERL/14/085002/mmedia).
To understand differences in forest composition and structure we compared three existing field-collected datasets that used different sampling methods and were all collected between 2013 and 2015 in New York City. The first dataset is intended to provide an estimate of the entire urban forest using the i-Tree methodology. The data includes tree species and tree diameter-at-breast-height (DBH, 1.37 m) observed in 296 0.04 ha (0.1-acre) field plots, randomly located across five strata, delineated by the five counties in NYC (Nowak et al 2018a). The second dataset is the NYC street tree census, which individually mapped and measured all the trees planted along streets (City of New York, 2016). A total of 652 173 live trees were identified to species and DBH was measured. The third dataset is from a forested natural areas assessment, which was conducted in 2013–2014 for 2947 ha of public land designated as upland 'Forever Wild' natural areas. These areas are primarily forest but include some grasslands and shrublands. Sampling was conducted using 10 m radius plots, where each plot was randomly located within a 2 ha grid as a part of the sampling design. A total of 1124 plots across 53 parks were measured, within which the DBH was measured and species recorded for each individual tree (Forgione et al 2016). For all analyses live trees were used.
We recorded the proportion of native species based on a per-plot basis, except in the case of the street tree census (but see next paragraph), where the entire population was measured and thus no error estimates can be calculated. Native status was determined using local lists provided by the New York State Department of Environmental Conservation and the USDA Plants Database (USDA, NRCS 2019). The most dominant tree species in each assessment were determined on the basis of the relative basal area of that species compared to all trees measured. Biomass estimates for each tree species were determined using US scale estimators for each species (Jenkins et al 2003); where no estimator was available for a species, mean estimators for its genus or closest genus group were used. Total population estimates for the number of trees and biomass were then calculated using the mean estimates for each assessment and applied to the land cover estimate for natural areas, or the entire city. In the case of the street tree census, the area of the entire city (77 168 ha) was used to calculate the number of street trees per hectare.
We augmented the above approach by standardizing the spatial scale of the census-collected data to the plot-collected data of the other two assessments, and compared all three assessments at the same sampling intensity. To do so, we used remotely-sensed geo-referenced street tree locations and desktop analysis to randomly place 10 000 10 m radius plots across the entire city. We then associated the street trees that fell inside each 10 m radius plot with a unique plot number. Out of the 10 000 random plots, 1779 plots contained street trees. We used this subset of plots to test the impact of the different sampling intensities among the three assessments on our inferences. Specifically, we randomly sub-sampled 296 plots from the natural area assessment (n = 1124) and the standardized street tree census (n = 1779) datasets, which is the number of plots used in the i-Tree citywide assessment. Using these subsets, we calculated the mean and standard deviation for all reported metrics. We then repeated the random selection 100 times and reported the mean and standard deviation of each random subset (supplemental figure 1). Because we used the number of samples in the citywide dataset as our basis, only one value is reported in the sampling comparison. All summary statistics reported (mean, standard deviation), and bootstrapped random samples, were calculated using R statistical software version 3.5.1 (R Core Team 2018). We used Levene's test for equality of variance between assessment methods and found the variance was not equal among datasets. We therefore used an ANOVA test with no assumption of equal variances (i.e. Welch one-way test) to test for differences in the means of proportion of native species, biomass per hectare and tree density. Tukey's HSD (honestly significant difference) post-hoc test was used to determine significant differences in tree density, biomass, and proportion of native species across assessment types. For these tests we used the subset of street tree data on the 10 m plot basis, and took the first randomization from the boot-strapping to ensure we compared an equal number of plots (n = 296) for each assessment type (results of ANOVA are reported in supplemental figure 1).
Results
The most dominant land cover type in New York City is impervious surface which covers 59.2% of the land area (figure 1). The remaining 40.8% of land cover is greenspace or pervious surface, with non-forested greenspace (e.g. lawns, tidal wetlands) accounting for 20.1% of land area and tree canopy accounting for 20.7% of land area (figure 1). Out of the 20.7% of New York City that is covered by tree canopy, we found about a quarter (i.e. 5.5%; 4266 ha) comprises forested natural areas and the remainder (i.e. 15.2%; 11 704 ha) is other tree canopy cover, which includes landscaped and street trees. Differences in spatial patterns of natural area tree canopy and non-natural area tree canopy are apparent, with forested natural areas less evenly distributed across the landscape and occurring in discrete patches, whereas street trees and landscaped trees are more uniformly distributed across the entire city (figure 1). By county there are differences in the amount and type of tree canopy. For example, Richmond county contains more than half of the city's natural area tree canopy, whereas Queens county has the greatest canopy cover overall (more than a quarter of the total city's canopy), but the majority is non-natural area tree canopy. New York county (borough of Manhattan) has the least amount of the total tree canopy (1.5% of the city area) with only 0.2% of that being natural area canopy. While the difference in the size of each county contributes to differences in the amount of city area that is considered canopy (e.g. Richmond is much bigger than NY county), the proportion of canopy within each county also varies. For example, 15.3% of the area of Richmond county is forested natural areas, while only 1.3% of Kings county is forested natural areas (see supplemental table 1).

Figure 1. The map (left) shows New York City, NY (USA) and delineations of developed land, non-forested greenspace and two types of tree canopy, natural areas and non-natural types. Each of the five counties (Bronx, New York, Queens, Kings, Richmond) are delineated by a black line. The bar-chart represents the proportion of area that is covered by built land (59.2%), non-forested greenspace (20.1%; e.g. maintained lawn, grasslands) and two types of urban tree canopy (5.5% of forested natural areas and 15.2% of other types of tree canopy). Delineating the types of urban tree canopy is important for informing management activities and greenspace policy in cities. The total hectares in each category for the entire city and by county can be found in the supplemental materials. Photo courtesy of Nicholas Zito (top) and Natural Areas Conservancy (bottom).
Download figure:
Standard image High-resolution imageEstimates of species composition and forest structure varied significantly based on the sampling strategy used by each assessment (supplemental figure 1). For species composition, forested natural areas had the highest proportion of native species at 82.9% (±26.1) (figure 2), and the five most dominant species were all native and accounted for 54% of the total basal area (table 1). The street tree population had a lower proportion of native species compared to forested natural areas, with 43.7% native trees. Further, the five most common tree species comprised both native and non-native species, and together accounted for 66% of the total basal area. Estimates for the entire urban forest (from i-Tree) were more similar to those of street trees than forested natural areas, with the proportion of native species being 42.8% (±40.3%), and the top five most common species comprising both natives and non-natives. These five species accounted for 33% of the basal area. Notably, none of the native species in the top five most common lists for both the citywide urban forest assessment and street tree census were scored in the same top five list for the forested natural areas, where red oak (Quercus rubra) was the most dominant (table 1).
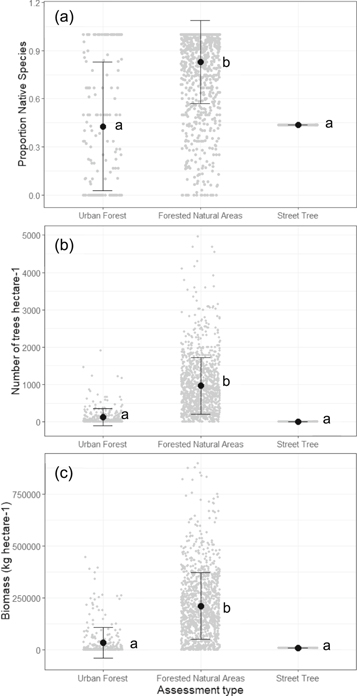
Figure 2. Three different urban forest assessments in New York City influence our understanding of species composition and forest structure. Mean value is represented by the black dot with standard deviation represented by error bars; each point represents values for each forest plot with exception of the street tree census which includes measures on the individual tree basis and no measure of error. If the city boundaries and broad definitions of the urban forest are used (Urban Forest, n = 296 plots) the proportion of native species (a), tree density (b), and aboveground biomass (c) are lower than stratified assessments of forested natural areas (i.e. Forested Natural Areas, n = 1124 plots). Using a standardized data subset, we found that tree density, biomass and proportion of native species are not significantly different between the street tree and citywide assessments; but these metrics from the forested natural area assessment are significantly distinct from the other assessments (see supplemental figure 1). Different letters resemble significant differences in the means between assessment type determined by Tukey's HSD post-hoc test using a standardized dataset and number of plots for each assessment (see supplemental materials).
Download figure:
Standard image High-resolution image
Table 1. The five most dominant tree species (by proportion of basal area) for each assessment type in New York City. Live trees were used for calculations of basal area and number of trees in each assessment. All assessments were conducted between 2013 and 2015. The citywide urban forest data were field collected across the entire urban canopy (n = 296, Nowak et al 2018a), the natural areas assessment (n = 1124, Pregitzer et al 2019) was field collected in municipally-owned forested natural areas, and the street tree census was field collected as a full census of publicly-owned street trees (n = 652, 173 live trees measured by NYC Parks).
| Species | Native status | Percent basal area in assessment | Percent number of trees in assessment |
|---|---|---|---|
| Urban forest | |||
| Norway Maple (Acer platanoides) | Non-native | 12.3% | 5.3% |
| Pin oak (Quercus palustris) | Native | 9.5% | 1.3% |
| London planetree (Platanus hybrida) | Non-native | 6.2% | 1.2% |
| White oak (Quercus alba) | Native | 5.5% | 3.7% |
| Black oak (Quercus velutina) | Native | 3.8% | 0.7% |
| Forested natural areas | |||
| Red oak (Quercus rubra) | Native | 20.4% | 4.4% |
| Sweetgum (Liquidambar styraciflua) | Native | 16.5% | 10.1% |
| Black cherry (Prunus serotina) | Native | 6.0% | 8.5% |
| Red maple (Acer rubrum) | Native | 5.7% | 7.0% |
| Tulip-tree (Liriodendron tulipifera) | Native | 5.6% | 1.9% |
| Street trees | |||
| London planetree (Platanus x acerifolia) | Non-native | 34.5% | 13.3% |
| Pin oak (Quercus palustris) | Native | 14.9% | 8.2% |
| Honey locust (Gleditsia triacanthos var.) | Non-native | 6.1% | 9.9% |
| Norway maple (Acer platanoides) | Non-native | 6.0% | 5.2% |
| Silver maple (Acer saccharinum) | Native | 4.8% | 1.9% |
For measures of forest structure, forested natural areas had higher tree density and biomass per hectare on average than estimates for street trees and the entire urban forest (figure 2). Forested natural areas had an average of 972.3 (±788.2) trees per hectare, and average biomass of 215 676 (±175 612) kg per hectare. Street trees have an average tree density of 8.4 trees per hectare and an average biomass of 7,582 kg per hectare. Density estimates of the entire urban forest were lower than forested natural areas, with an average density of 120.3 (±231.5) trees per hectare and average biomass approximately seven-times lower of 32 996 (±73 473) kg per hectare.
Using the citywide urban forest assessment, the estimate for the total number of trees is 9.28E + 06 (±1.04E + 06) and the total estimated biomass is 2.55E + 09 kg (±3.30E + 08) for all trees in New York City (Supplemental materials), including street trees and forested natural areas as well as privately owned and landscaped trees. However, using just the natural areas assessment, the estimate for the total number of trees in forested natural areas accounts for approximately two-thirds of the total estimate for the city with 6.07E + 06(±146 581) trees and a total estimated biomass of 1 344 711 202 kg (±3.27E + 07). For the street tree census, the number of live trees counted was 652 173 and the biomass estimated for those trees is 552 209 991 kg (see supplemental table 3).
Discussion
The idea that total urban tree canopy is synonymous with urban forest has, perhaps unsurprisingly, been translated into the design of urban tree assessments (Nowak et al 1996, 2008; Alonzo et al 2016). Our results suggest, however, that urban tree canopy differs substantively from the composition and structure of areas traditionally defined as forest land. Specifically, the citywide urban forest assessment paints the picture that non-native species dominate, which feeds into data-based conceptions that non-native species are commonly the dominant tree taxa in cities (Davey Resource Group 2008, Nowak et al 2011). We found that forested natural areas are instead dominated by native species, and that this land cover type is where the majority of trees are found in New York City both numerically and in terms of biomass. Yet forested natural areas represent only about 25% of urban canopy cover (and 5.5% of total city cover), which may explain why the assessment of the entire urban forest was not representative of their condition. It is important to represent their condition accurately because urban forest management typically focuses on promoting native species and forest types, and minimizing invasive species. The rationale for this focus is motivated by many reasons, including the protection of tree biodiversity (Kühn and Klotz 2006, Johnson et al 2017), the safeguarding of ecosystem services, and to support understory plant and animal habitat (Charles and Dukes 2008, Aronson and Handel 2011, Vilà et al 2011). This perceived value of native habitat, and of the ecosystem services it provides, is reflected in priorities for urban planning (Nilon et al 2017). However, if such planning priorities are to be executed successfully, they first require accurate baseline data on forest condition which means that urban forest assessments must capture the spatial variation in the structure and composition of forested areas in cities.
Studies in other cities that have stratified natural area forest types report that these forests are naturally regenerating and dominated by native tree species (Pauleit et al 2002, Zipperer 2002, Kühn et al 2004). However, such findings appear overshadowed, in policy making to preserve or enhance urban canopy, by non-stratified assessments of the entire urban forest canopy. This may be because non-stratified assessments of the urban forest have been used to estimate the total ecosystem benefits of urban forests, including air pollution removal and carbon storage and sequestration (Nowak and Crane 2002, Nowak et al 2002). Further, they have been used to suggest that there are declines in urban forest cover across the US (Nowak and Greenfield 2018a), and have been the basis for urban forest management plans and policy recommendations (Morani et al 2011, Gaston et al 2013). i-Tree is one of the most common field-based sampling approaches used in urban areas (Nowak et al 2018b), and is commonly used to sample the entire urban forest, in major US cities including New York, i-Tree assessment leads to the conclusion that non-native species comprise the dominant tree taxa (Nowak et al 2016, Nowak et al 2017, Nowak et al 2018a). Our results suggest that findings from such assessments that do not stratify natural area forest apart from other urban trees may not be reflective of the condition of more than half the tree number and biomass found in the urban canopy, and hence are likely inappropriate for making policy and management decisions about how to steward the urban canopy. Certainly, the insights such assessments provide do not capture the condition of natural area forests, likely because they occur in a clumped, heterogeneous distribution across the city (figure 1). Instead, the random-placement of plots in non-stratified citywide assessments seems much more likely to sample street trees, which demand individual-tree focused management, as opposed to stand management. In particular, we found estimates from the non-stratified citywide urban forest assessment were more representative of street tree composition, despite forested natural areas having an estimated ten times more overall trees (supplemental table 2). The spatial distribution of street trees is more uniform across the landscape so when sampling plots are placed randomly across the city—as is the norm (Nowak et al 2008)—it is much more likely that landscape or street trees will be sampled. In fact, of the 296 random citywide urban forest plots, 40 fell within parkland and only 9 (3% of the plots) fell within forested natural areas. Consequently, summary results from these types of random assessments will be biased towards more evenly distributed and abundant canopy, rather than dominant areas of tree density or biomass. Our supplemental analysis (see supplemental figure 1) confirmed that lack of stratification, as opposed to differences in sampling intensity, appears to drive the misconception of forest structure and composition rendered by contemporary urban forest assessments.
For cities that prioritize maintaining and enhancing tree canopy through the management of urban forested natural areas, our results suggested that non-stratified, random sampling strategies will not yield the detailed information needed to make science-based management decisions. Notably, the non-stratified design also did not capture fully the characteristics of the street tree population, bringing into question the audience and utility of such assessment efforts. A solution is to stratify remotely-sensed datasets of tree canopy and land cover types into meaningful categories for management (as we show in figure 1). Urban forest assessments could then be appropriately designed to inform specific management strategies based on sampling trees or areas that demand specific management approaches. Such delineations are commonly used in rural forest timber stand inventories where accurate forest estimates are seen as essential to achieving goals (Eid et al 2004, Borders et al 2008).
As human populations and rates of urbanization rise, we will see greater impacts on the biology, ecology, and social use of forests heightening the need to understand urban forests and to develop effective management strategies to sustain them (Nowak et al 2005). Precise definitions of urban forest types will facilitate the development of an accurate understanding of their composition, through stratified sampling designs, where the data generated can translate to distinct goals for relevant urban forest types, with nuanced management recommendations necessary to meet specific targets. For example, the approaches and goals for urban forested natural areas and non-urban forest management are often aligned, and hence it makes sense to foster the integration of research efforts and management strategies across urban and rural boundaries. Forests in rural, exurban and peri-urban areas are human-influenced, but in urban settings the impacts are often magnified because these forests experience stressors and disturbances such as invasive species, climate change, nutrient pollution, and soil compaction in combinations and at intensities that exceed those currently experienced in many non-urban forests. Repositioning urban forested natural areas as central to understanding forthcoming human stressors on forest landscapes then holds promise for integrating them broadly into our understanding of the influence of human-caused stressors on forest ecology and management.
The integration of efforts to study non-urban and urban natural area forest will, additionally, place the ecology and management of city forests within conceptions of dynamic forest systems that span a continuum from more-to-less intense interactions with human settlement. To date, common forest management techniques and approaches (e.g. thinning, afforestation, seeding, enrichment planting, restoration) have not been rigorously tested or applied in urban areas. However, with clear definitions and accurate assessments of forests in cities, it is easy to envisage adoption of silvicultural strategies in cities that promote natural regeneration of desired species and successional trajectories that are resilient to disturbance (sensu O'Hara and Ramage 2013). Such definitions and assessments will also help to develop urban greenspace policy that accounts for differences in urban forest types and their management needs. The adoption of specific goals and management strategies into policy will ultimately reduce management costs and improve urban forest health (Rydberg and Falck, 2000), but will only be realized if forest stands are treated as distinct from the cumulative urban canopy.
Tree canopy can occupy a significant proportion of urban land, for example 21% of London and 29% of Singapore, and should not be perceived as having a uniform ecology and hence subject to the same assessment approaches, management needs or goals. However, there is little international, national, or state-level oversight for publicly-owned urban forests, meaning that where stratified assessments exist for individual cities, they appear to have had limited influence for other cities or regions. New assessment strategies might begin to be applied in common ways and in multiple cities to make a meaningful impact on our understanding of the importance of different types of urban canopy in cities. Leading agencies that have national or regional roles in urban forest assessments (e.g. the US Forest Service Urban Forest Inventory, i-Tree, European National Forest Inventory) could consider modifying existing methods to ensure that they accurately characterize different urban canopy types, including forest stands. Developing new conceptions of urban forests and how they are measured will help to maximize the benefits from trees in cities by promoting tailored forest management and conservation strategies, that are appropriate to the forest type, the stand condition, environment, future needs, and the resources available in cities.
Acknowledgments
Special thanks to the Natural Areas Conservancy, New York City Department of Parks and Recreation and the New York City Urban Field Station for sharing data; and to Mina Kim for GIS and database support. CCP is funded through a doctoral scholarship from the Yale School of Forestry and Environmental Studies, with additional support from The JPB Foundation. The findings and conclusions in this publication are those of the authors and should not be construed to represent any official USDA or US Government determination or policy.