

Abstract
Over 5 million ha of US Conservation Reserve Program (CRP) grasslands have been converted to annual crops since 2000, driven mainly by demand for corn grain ethanol. Much of the soil carbon sequestered under CRP is lost upon conversion, creating a 'carbon debt' that is presumed to be repaid by future greenhouse gas (GHG) savings from ethanol's substitution for petroleum. Model simulations, extrapolations, and national statistics rather than direct measurements have been used thus far to estimate the long-term global warming impact (GWI) of such conversions. Here we report measured GWIs for three 22-year-old CRP grassland fields and three conventionally tilled agricultural (AGR) fields (11–17 ha) converted to either annual no-till corn or perennial cellulosic (switchgrass or restored prairie) bioenergy crops. We assessed GWIs for each field over eight years using whole-system life cycle analysis (LCA) by measuring: (a) GHG fluxes via eddy covariance and static chamber methodologies, (b) farming operations and agronomic inputs, and (c) the fossil fuel offset by ethanol use. Payback times were much longer than those estimated by prior modeling efforts. After 8 years, cumulative GWIs of switchgrass, restored prairie, and corn at the CRP grasslands were, respectively, −2.6 ± 4.0, 6.9 ± 3.6 and 85.2 ± 5.1 Mg CO2-equivalent ha−1. The switchgrass system had repaid its carbon debt by year eight and the restored prairie will have likely repaid by year ten; however, the no-till corn system appears likely to require >300 years. The same bioenergy crops grown on former agricultural lands, with no sequestered carbon lost on conversion, repaid their carbon debts within two years. Results indicate that GWI estimates and carbon debt payback times due to conversion of CRP lands to annual bioenergy crops have been substantially underestimated by current models.
Export citation and abstract BibTeX RIS
1. Introduction
Bioenergy-derived fuel will be key to avoiding fossil fuel related greenhouse gas (GHG) emissions until transportation systems are sufficiently electrified [1], and as well bioenergy with carbon (C) capture and storage (BECCS) is a crucial part of almost all mitigation scenarios capable of constraining the global average temperature rise to 1.5 °C by 2100 [2]. However, growing bioenergy crops will require extensive land use changes that will have direct and indirect implications for slowing warming trends and mitigating the impacts of climate change [3–5].
Bioenergy crop production is met largely through diversion of existing croplands now used for food and feed production, or through conversion of uncultivated lands. The establishment of bioenergy crop production on grasslands emits a pulse of GHGs into the atmosphere [6], creating a C debt that must be repaid by future GHG savings to create a climate benefit [3, 7, 8]. In the US, ∼5.2 Mha of grassland in the Conservation Reserve Program (CRP) have been converted to annual crops (primarily corn) since 2000 [9] in response to higher demand for corn grain ethanol [10–12].
Several studies have assessed the climatic impact of bioenergy production on CRP fields using lifecycle analysis (LCA) [3, 7]. However, in lieu of direct field measurements, yields, soil C storage, and GHG emissions are estimated from model simulations, extrapolations, national statistics, or a combination thereof [13]. Soil C storage and N2O emission estimates, in particular, are highly uncertain yet substantial components of GHG balances [13]. Estimates suggest that ∼360 Mt of CO2-equivalents (CO2-eq) could be potentially released to the atmosphere due to conversion of CRP grasslands to corn bioenergy [3, 7]. These estimates, while highly uncertain, appear to have payback times of decades. Conversion of CRP grasslands to perennial native monoculture or mixed-grass bioenergy crops, on the other hand, may incur no or little C debt [3, 7]. Diversion of existing croplands to bioenergy crops, although not incurring direct C debt, may cause land conversion to new croplands elsewhere to meet food demands displaced by bioenergy production, thereby creating indirect C debt [4, 14].
In this study, we converted three 22 year old CRP grasslands and three existing, conventionally tilled corn-soybean agricultural lands (AGR) to either annual no-till corn or perennial cellulosic (switchgrass or restored prairie) bioenergy crops. We also maintained one CRP grassland (9 ha) to serve as a reference (figure S1 is available online at stacks.iop.org/ERL/14/024019/mmedia). The CRP fields had significantly higher soil C and N content, and below and above ground biomass, than the AGR fields prior to conversion [15–17]. We present a whole-system LCA of the global warming impact (GWI) of all converted fields over eight years by measuring GHG fluxes (CO2, N2O and CH4), farming operations, agronomic inputs and a fossil fuel offset credit that include co-products. We hypothesize that: (i) conversion of CRP fields to annual and perennial bioenergy production will result in a net source of CO2-eq to the atmosphere, while bioenergy production at AGR fields will remove CO2-eq from the atmosphere for many years following conversion; and (ii) perennial (switchgrass and restored prairie) cellulosic bioenergy crops will provide immediate climate benefits on converted cropland and delayed benefits on converted CRP lands.
2. Materials and methods
2.1. Study sites
The study sites are located within the northeastern part of the US Midwest Corn Belt in southwest Michigan at the Great Lakes Bioenergy Research Center of the Kellogg Biological Station (KBS) Long-Term Ecological Research (LTER) site (42 °24' N, 85 °24' W, 288 m asl). The region has a humid continental temperate climate. The 30 year (1981–2010) mean annual air temperature of the area is 9.9 °C and the mean total annual precipitation is 1027 mm with about half falling as snow [18]. Table S1 presents annual and growing season climate data for the study period. Soils are Typic Hapludalfs, well-drained sandy loams formed on glacial outwash [19, 20] with loess intrusions [21].
Six sites (11–17 ha) were converted to no-till Glyphosate-tolerant soybean (Glycine max L.) in 2009, of which three had been managed as CRP grasslands dominated by smooth brome grass (Bromus inermis L.) for 22 years and three had been managed as conventionally tilled corn-soybean rotation agricultural croplands (AGR) for 50+ years prior to conversion. All sites were treated with glyphosate (N-(phosphonomethyl) glycine; Syngenta, Greensboro, NC, USA) before conversion to kill existing vegetation. The killed vegetation was left in place. Soybeans were planted in 2009 to allow as many herbicide applications as needed to fully suppress weeds, especially necessary at the CRP fields. Switchgrass (Panicum virgatum L.) and restored prairie (19 species; table S2, [17]) in 2010, and corn (Zea mays L.) each year from 2010 onwards, were grown in fields of each land use history. Switchgrass and restored prairie were harvested from 2011 onwards. Corn stover was left in place in all years but the last two years, when ∼35% was removed for bioenergy feedstock [22]. A seventh site (9 ha), dominated by smooth brome grass, was maintained as a reference CRP field (CRP-Ref; figure S1). More information on conversion and management practices is presented in table S3 (see [23]).
2.2. Global warming impact (GWI)
GWI (g CO2-eq m−2) was computed as the sum of CO2-eq (g CO2-eq m−2) of adjusted net ecosystem C exchange (NEEadj), soil N2O and CH4 fluxes, emissions from farming inputs and operations, and a fossil fuel offset credit that includes co-products (see supplementary material). A positive CO2-eq or any of its components implies net emission to the atmosphere.
The NEEadj was computed as the sum of NEE (net ecosystem C exchange) and the C harvested in grain, stover and biomass. Half-hourly NEE was calculated from the eddy covariance (EC) CO2 fluxes. Data analysis, quality checks, and gap-filling were conducted post-data collection [22, 24]. Biomass C was calculated as the C fraction of harvestable grain (corn and soybean) and lignocellulosic biomass (corn stover, switchgrass, and restored prairie) that weighed following harvest of the entire field. NEEadj assumes that all harvested C is eventually re-emitted to the atmosphere [22, 25].
Soil N2O and CH4 fluxes were measured bi-weekly when soils were not frozen (April–November) using static chambers [26] with fluxes for days between samples linearly interpolated [23]. The samples were analyzed using a gas chromatograph (Agilent 7890 GC, Santa Clara, CA) with a 63Ni electron capture detector (350 °C) for N2O and a flame ionization detector (300 °C) for CH4. The CO2-eq values of soil N2O and CH4 fluxes were calculated using 100 year average global warming potentials of 298 for N2O and 25 for CH4 [27].
The CO2-eq emissions associated with farming were calculated as the sum of CO2-eq emissions from diesel fuel consumption by farm machinery (table S4) based on actual field practices and from seed, fertilizer and herbicide production (table S5).
A fossil fuel offset credit for ethanol was computed from the dry mass yield (kg m−2 yr−1), its ethanol production potential (L kg−1), and its ethanol energy content (MJ L−1) compared to the equivalent energy and CO2 emissions for the gasoline use the ethanol would offset (table S6). For corn, this credit included grain in all years with ∼35% of the stover added in 2015 and 2016. We also accounted for GHG emissions from ethanol production and additional offset credits from the production of dried distillers' grains solubles (DGS; from grain ethanol production) and electricity generation (from cellulosic ethanol production) (table S6).
3. Results
3.1. Global warming impact (GWI)
The annual GWI of corn at the CRP field showed high CO2-eq emission to the atmosphere in all study years, while that of the corn at the AGR field fluctuated around neutrality (figure 1). The annual GWI of the perennials at the AGR fields showed net CO2-eq uptake in almost all study years except for a small emission from the switchgrass in 2009 and a near neutral emission at the restored prairie in 2011. The annual GWI of the perennials at the CRP fields, on the other hand, showed high initial CO2-eq emission but, on average, progressively decreased to show similar CO2-eq uptake to their AGR counterparts towards the second half of the study years. The CRP-Ref field was near neutral in all years except for relatively higher emissions in 2010 and 2012.

Figure 1. Annual global warming impact (GWI) for all systems from 2009 through 2016. The CRP-Ref was maintained in smooth brome grass and all other fields were converted either from Conservation Reserve Program (CRP) grassland or conventionally tilled corn-soybean rotation agricultural lands (AGR) to no-till soybean in 2009 and to no-till corn, switchgrass or restored prairie systems from 2010 onwards. The broken horizontal line indicates neutral CO2-eq emissions, with below and above the line indicating CO2-eq uptake from and emission to the atmosphere, respectively.
Download figure:
Standard image High-resolution imageThe cumulative GWI of corn at the CRP field was 85.2 ± 5.1 Mg CO2-eq ha−1 emission with increasing trends while that of the perennials initially showed high CO2-eq emission but slowed and reversed direction few years after conversion (figure 2, table S7). The cumulative GWI of switchgrass at the CRP field shifted from CO2-eq emission to CO2-eq uptake by year eight; while that of restored prairie showed emission by the same time. The CRP-Ref field exhibited an emission with a cumulative GWI of 9.2 ± 3.4 Mg CO2-eq ha−1. The cumulative GWI (Mg CO2-eq ha−1) of the perennial bioenergy crops at the AGR field was −31.6 ± 3.7 for switchgrass and −38.5 ± 3.3 for restored prairie (i.e. net uptake), but near neutral (−1.7 ± 4.4) for corn over the 8 years (figure 2, table S7).

Figure 2. Cumulative global warming impact (GWI) for all systems (2009–2016). See figure 1. for land use conversion history.
Download figure:
Standard image High-resolution image3.2. GWI components
The largest contribution to the CO2-eq cost at all CRP fields over the 8 years was due to NEEadj, with the corn field (90.0 ± 4.4 Mg CO2-eq ha−1) exhibiting ∼12 times higher emissions than the CRP-Ref field and ∼5 times higher emissions than the perennial fields (figure 3, table S7). The corn at the AGR field had a near neutral emission of ∼3.0 ± 3.7 Mg CO2-eq ha−1 while the perennials exhibited uptakes of −17.5 ± 3.7 and −25.7 ± 3.2 Mg CO2-eq ha−1 at the switchgrass and restored prairie fields, respectively, due to NEEadj. The NEEadj showed greater emission or less uptake of CO2-eq for corn than for the perennials within each land use history.
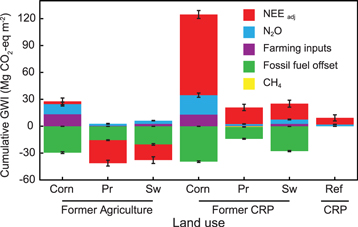
Figure 3. Cumulative global warming impact (GWI; Mg CO2-eq ha−1). Bars represent individual components contributing to global warming impact arising from net ecosystem C exchange and C in harvest, soil N2O and CH4 fluxes, farming inputs and fossil fuel offset credit for ethanol production in all bioenergy systems (2009–2016). The soil CH4 fluxes are too small to be visible in the stacked bar charts. See figure 1. for land use conversion history.
Download figure:
Standard image High-resolution imageN2O emissions from corn at the CRP field (21.7 ± 2.4 Mg CO2-eq ha−1) was ∼10 fold higher than emissions from all unfertilized perennial fields and ∼2 fold higher than that of corn at the AGR field that was fertilized at the same N rate over the 8 years. The fertilized switchgrass fields had ∼2 fold higher N2O emissions than those of the unfertilized perennial fields. Very small amounts of CH4 consumption ranging from −0.03 to −0.76 Mg CO2-eq ha−1 were observed at all fields over the 8 years (figure 3, table S7).
The farming CO2-eq cost was ∼13.0 for corn, 2.6 for switchgrass, and 0.5 Mg CO2-eq ha−1 for restored prairie, irrespective of land use history (figure 3; tables S7 and S8). The fossil fuel offset credit was −39.4 ± 0.9 and −29.4 ± 1.0 for the corn fields, −27.6 ± 0.6 and −20.3 ± 0.9 for the switchgrass fields, and −13.3 ± 0.5 and −15.5 ± 0.5 Mg CO2-eq ha−1 for the prairie fields with the CRP and AGR land use histories, respectively (figure 3; table S7).
3.3. Carbon debt payback time
Corn at the CRP field was calculated to pay back its C debt in ∼380 years and the restored prairie in 10 years following conversion, while switchgrass has already paid back its debt by the 8th year (see supplementary information for computation). The bioenergy crops at the AGR fields accumulated no C debt.
3.4. CO2-eq emission reduction relative to fossil fuel
Relative to fossil fuel lifecycle GHG emissions, bioenergy from corn planted at former agricultural land (AGR) was more positive than gasoline in most years, ranging from a near neutral −3%–114% (table S12) except during the 2012 drought year, for which the percentage reduction compared to gasoline dropped to −175%. Not including the initial 2009 soybean year, the average percent improvement over gasoline was 20 (±16)% (figure 4, table S12). At the CRP lands, on the other hand, GHG reductions for biofuel produced from corn were never positive relative to gasoline, averaging −137 (±13)% for the 2010–2016 period.

Figure 4. Average CO2-eq emission reduction for all bioenergy systems (2010–2016) compared to lifecycle emissions of petroleum-based gasoline. The broken lines indicate 20% and 60% lifecycle GHG emission reduction relative to fossil fuel for corn grain and cellulosic biofuels, respectively, to qualify as a renewable fuel in the US (EISA, 2007). Fields were converted from conventionally tilled corn-soybean rotation agricultural (AGR) lands or Conservation Reserve Program (CRP) grassland to no-till soybean in 2009 and then to corn (AGR-C, CRP-C), switchgrass (AGR-Sw, AGR-Sw) or restored prairie (AGR-Pr, CRP-Pr) systems from 2010 onwards.
Download figure:
Standard image High-resolution image
Year to year variability was also high for perennial crops (table S12), but percentage improvements over gasoline were substantially greater and more consistently positive especially after their first (2011) harvest year. Restored prairie at AGR land, for example, exhibited improvements of 218%–505% from 2012 onward, for an average of 302 ± 21% from 2012 and 203 ± 16% overall (including their 2010 planting and first harvest years). At the CRP land, improvements from 2012 (from −17%–384%) were less than those from restored prairie at AGR land but still high: on average, improvements were 161 ± 15% relative to gasoline, with an average of 78 ± 11% when including the 2010 planting and first harvest years. Switchgrass at AGR land exhibited average savings of 171 ± 27% from 2012 (91%–301%), and an average reduction relative to gasoline of 164 ± 20% including the 2010 planting and first harvest years. At the CRP land, GHG reductions for switchgrass were on average 95 ± 29 from 2012 (−27%–272%), and 82 ± 20% overall (from 2010).
4. Discussion
We found, consistent with our hypotheses, that the CO2-eq emission and associated C debt payback time of bioenergy crops are strongly influenced by land use history, farm management practices, and perenniality of the bioenergy crop. At the CRP field, corn showed the highest CO2-eq emission to the atmosphere over the 8 years with no indication of paying back the C debt it incurred following conversion, while the perennials either had paid (switchgrass by the 8th year) or were close to paying (restored prairie) their C debt. At the AGR field, the corn was near neutral while the perennials exhibited a large immediate rate of CO2-eq uptake from the atmosphere (figure 2).
4.1. Global warming impact (GWI)
The annual GWI of corn planted on the CRP field remained high with on-going CO2-eq emissions and consequently the cumulative GWI trend was upward with no sign of stabilizing or reversing direction. The annual GWI of corn at the AGR field, with a shift from conventionally tilled corn-soybean rotation to no-till continuous corn, fluctuated around zero and while cumulative GWI remained negative (i.e. net uptake) throughout, it tended towards neutrality in 2016, the last year of this study.
The perennial bioenergy crops at the CRP fields exhibited negative CO2-eq emissions after very large initial emissions. The initial high CO2-eq emissions appeared likely due to land use legacy coupled with no or low harvest yield during the establishment phase of the perennials (table S9). The CO2-eq uptake in the latter years suggests that these fields will fully repay their C debt in the near future. The high annual CO2-eq uptake of the perennials at the AGR field in almost all the years studied indicated their relatively large climate change mitigation potential.
Bioenergy crop production provided substantially higher climate change mitigation at the AGR fields than at CRP fields for a given crop type. This seems mostly due to the higher initial soil and plant biomass C and N at the CRP fields [15–17] that became available for microbial decomposition following conversion. This land use legacy, persisting in the C and N content of the system [23], greatly influenced CO2-eq balances. The perennial bioenergy crops also provided substantially higher climate change mitigation than the corn bioenergy crop within a given land use history due to their lower fossil fuel, fertilizer and herbicide requirements, and higher net C uptake.
The cumulative GWI of the unconverted CRP-Ref field, with no fossil fuel offset credit, was largely due to emissions during the drought year 2012 (table S1), underscoring the susceptibility of unmanaged grasslands to natural disturbances like drought [22]. In other years, GWI for the CRP-Ref field was near neutral. Soil C sequestration in the CRP-Ref field may be approaching equilibrium after remaining fallow for 30 years [e.g. 28].
Assuming the GWI of the CRP fields would have been similar to that of the unconverted CRP-Ref field had they not been converted, the corn field would have avoided ∼75.9 ± 6.2 Mg CO2-eq ha−1 emission, the switchgrass field would have emitted ∼11.8 ± 5.3 Mg CO2-eq ha−1 and the restored prairie field would have had similar (∼−2.3 ± 5.0 Mg CO2-eq ha−1) emissions over 8 years. Likewise, assuming the GWI of the perennial fields would have been similar to that of the corn at the AGR fields, had they remained in corn, the switchgrass and restored prairie fields would have emitted ∼29.9 ± 5.9 Mg CO2-eq ha−1 and ∼36.8 ± 5.5 Mg CO2-eq ha−1, respectively, over 8 years.
4.2. GWI components
The largest component of the CO2-eq emission at our CRP fields was NEEadj—reflecting the change in soil and plant biomass C storage—with emission for corn by far greater than for the perennial crops. On the other hand, a large CO2-eq uptake for the perennials and a small emission for corn due to NEEadj was observed at the AGR fields. The higher CO2-eq emission due to NEEadj for corn than for the perennials at both the AGR and CRP fields was likely due to greater C accumulation in the extensive live roots of the perennials compared to the annual roots of corn that die and become available for microbial decomposition each year following harvest [22]. Thus, land use legacy, coupled with ongoing management practices, has a lasting effect on NEEadj and consequently the LCA of bioenergy crops [22, 23].
The cumulative N2O emission observed at all fields was proportional to the N fertilizer input rate with corn fertilized at ∼180 kg N ha−1 yr−1 showing the highest, switchgrass at ∼56 kg N ha−1 yr−1 showing the second highest, and the unfertilized restored prairie and smooth brome grass (CRP-Ref) fields showing the least and similar CO2-eq emissions. CO2-eq emission of corn at the CRP field from N2O was two-fold higher than that of corn at the AGR field, despite both fields' receiving the same amount of N fertilizer. This is likely due to higher soil C availability at the CRP than at the AGR field, which provided a readily available C source for the denitrifying microbial community [23, 29]. Our study did not consider winter soil N2O fluxes, which could be ∼8% of the cumulative soil N2O fluxes [30] and, thus, the annual soil N2O fluxes may have been underestimated. The soil CH4 fluxes were small and had little effect on the overall CO2-eq balance of the system (figure 3).
The CO2-eq costs of farming inputs were mainly dependent on the management intensity of the fields, irrespective of land use history, with a rank order of corn ≫ switchgrass > restored prairie. The perennial crops lacked substantial CO2-eq emissions associated with seed, fertilizer and herbicide productions and related field operations (figure 3; tables S7 and S8).
The fossil fuel offset was mainly a function of the harvested dry mass available for bioethanol conversion (table S9). Harvestable biomass was higher for corn than for the perennial fields, especially during the first three establishment years of the perennials when there was no or little yield. The yield, hence fossil fuel offset, was also higher at the CRP than at the AGR fields—reflecting land use legacy—for both the corn and switchgrass. For restored prairie, however, it was slightly higher at the AGR than at the CRP field, likely due to a shift in species composition with C4 grasses becoming more dominant at the AGR than at the CRP field especially following the 2012 drought [17].
4.3. Carbon debt payback time
The corn at the CRP field (CRP-C) may continue to emit CO2-eq to the atmosphere until a new soil C equilibrium is reached [22]. Eventually the soil C of the CRP-C may be depleted to the level of soil C of the corn at AGR (AGR-C) field, where the soil C has stabilized over at least five decades of cultivation of agricultural row crops. The stabilization of soil C at CRP-C field may take another six years, based on the average CRP-C NEEadj, accumulating a GWI of 143.5 Mg CO2-eq ha−1 in 14 post-conversion years. Assuming annual GWI of the CRP-C and AGR-C (−0.4 Mg CO2-eq ha−1 yr−1; 2010–2016) would be similar at this time, the C debt that will have been accrued in the 14 years at the CRP-C may be repaid in ∼380 years following conversion. While these findings agree that grain biofuel crops grown on uncultivated lands with high initial soil C content remain net sources of CO2-eq to the atmosphere for many years after conversion, the time it takes for the fields to repay their C debt is ∼10 fold longer than that indicated by previous modeling studies. For example, Fargione et al [3] estimated a payback time of 48 years based on modeling, and Gelfand et al [7] estimated a payback time of 40 years based on conversion year measurements and forward projections. The shorter payback times in those studies are due to underestimation of the amount of CO2-eq that would be emitted until soil C stabilization, and overestimation of CO2-eq savings that would be incurred afterwards.
Fargione et al [3] and Gelfand et al [7] note that CRP grasslands might avoid C debt if they were replanted to native or mixed grass species for biofuel production. To do so would require greater attention to C management than in our study, where we found eight (switchgrass) or anticipate ten (restored prairie) years of payback time. In particular, greater care must be taken to protect existing soil C, perhaps avoiding the soybean breakout year with its diminished plant cover and instead planting switchgrass or restored prairie directly into the existing CRP stubble. Additionally, were the existing CRP biomass harvested for bioenergy prior to conversion, the ethanol produced could also be used to reduce debt [7]. Alternatively, the CRP grassland could remain unconverted but be annually harvested for bioenergy, albeit with fewer energy or biodiversity benefits than a more productive or biodiverse crop [13].
4.4. CO2-eq emission reduction relative to fossil fuel
The US Energy Independency and Security Act (EISA) of 2007 requires biofuels to emit at least 20% less GHG than gasoline from petroleum, and cellulosic biofuels, 60% less, to qualify as a renewable fuel in the US. In this study, corn grown on former agricultural land (AGR) met the 20% threshold only five out of seven years (table S12). In one year corn-based ethanol had about the same GHG emissions as gasoline and in the 2012 drought year its emissions were substantially worse. Not including the initial soybean year, the overall average for corn grown on former agricultural lands was 20%—similar to EISA requirement. When grown on former CRP lands, in no years did corn-based biofuels meet the 20% threshold; in all years GHG emissions were substantially more than petroleum-based gasoline (table S12).
In contrast, perennial crops grown at AGR land exhibited substantial GHG emission improvements relative to gasoline in all years but one after the 2010 planting year, with percentage improvements ranging from 91% to 505% (table S12). The exception was restored prairie in its first harvest year. Even with this exception and including the planting year with no bioenergy production, however, the average reduction for restored prairie was 203%, and for switchgrass, 164%. On the other hand, reductions for perennial crops grown at CRP lands were more mixed, meeting the 60% threshold for cellulosic biofuels in only three of the six post-planting years. Six year averages including the planting year were, however, still over the 60% threshold for both crops: 78% for restored prairie and 82% for switchgrass.
Worth noting, however, is than when averages include the initial 2009 conversion year in soybeans, common to all of our systems, no crops at CRP lands met the EISA 20% biofuel designation threshold for the eight years of our study (table S12).
LCA models project emission reductions relative to fossil fuel for crops grown on former agricultural lands that range from 4%–57% for corn grain and 88%–99% for switchgrass-based ethanol [31–33]. These values bracket our empirical average for corn-based ethanol (20%) but predict only half the benefit of our perennial crops, even including our planting year (164%–203%, on average).
5. Implications
The large biomass supply needed to meet climate mitigation needs requires extensive land area. The diversion of existing croplands or conversion of unmanaged lands (e.g. CRP grasslands) has implications for atmospheric CO2-eq balance. Our findings indicate that converting CRP fields to corn emitted a large amount of CO2-eq that we project will take ∼380 years to repay. This suggests that the ∼5.2 Mha of US CRP grasslands converted to agricultural production between 2007 and 2016 [9], mostly to corn in response to higher demand for corn grain ethanol [10–12], emitted unintended CO2-eq into the atmosphere, harming rather than helping the climate system. Had this land instead been converted to perennial bioenergy crops in a manner similar to that in this study, significant climate benefit would have started in 8–10 years, or earlier with better protection of existing C.
Growing corn bioenergy on existing croplands showed modest CO2-eq uptake in most but not all years, for an overall 20% average improvement in GHG emissions for corn-based ethanol relative to gasoline from petroleum (17% improvement when including our initial soybean year). That we found large swings in the benefit from year to year and no benefit in three of eight years (table S12) suggests that the overall improvement is relatively tenuous and especially weather (yield) dependent. The substantially greater and more consistent benefits of perennial crops (164%–203% improvement relative to gasoline from petroleum even when including the planting year) underscores the notion that substantial climate benefit could be gained by substituting perennial cellulosic feedstocks for corn grain feedstocks on land now used for corn grain bioenergy production, and with no indirect land use change (ILUC) effects because this land is not now used for food production [13].
In sum, native perennial bioenergy crops like switchgrass and restored prairie provide greater climate change mitigation compared to corn, and native species can enhance biodiversity and associated ecosystem services [34] and improve water quality [35]. Carbon market credit for the climate mitigation provided by planting switchgrass or native prairie grasses could also help incentivize farmers to convert marginal croplands to native perennial grasslands.
6. Conclusions
- Converting CRP grasslands to no-till continuous corn bioenergy crops released a large amount of GHGs to the atmosphere that will take >300 years to pay back. In contrast, converting CRP grasslands to perennial switchgrass and restored prairie released fewer GHGs that took only ∼8–10 years to repay.
- No-till continuous corn bioenergy crops on former croplands (AGR) showed little climate benefit, while perennial bioenergy crops on former croplands provided substantially higher and immediate climate change mitigation.
- Bioenergy crop production on former croplands provided substantially higher climate change mitigation than those on former CRP grasslands for each crop type, indicating the important role of land use legacy for generating C debt.
- Perennial bioenergy crops provided substantially more climate change mitigation than corn within each land use history, signifying the importance of management practices and especially the importance of perennial versus annual crops.
- CRP grasslands left fallow for many years tend towards neutral effects on climate change.
Acknowledgments
We thank T Zenone, H Chu, Y-J Su, C Shao, M Deal, R John and J Xu for assistance with eddy covariance measurements, J Bronson, P Jasrotia, K Kahmark, J Simmons, S VanderWulp, B Wilke and many others for lab and field assistance, J Schuette for help with figures, and S Bohm, and S Sippel for data management. We also thank the two anonymous referees for helpful comments. This work was supported by the US Department of Energy, Office of Science, Office of Biological and Environmental Research (DE-SC0018409 and DE-FC02-07ER64494), by the NSF Long-term Ecological Research Program (DEB 1637653) at the KBS, and by the Michigan State University AgBioResearch. Data available from the Dryad Digital Repository: https://doi.org/10.5061/dryad.224rg77.