


Abstract
There is a general lack of information about the potential effects of 1.5, 2 or more degrees of global warming on the regional climates within Africa, and most studies that address this use data from coarse resolution global models. Using a large ensemble of CORDEX Africa simulations, we present a pan-African overview of the effects of 1.5 and 2 °C global warming levels (GWLs) on the African climate. The CORDEX simulations, consistent with their driving global models, show a robust regional warming exceeding the mean global one over most of Africa. The highest increase in annual mean temperature is found over the subtropics and the smallest one over many coastal regions. Projected changes in annual mean precipitation have a tendency to wetter conditions in some parts of Africa (e.g. central/eastern Sahel and eastern Africa) at both GWLs, but models' agreement on the sign of change is low. In contrast to mean precipitation, there is a consistent increase in daily precipitation intensity of wet days over a large fraction of tropical Africa emerging already at 1.5 °C GWL and strengthening at 2 °C. A consistent difference between 2 °C and 1.5 °C warmings is also found for projected changes in annual mean temperature and daily precipitation intensity. Our study indicates that a 0.5 °C further warming (from 1.5 °C–2 °C) can indeed produce a robust change in some aspects of the African climate and its extremes.
Export citation and abstract BibTeX RIS

Original content from this work may be used under the terms of the Creative Commons Attribution 3.0 licence.
Any further distribution of this work must maintain attribution to the author(s) and the title of the work, journal citation and DOI.
Introduction
Discussions about setting goals to limit global warming by a predefined threshold have been actively ongoing since the middle of the 1990s when what was termed as tolerable global temperature window (ranging from 9.9 °C–16.6 °C) was introduced at the United Nations Framework Convention on Climate Change (UNFCCC) the First Conference of the Parties (COP) to in Berlin in 1995 (WBGU 1995). The upper end of this range is close to 2 °C above the global mean temperature during pre-industrial times and, therefore, the '2 °C target' has attracted much attention at international climate conferences and negotiations aiming to avoid dangerous climate change. The COP16 in 2010 adopted the Cancun Agreement with focus on holding the global temperature rise below 2 °C (UNFCCC 2010). Five years later, the Paris Agreement signed at the COP21 went further and additionally included a more ambitious 1.5 °C target, well below 2 °C above pre-industrial levels (UN 2015).
The global warming level (GWL) concept is useful for global climate policy and for the development of emission scenarios but in practice impact assessment and adaptation planning is implemented at regional and local scale. In the last decade an increasing number of studies focused on effects of different global warming levels at regional and local scale have been put forward (e.g. James and Washington 2013, Vautard et al 2014, Déqué et al 2016, Lennard et al in review). These, and many other studies, show that continental and regional temperature warming is not determined only by the annual mean GWLs. The spatial pattern of warming also strongly depends on region and season. Local magnitude of warming at the 1.5 or 2 °C global warming levels can be much higher leading to more extreme and severe regional footprints of global warming than what could be expected from directly considering global mean changes.
An important aspect of the 1.5 and 2 °C goals is to quantify if there is a significant reduction in regional and local climate risks between the two levels demonstrating benefits of limiting global warming to below 1.5 °C. Tebaldi et al (2015) showed that that differences of about 0.3 °C in global temperature result in statistically significant changes in regional annual mean temperature over more than half of the land areas, although as much as 2.5 °C–3 °C is required for a statistically significant change in regional annual average precipitation that is equally pervasive. Most prominent negative effects of the 0.5 °C increment can be seen in extreme events. For example the probability of a hot extreme at 2 °C warming is almost double that at 1.5 °C (Fischer and Knutti 2015). Positive impacts of holding global warming below 1.5 °C can be found for example in limiting local yield reduction of wheat and maize crops in tropical regions, in limiting bleaching of tropical coral reefs (Schleussner et al 2016) or in mean and extreme runoff in Europe (Donnelly et al 2017). However, differences in climate effects of the 1.5 and 2 °C GWLs are still not fully and comprehensively explored.
Many studies of regional effects of different GWLs are based on ensembles of coarse resolution global models (e.g. James et al 2014, Schleussner et al 2016) while for impact assessment and adaptation planning high-resolution regional climate information is necessary. Over Africa GWL studies are few and only one study is based on downscaled data (see a review of such studies in Lennard et al 2017). In the recent few years more and more studies have been using ensembles of high-resolution regional climate projections generated by Regional Climate Models (RCMs) within the Coordinated Regional climate Downscaling Experiment—CORDEX (Jones et al 2011, Giorgi and Gutowski 2015, Gutowski et al 2016). An initial focus in CORDEX is on Africa, which is particularly vulnerable to climate change and in general has a low adaptive capacity.
Multi-model CORDEX Africa ensembles are utilised for assessment of climate change in Africa applying the standard framework with focus on fixed time periods, often at the end of the century (e.g. Haensler et al 2013, Pinto et al 2015, Dosio 2017, see for more references an introductory paper to this focus collection—Lennard et al in review). However, only a few studies have used the CORDEX Africa simulations for assessment of climate risks of the 1.5 and/or 2 °C global warming levels in Africa (Déqué et al 2016, Weber et al 2017). Focusing on 1.5 °C is more challenging since the point in time when this GWL is reached is much closer than the commonly used end of the century and natural variability can strongly dominate on such near-term time periods, especially at the regional scale (e.g. Hawkins and Sutton 2009).
Earlier CORDEX-Africa studies were based on smaller subsets of the CORDEX-Africa ensemble due to the availability of a limited number of simulations. Here, for the first time, we utilise the most complete CORDEX-Africa ensemble at 50 km resolution (status of October 2017) and present a pan-African overview of effects of the 1.5 and 2 °C GWLs on the African climate at annual timescale. Special focus is on differences between the 1.5 and 2 °C GWLs. This paper is part of a focus collection of papers generated within CORDEX-Africa analysis activities (www.csag.uct.ac.za/cordex-africa/); it describes the common methodology (including definitions of GWL timing and a measure of robustness) used by the regional papers listed below. The focus collection includes an introductory paper (Lennard et al in press) that places this focus collection in the broader context of global warming level studies and four regional papers focusing on relevant seasons in West (Klutse et al in press), East (Osima et al in press), Central (Pokam et al in press) and Southern (Maúre et al in press) Africa. We should note that all these papers are descriptive and serve as an introductory analysis of the large CORDEX-Africa ensemble. These papers do not investigate e.g. potential drivers of climate change in Africa nor physical processes, as detailed analyses are ongoing within the CORDEX-Africa cohort with a number of papers in preparation that address these questions.
Data and method
CMIP5 global models
We use all climate change projections from the fifth phase of the Coupled Model Intercomparison Project (CMIP5: Taylor et al 2012) available through the Earth System Grid Federation (ESGF), see table 1S available at stacks.iop.org/ERL/13/065003/mmedia. The CMIP5 ensemble includes both Coupled Atmospheric General Circulation Models (AOGCM) and Earth System Models (ESMs) called here for brevity simply Global Climate Models (GCMs). There are 36 models in table 1S but many of them are from the same modelling centres and share many components leading to a smaller number of truly independent models (family of models) (Knutti et al 2013). Some GCMs have been run multiple times thereby generating single-model multi-member ensembles (different initial conditions or perturbed physics) and in order to avoid biases to these GCMs we use a smaller ensemble consisting of only the first member for each GCM.
CORDEX Africa RCMs
The CORDEX Africa ensemble consists of 11 Regional Climate Models (RCMs; table 2S) and most of them or their precursors are described in detail in Nikulin et al 2012. A subset of 12 CMIP5 GCMs has been downscaled by the RCMs over Africa at about 50 km resolution for 1951–2100. However, the CORDEX-Africa RCM-GCM matrix is sparse as none of the RCMs have downscaled all GCMs, scenarios and ensemble members. Currently, the RCM-matrix consists of 25 simulations assuming Representative Concentration Pathway (RCP) 8.5 and 4.5 and of 11 assuming RCP2.6.
Definition of global warming levels
We term the levels of average global warming set at the various COP meetings and also levels above these (e.g. 1.5, 2, 3, 4 °C) as 'global warming levels' (GWLs) in this paper. The timing of GWLs is commonly defined as the centre year of a long enough period when global mean temperature reaches predefined anomalies (1.5, 2, 2.5 °C etc.) relative to pre-industrial levels. Different definitions and terms for what we call GWLs exist in the literature, however all start with some pre-industrial (PI) baseline, use an averaged window period e.g. 15, 20 or 30 years (James and Washington 2013, Schleussner et al 2016, Vautard et al 2014), compute departure from the baseline and arrive at when the GWL of interest is reached.
There is also no unique definition of what the pre-industrial period actually is Hawkins et al (2017) argued that the 1720–1800 period is most suitable to be defined as pre-industrial but the 1850–1900 period is still a reasonable approximation for pre-industrial global mean temperature. Defining 20 or 30 yr pre-industrial periods within 1850–1910, the period when the GCM data for the CMIP5 historical experiment (1850–2005) is available, is a common approach in CMIP5 based studies (e.g. Alfieri et al 2015).
Timing of GWLs can also be defined based on a combination of the observed global temperature rise since preindustrial (e.g. 1861–1890 or 1881–1910) to present (e.g. 1971–2000 or 1981–2010) and the GCM-projected future warming relative to present (Joshi et al 2011, Vautard et al 2014, Dosio and Fischer 2018). The latter approach acts as a kind of bias-adjustment by bringing all GCMs to the same level of warming relative to the present period and basically equalises climate sensitivities across GCMs from the preindustrial to the present. Drawbacks of this approach include the observational uncertainty and artificially reduced/enhanced GCM climate sensitivities that may reduce the spread of GWLs across models. However, the combination of the observed and GCM-based warming for definition of GWLs simplifies interpretation of projected changes between the present climate and GWL periods since all GCMs start from the same warming levels in the present. Choice of one of the above approaches is subjective and depends on studies or often simply on availability of pre-calculated GWL timing. The most important uncertainty-related issue is that different approaches may lead to different conclusions on future climate effects at the same GWLs.
Here, we use the first approach and take 1861–1890 to define the pre-industrial (PI) period as it is available across all CMIP5 historical simulations. For each GCM the timing of GWLs is defined as the first time the 30 yr moving average (centre year) of global temperature is above 1.5 or 2 °C compared to pre-industrial. For each RCM downscaling, we use the same GWL timing as defined by the corresponding driving GCM to extract a 30 year period for analysis.
We define the control period (CTL) as 1971–2000, which is commonly used in impact application studies (e.g. Sakalli et al 2017) and consistent with earlier GWL studies in Africa (e.g. Déqué et al 2016). In addition, this choice minimizes overlaps between the control and 1.5 °C period (a small overlap, 1–3 years, is present for only a few GCMs' simulations, see table 1S).
The global warming targets defined by UNFCCC assume long-term stabilisation at the 1.5 °C or 2 °C warming levels. However, the CMIP5 RCPs were not designed to address GWL concerns, nor to analyze difference between the effects of 1.5° and 2 °C of global warming (James et al 2017). Of the existing RCP2.6 GCM simulations, which can be considered as the most appropriate proxy for holding GWL below 2 °C, only 10 CORDEX-Africa simulations have been generated by only two RCMs (see table 2S). In this study, therefore, we utilise the CORDEX-Africa runs driven by the RCP8.5 scenario, as, first, it comprises the largest ensemble (25 runs) and, second, may be considered as the most realistic business-as-usual scenario given the current trajectory of greenhouse gases emissions.

Figure 1. Timing of 1.5 and 2 °C GWLs under 3 RCPs for the grand CMIP5 ensemble (left), only the first member for each GCM if there was an ensemble available (centre) and the subset of the GCM simulations that used in CORDEX Africa (right). Numbers at the bottom show the number of GCM simulations reaching the 1.5 and 2 °C GWLs and numbers at the top show the median year of GWL timing. Individual GCMs are represented by dots while ensemble statistics by whisker boxes. The boxes enclose the median and interquartile range (IQR: the 25th to 75th quartiles of the data). The whiskers extend out to largest and smallest value within 1.5 times the IQR. Outliers are identified with empty circles.
Download figure:
Standard image High-resolution imageMeasure of robustness
The significance and robustness of the climate change signal can be defined according to many different methodologies (Collins et al 2013, Dosio and Fischer 2018). In this work we define the climate change signal as robust if the following two conditions are fulfilled:
- 1.more than 80% of model simulations agree on the sign of the change
- 2.the signal to noise ratio (SNR), i.e. the ratio of the mean to the standard deviation of the ensemble of climate change signals, is equal to or larger than one.
The second criterion is a measure of the strength of the climate change signal (with respect to the inter-model variability in that signal). We use the second criterion in addition to the first, because the first criterion alone may be not sufficient as it may be fulfilled even in the case of a very small, close to zero change. If only the first condition is met we use the term 'consistent'.
Precipitation-based climate indices
In addition to annual mean precipitation that is the simplest statistics characterising one of many aspects of precipitation climatology we utilise three climate indices providing more high-order details on precipitation climatology that can be relevant for agriculture and flood risk. The indices are: consecutive wet days (CWD), maximum consecutive 5 day precipitation (rx5day) and simple daily intensity index for precipitation (SDII), which describes mean rainfall intensity of wet days (Zhang et al 2011). Wet days used to calculate CWD and SDII are defined as days with more than 1 mm day−1.
Results
Timing of global warming levels
Selecting a subset of climate simulations from a grand ensemble (GCMs for downscaling or GCMs and RCMs for impact modelling) always raises a question whether the subset can adequately reproduce the statistics of the grand ensemble (e.g. mean and spread). McSweeney et al (2015) showed that subsets may exclude a significant fraction of the plausible range of future climate changes leading to underestimation of uncertainties. In order to take into account this issue, first we evaluate how the CORDEX Africa subset of the CMIP5 GCMs represents the grand CMIP5 ensemble in terms of timing of GWLs.
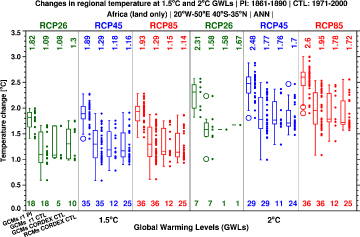
Figure 2. Projected changes in annual mean temperature averaged over Africa (20°W–50°E, 40°S–35°N, land only) at the 1.5 and 2 °C GWLs under three RCPs for the first member GCM ensemble relative to the preindustrial 1861–1890 (GCMs r1 PI) and relative to the control 1971–2000 (GCMs r1 CTL), for the driving GCMs downscaled in CORDEX-Africa (GCMs CORDEX CTL) and for the CORDEX Africa ensemble (CORDEX CTL) relative to the control period. Numbers at the bottom show the number of simulations reaching the 1.5 and 2 °C GWLs in each ensemble and numbers at the top show the median temperature increase in Africa. Individual simulations are represented by dots while ensemble statistics by whisker boxes (see figure 1 for details).
Download figure:
Standard image High-resolution imageFigure 1 shows timing for both 1.5 and 2.0 °C GWLs for the 3 RCPs (2.6, 4.5, 8.5) using (i) the grand CMIP5 ensemble (all GCMs and members in table 1S), (ii) a reduced CMIP5 ensemble (all GCMs but only the first member—r1i1p1) and (iii) only GCMs used for downscaling in CORDEX-Africa, even if some of them were downscaled only by one RCM and for one RCP (see table 2S). The median of timing of reaching 1.5 °C is relatively similar under all RCPs and ensembles (2023–2025 for RCP2.6, 2025–2030 for RCP4.5 and 2022–2027 for RCP8.5), although individual simulations can reach 1.5 °C as early as 2010 or as late as in 2060. For 2 °C the median year is about 10–15 years later compared to 1.5 °C (2034–2035 for RCP2.6, 2044–2046 for RCP4.5 and 2037–2040 for RCP8.5). The earliest timing of each GWLs does not depend on the underlying RCPs, because of the very similar emission trajectories and radiative forcing to 2030s. On the other hand, RCP8.5 shows the smallest spread in timings, with the exceedance of the two GWLs never being later than 2040 (1.5 °C) or 2055 (2 °C). This is because the radiative forcing associated with RCP8.5 progressively deviates from other RCPs from 2030 onwards. As the grand CMIP5 ensemble can be biased to a number of simulations with multiple members we take the first member ensemble as our reference. In the ensemble of CORDEX-downscaled GCMs the average the timing of GWL is about 2 years earlier and the spread is smaller relative to the first GCM member ensemble. The smaller spread results from one or two simulations in the first member ensemble having the earliest or latest timing, not being present in the CORDEX Africa model ensemble. We can see that the CORDEX GCM subset used for downscaling is a good approximation of the first member ensemble, especially taking into account all uncertainties related to estimation of timing of GWLs. We should also note that a direct comparison of timings across RCPs is not possible due to different numbers of simulations reaching the 1.5 and 2 °C levels under different RCPs and as only a few simulations reach the 2 °C level under RCP2.6.
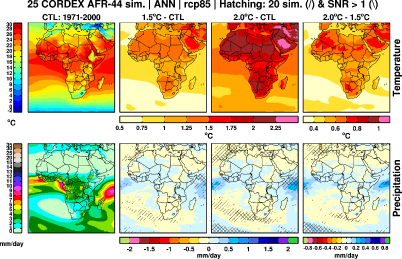
Figure 3. The CORDEX Africa ensemble average annual mean temperature and precipitation for 1971–2000 (CTL, left column), the projected changes at the 1.5 and 2° GWLs with respect to 1971–2000 (middle columns) and difference between the changes at 2 and 1.5° GWLs (right column). Areas where at least 80% of the simulations (20 of 25) agree on the sign of the change are marked by positively sloped hatching. Areas where the signal to noise ratio is equal or more than 1 are marked by negatively sloped hatching. For temperature all grid boxes satisfy the two criteria (the agreement and signal to noise ratio) and the hatching is not shown. Note that colour scales for the 2 °C–1.5 °C plots are different from the 1.5 °C—CTL and 2 °C—CTL ones.
Download figure:
Standard image High-resolution imageAnnual mean temperature and precipitation at 1.5 and 2 °C GWLs
Figure 2 shows changes in annual mean temperature over Africa projected at both GWLs. As the CORDEX simulations begin in 1950 direct assessment of projected climate changes at the 1.5 and 2 °C GWLs relative to the PI period can be done only for the GCMs ensemble ('GCM r1 PI' in figure 2). Additionally, we assess regional effects of GWLs relative to the control period 1971–2000 for first member GCM (GCMs r1 CTL in figure 2), CORDEX driving GCM (GCM CORDEX CTL) and CORDEX (CORDEX CTL in figure 2) ensembles in order to compare how consistent the global and regional ensembles are. For both GWLs and under all three RCPs Africa warms faster than the globe (GCM r1 PI, figure 2) as almost all GCMs project an increase in temperature above 1.5 and 2 °C for the respective ensembles. There is also a large spread in the continental warming over Africa (up to 1 °C) across the individual GCMs at the two GWLs. The stronger continental warming and the large spread in the GCM ensemble clearly show the importance of regional- and local-scale processes. One can also see a common tendency in the GCM ensembles to stronger regional warming at the same GWLs under higher RCPs, although number of simulations varies across the GCM ensembles, especially smaller for RCP2.6. Under RCP4.5 and 8.5 the CORDEX ensemble projects about the same (at 1.5 °C) or a a bit lower (at 2 °C) median warming in Africa compared to the CORDEX driving GCM ensemble. One can see that in general the RCP4.5 and 8.5 CORDEX ensembles have two clusters of the simulations: one on the higher warming side and one on the lower warming side (more simulations) but no simulations in between. Such distribution can be related to more regional simulations in the CORDEX-Africa ensemble driven by GCMs with lower continental warming in Africa. However, the spread of the warming in Africa is very well preserved in the RCP4.5 and 8.5 CORDEX ensembles compared to the driving GCMs. The RCP2.6 CORDEX ensemble consists of ten simulations at the 1.5 °C GWL that is not enough to establish robust ensemble statistics and compare this ensemble to ones under RCP4.5 and 8.5. Additionally, only one CORDEX driving GCM reaches the 2 °C GWLs under RCP2.6.
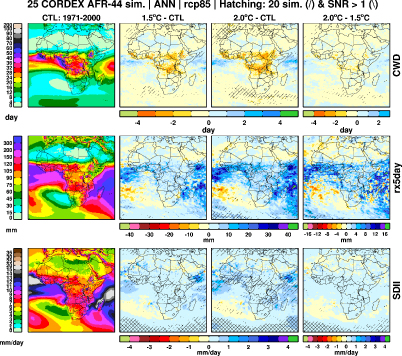
Figure 4. As figure 3 but for CWD (top), rx5day (middle) and SDII (bottom) indices.
Download figure:
Standard image High-resolution image
Spatial patterns of annual mean temperature and precipitation changes in the RCP8.5 CORDEX ensemble projected at the 1.5 and 2 °C GWLs relative to 1971–2000 are shown in figure 3. At the 1.5 °C GWL the strongest warming (1.25 °C–1.5 °C) over the African continent occurs in the sub-tropics (northern Africa and western part of southern Africa) while the tropics and the rest of southern Africa are warming slower (1 °C–1.25 °C). The strongest warming (up to 1.75 °C) within the CORDEX-Africa domain is found in the northeast corner (Arabian Peninsula and north of it) but this region is outside of the scope of this study. Many coastal regions and Madagascar have the lowest values of warming (0.75 °C–1 °C) showing coastal-ocean modulation of the regional warming level also noted by Déqué et al (2016). A similar weaker warming signal can be seen over Lake Victoria. The pattern of warming across Africa resembles similar structure at the 2 °C GWL but with expected higher magnitude: the strongest warming in the sub-tropics (2 °C–2.25 °C) and lower warming in the tropics (1.5 °C–1.75 °C). Also evident is the modulation of coastal temperatures by oceans e.g. over the coast of south-eastern Africa, which warm considerably less than the inland regions. The CORDEX RCP8.5 ensemble projects the robust (both 80% agreement and SNR > 1) warming over the entire domain at both GWLs and the robust difference between them (no hatching is shown for temperature in figure 3). Difference between the warming at the two GWLs shows the same pattern with higher warming in the sub-tropics. In general, the difference is above 0.5 °C over most of the African continent showing that in the CORDEX ensemble Africa warms faster than the globe. We should also stress that the projected warming at the 1.5 and 2 °C GWLs often regionally exceeds the respective 1.5 and 2 °C levels even if the projected changes are estimated not relative to the PI period but to the recent 1971–2000 climate.
The spatial pattern of projected changes in annual mean precipitation is similar for both GWLs. There is a tendency to wetter conditions in central/eastern Sahel and eastern Africa but there is no agreement on the sign of the change across the simulations over most of the continent. The first signs of the agreement on the sign can be seen outside of the African continent mostly over the oceans at 1.5 °C (the tropical Indian and Atlantic oceans, southern Atlantic and northwest of the domain). A robust increase or decrease (cross-hatched areas) in precipitation appears over most of these ocean regions at 2 °C that is also evident in the difference between the two GWLs. No agreement on projected changes in precipitation in Sahel at the 2 °C GWL was also found by Déqué et al (2016) using a smaller subset of 12 CORDEX-Africa simulations. Additionally, James and Washington (2013) using the CMIP3 GCMs showed that in Africa a weak signal in projected changes in precipitation emerges at the 2 °C GWL and is strengthened and extended at the 3 and 4 °C GWLs.
Precipitation-based climate indices at the 1.5 and 2 °C GWLs
Projected changes at the 1.5 °C GWL show a decrease (1–3 days) in CWD over parts of Central Africa and south of Sahel, although there is no agreement on the decrease (figure 4, top row). The decrease in CWD becomes stronger at 2 °C GWL. More than 80% of the simulations agree on the decrease over parts of Democratic Republic of Congo and Southern Sudan where the largest change is evident but the signal to noise ratio is still less than 1. A small (1 day) and consistent decrease in CWD appears at 2 °C in northwest of the domain touching coastal regions of northern Africa and in the Atlantic and Indian Oceans close to the South African coast. rx5day is projected to increase at both GWLs over the tropical Africa but the increase is not consistent (figure 4, middle row). The difference between projected changes between the 2 °C and 1.5 °C GWLs is mostly positive but, similarly to CWD, is not consistent. In contrast to CWD and rx5day, SDII shows a consistent increase over the tropical regions in Africa already at the 1.5 °C GWL (figure 4, bottom row). The increase amplifies and the area of consistent agreement becomes larger at the 2 °C GWL. However, there are no regions with SNR ratio larger than 1, indicating a small signal and/or large spread across the simulations. Higher SDII means that wet days become wetter, leading to more intense precipitation events even if the number of wet days decreases. Similar to our findings, Déqué et al (2016) showed an increase in precipitation intensity at the 2 °C GWL over west and central Africa even with decreasing number of wet days.
Discussion and conclusions
In this study, for the first time, we used the largest available CORDEX Africa ensemble to provide a pan-African overview on how temperature and precipitation on annual scale may change at the 1.5° and 2 °C global warming levels.
The subset of the CMIP5 GCMs used for downscaling in the CORDEX Africa activities well represents the median timing of both 1.5° and 2 °C GWLs, if compared to the full CMIP5 ensemble, although it slightly underestimates the spread. The CORDEX ensemble in turn well represents the spread of the warming in Africa compared to the driving GCMs but slightly underestimates its median at 2 °C GWL.
A robust and pronounced warming emerges in Africa at the 1.5 °C GWL and amplifies at the 2 °C GWL exceeding the global warming rates over most of the African continent. The strongest warming is found in the subtropics, whereas the weakest one in many coastal regions due to the effect of a slower warming ocean. There is a tendency towards an increase in annual mean precipitation in parts of Africa (e.g. central/eastern Sahel and eastern Africa) at both GWLs but uncertainties are large as the individual simulations do not agree on a sign of the change.
For high-order statistics of the annual precipitation climatology, such as consecutive wet days and maximum consecutive 5 day precipitation, projected changes at the 1.5 °C GWL show a decrease in CWD and an increase in rx5day. Changes in both indices become larger at the 2 °C GWL especially over tropical Africa where at least 80% of the simulations agree on the sign of change.
Consistent projected changes for precipitation-based indices are found also for Simple Daily Intensity Index for precipitation (mean rainfall intensity of wet days). There is an increase in SDII at both GWLs over large fraction of tropical Africa, especially at the 2 °C one, although this change is robust only in terms of models' agreement. The increase in SDII indicates a possible increase in magnitude of intense precipitation events, even in case of reduction in mean precipitation.
A robust difference in effects of global warming between the 2 and 1.5 °C levels on the regional climate in Africa is found only for annual mean temperature. The difference in temperature between the two GWLs is well expected, as the regional temperature response to global warming in Africa is very pronounced, although additionally it can be modulated by regional and local scale processes. Projected climate changes in annual and seasonal mean precipitation in Africa have large uncertainties and often models differ in the magnitude of precipitation change and, in some regions, even in the sign of the change (e.g. Aloysius et al 2016, Dosio and Panitz 2016). Additionally, large natural variability noise can mask the forced climate change signal in precipitation; even if a signal exists, it may be too weak, especially for near-term periods as the 1.5 GWL. For example, robust emergence of seasonal temperature change is found in the first two decades of the 21st century over Europe while the precipitation signals tend to emerge some 40–60 years later than the temperature signals (Kjellström et al 2013). Nevertheless, a consistent increase in SDII at the 1.5° and 2 °C GWLs as well as the difference between the two levels shows that regional response in precipitation extremes can be more pronounced than in the annual mean.
Analysis of large ensembles of global climate projections often is not straightforward when ensembles consist of models from the same family or models sharing similar components (Knutti et al 2013). In this case an ensemble can be biased towards some models leading to overconfidence on possible future climate changes. The situation becomes even more complex in regional climate modelling when a subset of GCMs is downscaled by a number of RCMs but not all RCMs downscale all GCMs from the subset. A common problem in CORDEX is that almost all RCM-GCM matrices are sparse and the CORDEX ensembles can be also biased towards specific RCMs. The present 25 member CORDEX Africa ensemble is indeed biased towards ten members of one RCM (SMHI-RCA4) downscaling ten GCMs (see table 2S) and analysis of such ensembles should be done carefully, trying to understand the response of the individual members. Different methods for selection of representative subsets of climate projections from larger ensembles (e.g. Mendlik and Gobiet 2016, Wilcke and Bärring 2016) can be used for regional assessments of climate change in addition to full ensembles.
We do not address the above issue in the present study and only provide an overview of what can be expected from the large CORDEX Africa ensemble at the 1.5° and 2 °C GWLs on pan-African scale. The study focuses on basic statistics and does not touch more complex aspects of the African climate as for example the onset and cessation of the rainy season and intraseasonal variability. These characteristics are strongly region-specific and should be analysed in detail on regional and local scales.
Acknowledgments
The authors would like to acknowledge support from the Swedish Government through Sida, The Swedish International Development Cooperation Agency. We also acknowledge logistical support from the CORDEX International Project Office, the Swedish Meteorological Institute and the Climate System Analysis Group at the University of Cape Town. We also acknowledge the World Climate Research Programme's Working Group on Coupled Modelling, which is responsible for CMIP, and we thank the climate modelling groups for producing and making available their model output. For CMIP the US Department of Energy's Program for Climate Model Diagnosis and Intercomparison provides coordinating support and led development of software infrastructure in partnership with the Global Organization for Earth System Science Portals.