

Abstract
Extra-tropical cyclones dominate autumn and winter weather over western Europe. The strongest cyclones, often termed windstorms, have a large socio-economic impact on landfall due to strong surface winds and coastal storm surges. Climate model integrations have predicted a future increase in the frequency of, and potential damage from, European windstorms and yet these integrations cannot properly represent localised jets, such as sting jets, that may significantly enhance damage. Here we present the first prediction of how the climatology of sting-jet-containing cyclones will change in a future warmer climate, considering the North Atlantic and Europe. A proven sting-jet precursor diagnostic is applied to 13 year present-day and future (~2100) climate integrations from the Met Office Unified Model in its Global Atmosphere 3.0 configuration. The present-day climate results are consistent with previously-published results from a reanalysis dataset (with around 32% of cyclones exhibiting the sing-jet precursor), lending credibility to the analysis of the future-climate integration. The proportion of cyclones exhibiting the sting-jet precursor in the future-climate integration increases to 45%. Furthermore, while the proportion of explosively-deepening storms increases only slightly in the future climate, the proportion of those storms with the sting-jet precursor increases by 60%. The European resolved-wind risk associated with explosively-deepening storms containing a sting-jet precursor increases substantially in the future climate; in reality this wind risk is likely to be further enhanced by the release of localised moist instability, unresolved by typical climate models.
Export citation and abstract BibTeX RIS

Original content from this work may be used under the terms of the Creative Commons Attribution 3.0 licence.
Any further distribution of this work must maintain attribution to the author(s) and the title of the work, journal citation and DOI.
1. Introduction
Sting jets are transient jets of air that descend from the tip of the hooked cloud head into the southwest quadrant (in the northern hemisphere) of cyclones evolving according to the Shapiro-Keyser (Shapiro and Keyser 1990) conceptual model; see the review by Clark and Gray (2018) for conceptual pictures of the low-level jets in sting-jet cyclones and a synthesis of their formation mechanisms. They were first formally identified from analysis of the Great October storm of 1987 (Browning 2004, Clark et al 2005) which affected the UK and France and was associated with an insured loss of $6.3 bn (indexed to 2012 values) (Roberts et al 2014). Sting jets can lead to strong winds, and especially gusts, near the ground either directly or through the amplification of strong winds already present in the synoptic-scale low-level jet associated with the cold conveyor belt (Martínez-Alvarado et al 2014). While the typically tightly-packed isobars in the southwest quadrant of intense cyclones lead to strong windspeeds consistent with gradient wind balance, a sting jet can enhance these windspeeds (as discussed by Browning (2004)). Even a relatively small enhancement of windspeed can lead to a large increase in damage as simple indices for storm severity (Leckebusch et al 2008) consider it to be proportional to windspeed cubed above a threshold. Recent damaging northern European cyclones in which sting jets have been identified include windstorms Friedhelm (in 2011), (Martínez-Alvarado et al 2014), and Ulli (in 2012) (Smart and Browning 2014), and the St Jude's Day storm (in 2013) (Browning et al 2015).
There is growing confidence in the thermodynamic changes of the atmosphere in the future: both theory and climate models agree on a warmer, moister mid-latitude atmosphere (Collins et al 2013). Studying changes in extreme weather systems is worthwhile, particularly when, as for windstorms, latent heat release and other heat-generating processes play a key role in the extremity of the associated weather. Despite large uncertainty in global circulation changes, climate models have improved in their ability to represent the number and intensity of North Atlantic extra-tropical cyclones (as shown by e.g. comparing climate models participating in phases 3 and 5 of the Coupled Model Intercomparison Project (CMIP5) (Zappa et al 2013); however, their resolution is still insufficient to represent phenomena occurring on the meso-β scale (2–200 km) and below. Consequently, while the synoptic-scale low-level jets within these cyclones are well-represented, mesoscale instability release in sting jets and embedded convection (leading to wind enhancement) are not resolved.
Recent work has applied a sting-jet precursor diagnostic to extended winters (September–May inclusive) in a 33 year reanalysis dataset (the European Centre for Medium-Range Weather Forecasts (ECMWF) interim reanalysis (ERA-Interim: Dee et al (2011)) to produce a climatology of North Atlantic sting-jet cyclones (Hart et al 2017). This diagnostic uses the presence of a type of mesoscale moist instability in the cloud head at the right time to identify cyclones in which the release of this instability (unlikely to be resolved by climate models and models used to generate reanalyses) could generate a sting jet or enhance a weak sting jet generated through either synoptic-scale descent in the frontolytic region of the cyclone (such as that identified by Schultz and Seinkiewicz (2013)) or through mesoscale frontal circulations. Sting-jet precursors were found in one third of all North Atlantic cyclones. Here we apply the same diagnostic to tracked, extended-winter cyclones from 13 year present-day and future (~2100) climate integrations to provide the first projections of the change in frequency of cyclones with sting jets and consequent effects on wind risk. The results from the present-day climate integrations are compared to the previously-published results from the reanalysis dataset to provide confidence in the suitability of the climate integrations used.
2. Methods
2.1. Climate integrations
While many climate integrations exist (for example Zappa et al (2013) use data from 22 CMIP5 climate models), it has been challenging to find suitable reasonably high spatial- and temporal-resolution climate model output. We have used output from global climate integrations that were previously performed to drive simulations downscaled to convection-permitting resolution (over a UK domain) (Kendon et al 2014). The climate integrations were produced with the Met Office Unified Model Global Atmosphere 3.0 configuration (Walters et al 2011). We used the global model 60 km horizontal grid spacing integrations that were used to drive the 12 km grid spacing regional climate model, which in turn drove the 1.5 km grid spacing convection-permitting simulation analysed in that study. While the 1.5 km model configuration can resolve the release of mesoscale instability, the model domain used is too small for the present study as it extends only over the southern region of the UK. Neither the global nor the 12 km grid spacing model configurations can fully resolve the release of mesoscale instability (due to insufficient vertical resolution in the 12 km configuration and insufficient horizontal and vertical resolution in the global configuration); the output from the global model configuration was used because the sting-jet precursor diagnostic has been designed for use with (and previously applied to) data with similar resolution. Six-hourly output from present-day (1996–2009) and future climate (~2100) 13 year integrations was used, considering the North Atlantic region and extended winter season (May–September inclusive) only. The future climate integration assumes the Intergovernmental Panel on Climate Change (IPCC) Representative Concentration Pathway (RCP) 8.5 scenario, the most extreme scenario in which greenhouse gas emissions are assumed to continue to rise throughout the 21st century. For the present-day integrations, monthly sea surface temperature (SST) is taken from the Program for Climate Model Diagnosis and Intercomparison (Kendon et al 2014). For the future-climate integrations, monthly SST is assumed to be the sum of the (multi-year) monthly mean difference between the periods 1990–2010 and 2090–2110 in runs of the Earth system model HadGEM2-ES (model described by Collins et al (2011)) and the monthly SST from the present-day simulation (Kendon et al 2014). Full details on the climate integrations are described in Kendon et al (2014).
2.2. Cyclone tracking and sting-jet storm identification
The method used to identify cyclones with sting-jet precursors follows that applied previously to the ERA-Interim reanalysis (Hart et al 2017) apart from the threshold modification described below. Extra-tropical cyclone tracks were diagnosed using the TRACK algorithm (Hoskins and Hodges 2002, Hodges 1994) based on relative vorticity at 850 hPa smoothed to T42 resolution. Only those cyclones reaching their maximum relative vorticity within a specified North Atlantic domain (80 °W–40 °E and 45–75° N), lasting for at least two days and travelling further than 1000 km were retained for analysis. Following Hart et al (2017), only cyclone track sections within ±42 h of the relative vorticity maximum are considered. Sting-jet precursors were diagnosed using an established method (Hart et al 2017, Martínez-Alvarado et al 2012, Martínez-Alvarado et al 2013) which assumes that the release of a particular type of convective atmospheric instability, conditional symmetric instability, generates or strengthens sting jets (Gray et al 2011). Specifically, the diagnostic uses midtropospheric atmospheric instability to slantwise descent diagnosed using downdraught slantwise convective available potential energy (DSCAPE, as described by Emanuel (1994)). To satisfy the diagnostic, cyclones must have a sufficiently large contiguous region of DSCAPE exceeding 200 J kg−1 in their cloud head. Identification of the cloud head and the definition of sufficient DSCAPE are threshold dependent, but previous work has demonstrated skill in identification of cyclones that indeed generated sting jets in sting-jet-resolving weather forecasts (Martínez-Alvarado et al 2012).
The required model fields from the climate integrations (potential temperature, specific humidity, and the eastward and northward wind components) were interpolated onto the same pressure levels as those in ERA-Interim from 1000–100 hPa (with a 25 hPa spacing, except for the interval 750–250 hPa, where the spacing was 50 hPa). These fields (with the addition of mean sea level pressure) were also interpolated onto a 30° × 30° rotated-grid domain centred around each cyclone centre at each available time step and with a grid spacing of 0.5° in both directions. The calculation of DSCAPE requires the calculation of absolute momentum components (M, N). The rotated-grid domain greatly simplifies this computation by allowing the use of an f-plane approximation, instead of the more complex form in spherical coordinates (Shutts 1990). Under the f-plane approximation the absolute momentum components are given by (M = fx + v, N = fy − u), where f is the Coriolis parameter, x and y are the eastward and northward horizontal Cartesian coordinates, and u and v are the eastward and northward velocity components on the rotated grid. In our calculations, f = 2Ω sinϕc, where Ω is the Earth's rotation rate and ϕc is the latitude of the cyclone's centre on the non-rotated geographical coordinates at each time step.
The horizontal resolution of the spectral model used to generate ERA-Interim is T255, equivalent to about 80 km grid spacing and so slightly coarser than that of the interpolation domain. Consequently, the threshold number of contiguous horizontal grid cells with sufficient DSCAPE in the cloud head was increased to retain the same region size from the eight used previously by Hart et al (2017) to 24: the number of cyclones diagnosed with the sting-jet precursor is relatively insensitive to this threshold, for example varying between 35% when using 20 points and 30% when using 26 points for the present-day climate. The close correspondence between the proportion of cyclones diagnosed with the precursor in the previously-published results from the reanalysis and in the present-day climate integration here supports this logical adjustment.
2.3. Wind risk assessment
Wind risk is calculated as the number of storm wind footprints per year with 850 hPa resolved windspeeds exceeding the required threshold that pass over the specified region. The 850 hPa windspeed can be considered as a realistic, though approximate, estimate of the most damaging gusts at the surface as explained in section 2 d of Hart et al (2017). Each storm footprint is calculated from the maximum windspeed at each grid point within a composite region formed by 1000 km radius circles centred on the cyclone's mean sea level pressure minimum throughout the considered part of the cyclone's life cycle. Note that this is a different definition to that used previously (Hart et al 2017) (the average number of times each grid point in the region has a windspeed exceeding the threshold from a storm wind footprint). The regions used to assess wind risk also differ and so the results that will be shown here are not directly comparable with those shown in that paper. Wind risk was also calculated using the method used here for the ERA-Interim data for comparison (see figure S1 of the supplementary material available at stacks.iop.org/ERL/13/044002/mmedia).
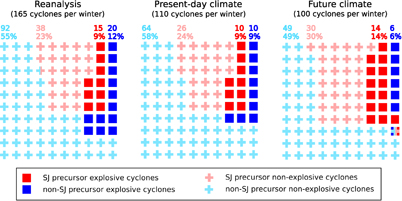
Figure 1. Infographic illustrating the number per winter season and percentage of all identified cyclones (upper and lower values respectively, rounded to the nearest unit) categorised by type of development (explosive or non-explosive) and presence or absence of sting-jet precursor. A mixed symbol is used to represent the dominant types of cyclones where the rounded percentages do not add to 100%. The total number of cyclones analysed from the reanalysis data, present-day and future climate integrations are 5447 (over 33 years), and 1432 and 1299 (over 13 years), respectively. The results for the reanalysis are taken from previously-published work (Hart et al 2017).
Download figure:
Standard image High-resolution imageTable 1. Distinctiveness of distribution pairs determined using a two-sample Kolmogorov-Smirnov test. The distributions compared are those plotted in figure 2. Given are common descriptors of the two distributions being compared, the field of the distributions, the distinct descriptors of the two distributions, the statistic (KS) and its sample-size-dependent threshold for significance (KSthres) from the Kolmogorov-Smirnov test (both to two decimal places), and the p-value (to three decimal places). To reject the null hypothesis that the distributions are equal, the p-value must be less than 0.01 (significant to the 1% level) and the KS value must exceed KSthres (rows that do not meet these conditions are indicated).
| Common descriptors | Field | Distinct descriptors | KSthres | KS | p-value | |
|---|---|---|---|---|---|---|
| All cyclones | Present-day | Δmslp | SJ vs. non-SJ precursor | 0.09 | 0.24 | <0.01 |
| All cyclones | Future | Δmslp | SJ vs. non-SJ precursor | 0.09 | 0.31 | <0.01 |
| All cyclones | non-SJ precursor | Δmslp | Present-day vs. Future | 0.08 | 0.09 | <0.01 |
| All cyclones | SJ precursor | Δmslp | Present-day vs. Future | 0.10 | 0.06 | 0.38 |
| All cyclones | Present-day | Umax | SJ vs. non-SJ precursor | 0.09 | 0.28 | <0.01 |
| All cyclones | Future | Umax | SJ vs. non-SJ precursor | 0.09 | 0.38 | <0.01 |
| All cyclones | non-SJ precursor | Umax | Present-day vs. Future | 0.08 | 0.10 | <0.01 |
| All cyclones | SJ precursor | Umax | Present-day vs. Future | 0.10 | 0.04 | 0.86 |
| Explosive cyclones | Present-day | Umax | SJ vs. non-SJ precursor | 0.20 | 0.23 | <0.01 |
| Explosive cyclones | Future | Umax | SJ vs. non-SJ precursor | 0.22 | 0.28 | <0.01 |
| Explosive cyclones | non-SJ precursor | Umax | Present-day vs. Future | 0.23 | 0.20 | 0.03 |
| Explosive cyclones | SJ precursor | Umax | Present-day vs. Future | 0.19 | 0.13 | 0.17 |
3. Results
3.1. Increased potential for sting-jet development
Results from the climate model integrations are compared to previously published results (Hart et al 2017) from 33 years (September 1979–May 2012) of the ERA-Interim reanalysis. Following Hart et al (2017), tracked cyclones are categorised as developing explosively (deepening by more than 20 sin ϕ/sin(60°) hPa in 24 h, where ϕ represents latitude) or non-explosively and having, or not having, a sting-jet precursor. The categorisation of the cyclones in the 13 year present-day and future-climate integrations is compared to that found for cyclones in the 33 year reanalysis data (Hart et al 2017) in figure 1. Fewer cyclones are found in the North Atlantic domain (see section 2.2 for domain) in both climate integrations than in the reanalysis (the 5447 cyclones over 33 winter seasons of the reanalysis data correspond proportionally to 2145 cyclones over the 13 years of the climate integrations, but there are 1432 and 1299 cyclones for the present-day and future climate, respectively). By contrast, the percentages of the categorisation of the cyclones in the reanalysis and present-day climate integration are very similar with 32% and 33%, respectively, of cyclones containing sting-jet precursors and 9% (both datasets) of cyclones developing explosively and having sting-jet precursors. In contrast, in the future-climate integration 45% of cyclones contain sting-jet precursors and 14% develop explosively and have sting-jet precursors. Thus, the proportion of cyclones likely to yield the greatest wind risk (explosively-deepening cyclones with sting-jet precursors) increases by about 60%. These changes may arise from increased levels of moisture in a warmer environment, enhancing the type of moist mesoscale instabilities that lead to the occurrence of sting jets. However, further work would be required to confirm this hypothesis. The IPCC currently concludes that there is low confidence in projected climate changes in the North Atlantic storm track (Collins et al 2013); however, the reduction in the number of cyclones found here in the future compared to present-day climate is consistent with the generally reduced cyclone frequency predicted over most of the North Atlantic.
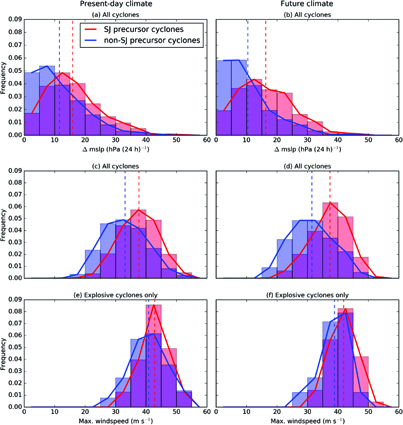
Figure 2. Normalised frequency distributions of cyclone intensity metrics for cyclones with (red) and without (blue) the sting-jet (SJ) precursor. (a) and (b) Distribution of the magnitude of the maximum drop in minimum mean sea level pressure for all cyclones. (c) and (d) Distribution of the maximum 850 hPa resolved windspeed within 1000 km of the cyclone centre. (e) and (f) As for (c) and (d) but for explosively-developing cyclones only. (a), (c) and (e) Present-day climate and (b), (d) and (f) future climate. Area under the normalised distributions integrates to 1 and the vertical dashed lines are the means of the distributions.
Download figure:
Standard image High-resolution image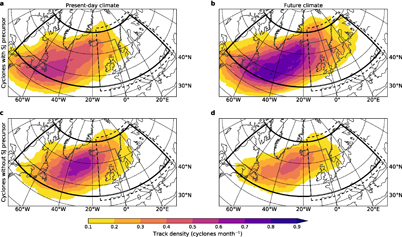
Figure 3. Track density of explosively-developing extra-tropical cyclones, defined as number density per month in a unit area equivalent to a 5° spherical cap (approximately 106 km2) with cyclones counted only once per spherical cap. (a) and (b) cyclones with and (c) and (d) without sting-jet precursors, (a) and (c) present-day climate and (b) and (d) future climate. The region in which cyclones must reach their vorticity maxima to be included in the count of cyclones is delimited by bold solid lines. The British Isles (15° W–5 °E, 45–65°N) and Northern Europe (15°W–42 °E, 43–72 °N) regions overwhich wind risk is calculated are delimited by thin solid lines and dashed lines, respectively.
Download figure:
Standard image High-resolution image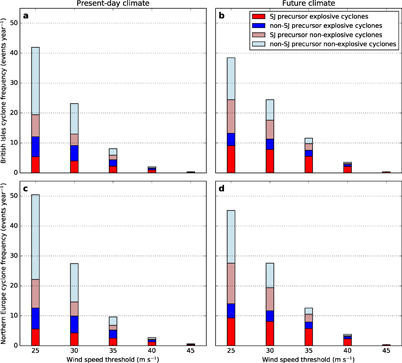
Figure 4. (a) and (b) Frequency (events per year) of strong resolved-wind events in storms with (red shading) and without (blue shading) sting-jet precursors averaged over the British Isles region (marked in figure 3) for resolved windspeed thresholds from 25–45 m s−1 (increment 5 m s−1). Distinction is made between storms that did (dark shading) and did not (light shading) develop explosively. (c) and (d) As for (a) and (b) but for the Northern Europe region. (a) and (c) is for the present-day climate and (b) and (d) is for the future climate.
Download figure:
Standard image High-resolution image
3.2. Cyclone intensity metrics
Frequency distributions of cyclone deepening rate (maximum mean sea level pressure fall over 24 h) for cyclones with and without the sting-jet precursor are significantly different in both the present-day and future climate integrations with cyclones with the precursor being more likely to deepen explosively (see figures 2(a) and (b) and table 1 for associated statistical analysis comparing all distributions, consistent with the categorisation in figure 1). The two frequency distributions are here determined to be different using a two-sample Kolmogorov-Smirnov test significant to the 1% level. This significant difference between cyclones with and without the sting-jet precursor was also found for reanalysis data (see figure 3(a) in Hart et al (2017)). However, cyclone deepening rates do not change in the future climate for cyclones with the sting-jet precursor (the frequency distributions are not significantly different comparing cyclones in the present-day and future climate integrations). For the cyclones without the sting-jet precursor the distributions for present-day and future climates are significantly different, though this result is borderline as one of the two criteria for significance is only just met (see table 1). The slight (but not significant) increase in the percentage of explosively-developing cyclones found here (figure 1 and table 1) is consistent with other findings that the occurrence of strong storms may increase in localised regions near the end of the North Atlantic storm track (Pinto et al 2007, Ulbrich et al 2009, Zappa et al 2013), though these papers did not directly consider deepening rate.
A comparison between the windspeed distribution for all cyclones (figures 2(c) and (e)) and that for explosively-developing cyclones (figures 2(d) and (f)) shows that explosively-deepening cyclones are associated with significantly stronger low-level maximum resolved windspeeds than the full population of cyclones in both the present-day and future climate integrations. Hence, we focus on explosively-deepening cyclones (often called windstorms) due to their likely greater wind risk. Amongst these cyclones, those with the sting-jet precursor have significantly stronger maximum resolved windspeeds than those without this precursor in both the present-day and future climate integrations (figures 2(e) and (f)). Similar to the cyclone deepening results, the maximum windspeed distributions do not significantly change between the present-day and future climate integrations for cyclones with the sting-jet precursor (considering either all cyclones or only those deepening explosively), but the distributions are borderline for the cyclones without the sting-jet precursor (significantly different when considering all cyclones, but not significantly different when considering only those deepening explosively).
The sting-jet precursor diagnostic identifies cyclones that have mesoscale instability that is unlikely to be released realistically in models used to generate reanalyses and climate integrations. Despite this, the diagnostic identifies cyclones that are more likely to develop explosively and have stronger windspeeds. As discussed previously (Hart et al 2017), this is likely a consequence of the precursor identifying cyclones with well-developed cloud heads (an indicator of rapidly developing cyclones) and strong diabatic processes (also associated with enhancement of the synoptic-scale low-level cold conveyor belt jet leading to strong resolved winds in the southwest quadrant of the cyclone). The precursor may also identify those cyclones most likely to have a resolved weak sting-jet feature that could, in a higher resolution simulation or reality, be enhanced by the release of mesoscale instability.
3.3. Cyclone track density
Cyclone track density maps for explosively-deepening cyclones in the present-day climate integration are spatially-consistent with those derived from reanalysis data, although the magnitudes are lower due to the reduced cyclone frequency (compare figures 3(a) and (b) here with figures 4(b) and (c) of Hart et al (2017)). Cyclones with the sting-jet precursor occur most frequently in the southwest of the North Atlantic, near to Newfoundland, Canada. In contrast, those without the precursor occur most frequently in the central North Atlantic, to the south of Greenland. The preferentially southerly location and more zonal storm track for explosively-deepening cyclones with precursors is consistent with moist instabilities (such as that required by the precursor diagnostic) being associated with warm moist air masses. The storm tracks for the cyclones in the future climate integration are spatially similar to those for the present-day climate integration (compare figures 3(a)–(d)). However, cyclones are far more likely to have a precursor in the future climate (figure 1) and the storm track for these cyclones now extends to Iceland with high track density values; the lightest shading (up to 0.2 cyclones month−1) extends into northern Europe including Scandinavia. This is in agreement with an increased latitudinal displacement of extra-tropical cyclone tracks in the North Atlantic in a warmer climate (Tamarin-Brodsky and Kaspi 2017).
3.4. Wind risk assessment
In this section we assess the implications of our results for wind risk. We focus on two regions (marked on figure 3): the British Isles and a much larger region that includes the British Isles. The latter has been labelled Northern Europe, although it does include parts of Spain and Italy. The average number of cyclones per year crossing each region is presented in figure 4 for maximum resolved windspeed thresholds from 25–45 m s−1, differentiated into the four categories used in figure 1. The number of storms for the 25 m s−1 threshold scales according to the difference in number of cyclones between the reanalysis and the present-day climate simulation (compare figure 4 with figure S1 of the supplementary material), i.e. our estimate of wind risk is lower than in the reanalysis for the present climate. As implied by figure 3, the vast majority of the events crossing the Northern Europe region are those that also cross the British Isles region (in both the present-day and future climate): the resolved-wind risk from synoptic-scale low-level wind jets in extra-tropical cyclones is far greater over the British Isles than for the rest of Europe. The contribution of explosively-deepening cyclones, and in particular explosively-deepening cyclones with a sting-jet precursor, increases with windspeed threshold for both regions and for both the present-day and future climate integrations. More than 40% of events with maximum resolved windspeeds of at least 40 m s−1 are explosively-deepening cyclones with a sting-jet precursor over both regions in the present-day climate integration. The resolved-wind risk from cyclones increases in the future climate (particularly for wind thresholds of at least 35 m s−1); most of this increase is attributable to explosively-deepening cyclones with a sting-jet precursor. The number of this type of event crossing the British Isles with resolved windspeeds exceeding 35 m s−1 increases from 2.2 storms per year to 5.3 storms per year, equivalent to a 140% increase.
4. Conclusion
Application of an established diagnostic for sting-jet precursors to tracked cyclones in present-day and future (~2100 under the most extreme climate change scenario, RCP8.5) climate integrations reveals an increase in the proportion of North Atlantic cyclones with sting-jet precursors. In particular, while the proportion of explosively-developing cyclones is not significantly different, the proportion of explosively-developing cyclones with precursors increases by about 60%. Furthermore, it was found that cyclones with the sting-jet precursor were more likely to deepen explosively in both the present-day and future climate integrations. The storm track for explosively-developing cyclones with precursors extends closer to Europe in the future climate integration with a consequent increase in the risk of strong winds over Europe. The annual number of events crossing the British Isles with resolved 850 hPa windspeeds (a proxy for surface wind gusts) exceeding 35 m s−1 more than doubles. This assessment of surface wind impact is conservative: in a higher resolution simulation, or reality, the mesoscale moist instability diagnosed by the precursor diagnostic is likely to be released, generating a sting jet or enhancing a weak existing sting jet and thus enhancing the associated wind risk. These results are based on one climate model due to the data and processing requirements of the precursor diagnostic; hence we cannot assess modelling uncertainty, although this would be a useful extension of this work if suitable climate output can be identified. However, an enhancement of the diabatic contribution to cyclone development and related enhancement of moist mesoscale instability in these cyclones are plausible in a warmer moister environment. The consequent effect on the wind risk for Europe is also dependent on changes to the North Atlantic storm track location and density. These changes are uncertain (Harvey et al 2012). However, these results are one plausible realisation of how the Northern European wind risk due to extreme extra-tropical cyclones will evolve.
Acknowledgments
Part of the data processing was performed using the JASMIN facility funded by the United Kingdom's Natural Environment Research Council and the United Kingdom's Space Agency. The authors thank two anonymous reviewers for useful comments to an earlier version of the paper. The analysis performed here was funded by the AXA-research fund project 'Sting jet windstorms in current and future climates'. M J R was supported by the Joint UK BEIS/Defra Met Office Hadley Centre Climate Programme (GA01101). The funding details for the climate integrations used are detailed in the acknowledgements section of Kendon et al (2014).