

Abstract
The response of the Arctic stratosphere to El Niño activity is strong but the response to La Niña activity is relatively weak. The asymmetric responses of Arctic stratosphere to El Niño and La Niña events are thought to be caused by asymmetric El Niño–Southern Oscillation (ENSO) teleconnections. Here, we suggest that the background sea surface temperature (SST) over cold tongue of tropical eastern Pacific may be an important contributor to the asymmetric ENSO teleconnections. The atmosphere is very sensitive to tropical SST variations in the range of 26 °C–30 °C. During El Niño events, the background SST over cold tongue plus El Niño SST anomalies typically falls into the range. Under these conditions, the atmospheric response to El Niño SST anomalies is strong. During La Niña events, the background SST plus La Niña SST anomalies is typically below the range, which leads to a weak response of the atmosphere to SST anomalies. The proposed mechanism is well supported by simulations.
Export citation and abstract BibTeX RIS

Original content from this work may be used under the terms of the Creative Commons Attribution 3.0 licence. Any further distribution of this work must maintain attribution to the author(s) and the title of the work, journal citation and DOI.
1. Introduction
Stratospheric circulation can influence the chemical composition of the stratosphere, and its anomalies may also propagate downward to affect tropospheric weather and climate (Baldwin and Dunkerton 2001, Graf and Walter 2005, Scaife et al 2005, Sigmond et al 2008, Cagnazzo and Manzini 2009, Ineson and Scaife 2009, Reichler et al 2012, Gerber and Son 2014, Kidston et al 2015, Zhang et al 2016) by the downward control principle (Haynes et al 1991) and tropospheric eddy momentum feedback (Kidston et al 2015). El Niño–Southern Oscillation (ENSO) is one of the main processes controlling the interannual variations in stratospheric circulation and temperature, and has been found to influence both tropical and extratropical stratospheric circulation. Tropical upwelling is enhanced during El Niño events, which results in an upper tropospheric warming and lower stratospheric cooling in the tropics (Garcia-Herrera et al 2006, Cagnazzo et al 2009, Free and Seidel 2009, Randel et al 2009, Calvo et al 2010, Wang and Waugh 2012, 2015), along with coherent tropical ozone and water vapor variations (Gettelman et al 2001, Geller et al 2002, Hatsushika and Yamazaki 2003, Scaife et al 2003, Fueglistaler and Haynes 2005, Xie et al 2012). The vertical propagation of wave 1 is enhanced and wave 2 is weakened in the Northern Hemisphere (NH) caused by El Niño activity, owing to the deepening of the Aleutian Low in the Pacific North American (PNA) pattern (e.g. Garcia-Herrera et al 2006, Frauen et al 2014, Yeh et al 2014, 2018). The dissipation of more waves in the stratosphere of the NH middle and high latitudes results in anomalous warming in the Arctic stratosphere, which is observed (Vanloon and Labitzke 1987, Camp and Tung 2007, Wei et al 2007, Garfinkel and Hartmann 2007, 2008, Free and Seidel 2009, Ren et al 2012) and reproduced in numerical simulations (Hamilton 1995, Sassi et al 2004, Garcia-Herrera et al 2006, Manzini et al 2006, Taguchi and Hartmann 2006, Xie et al 2012, Garfinkel et al 2013a, 2013b, Rao and Ren 2016).
In recent decades, the pattern of El Niño sea surface temperature (SST) anomalies has changed from its well known historical form, the eastern Pacific (EP) type, to a new form, the central Pacific (CP) type (Ashok and Yamagata 2009, Yeh et al 2009). The climatic influences of the CP El Niño are different from those of the EP El Niño for stratospheric circulation, temperature, and ozone (Hegyi and Deng 2011, Hurwitz et al 2011a, 2011b, Zubiaurre and Calvo 2012, Sung et al 2014, Xie et al 2012, 2014a, 2014b), because of the different spatial patterns of SST anomalies. However, apparently contradictory results have been reported (Graf and Zanchettin 2012, Hurwitz et al 2014). Garfinkel et al (2013a, 2013b) showed that results are sensitive to the size of the composite and the index used. Furthermore, Iza and Calvo (2015) demonstrated that when winters without sudden stratospheric warming are considered, a robust signal of the CP El Niño is found, which is distinguishable from that of the EP type.
Recently, extreme El Niño events have been projected to occur with higher frequency in the future because of global warming (Cai et al 2014, Wang et al 2017). Rao and Ren (2016) noted a nonlinearity of the impact on the northern winter stratosphere from El Niño events of different intensity. Unprecedented variations in the stratosphere caused by extreme El Niño events have been observed (Christiansen et al 2016, Dunkerton 2016, Avery et al 2017, Palmeiro et al 2017). However, Richter et al (2015) found a more linear stratospheric signal results from El Niño intensity variation in numerical simulations. In addition, Zhou et al (2018) showed that the patterns of circulation and temperature for late winter/early spring during extreme and moderate El Niño events are significant and exhibit similar structures.
In summary, the strong effect of El Niño activity on the Arctic stratosphere has been investigated and confirmed by many studies. However, the influence of La Niña activity on the Arctic stratosphere is relatively weak (Sassi et al 2004, Garcia-Herrera et al 2006, Manzini et al 2006, Taguchi and Hartmann 2006) and shows an asymmetric response compared with that from El Niño activity (Hoering et al 1997). Specifically, El Niño activity leads to a remarkable warm Arctic stratosphere whereas La Niña activity leads to a relatively weak cooling of the Arctic stratosphere. The asymmetric ENSO teleconnections during El Niño and La Niña events are thought to cause the asymmetric response (Garcia-Herrera et al 2006, Manzini et al 2006, Brönnimann 2007, Camp and Tung 2007, Garfinkel and Hartmann 2007, 2008). However, the cause of the asymmetric ENSO teleconnections remains a controversial issue and is the focus of this work. Understanding the mechanism that leads to a weaker stratospheric response to La Niña than to El Niño may contribute to a deeper understanding of the effects of ENSO on the stratosphere, thus helping to understand future variations in stratospheric circulation.
2. Data and methods
The monthly mean European Center for Medium Range Weather Forecasting reanalysis data (ERA-Interim) from 1979–2016 were analyzed mainly for temperatures and circulation. The ERA-Interim data assimilates new model outputs and satellite observations, and provides data at horizontal resolutions of 1.5° × 1.5° and relatively high vertical resolutions (Simmons et al 2007, Uppala et al 2008). The NCEP-DOE Reanalysis 2 (NCEP2) project is using a state-of-the-art analysis/forecast system to perform data assimilation using past data from 1979 through the previous year. NCEP2 (horizontal resolutions of 2.5° × 2.5°) is an improved version of the NCEP Reanalysis I model that fixed errors and updated paramterizations of physical processes. The outgoing longwave radiation (OLR) data from 1979–2016 were obtained from http://cdc.noaa.gov/. The SST data were obtained from the UK Met Office Hadley Centre for Climate Prediction and Research SST (HadSST) field dataset.
The monthly ENSO index is used to identify monthly occurrences of ENSO events, respectively. ENSO index is defined as the area mean SSTA over the region 5°S–5°N, 150°–90°W, and is available at http://cpc.noaa.gov/data/indices/. The ENSO events are defined as having the corresponding ENSO index values equal to or greater (less) than +1 °C (−1 °C) and for a period of ≥6 months. Strong ENSO events of long duration are now listed in table 1. Composite anomalies of SST during El Niño events and La Niña events are shown in figure 1. The quasi-biennial oscillation (QBO) index used is the zonal mean, 10°S–10°N area averaged zonal wind at 50 hPa.
Table 1. Lists of the El Niño (left column) and La Niña (right column) events from 1979–2016 analyzed in this study.
| El Niño Events | La Niña Events |
|---|---|
| 08/1982-05/1983 | 06/1988-03/1989 |
| 11/1986-12/1987 | 08/1998-03/2000 |
| 11/1991-05/1992 | 09/2007-03/2008 |
| 06/1997-04/1998 | 07/2010-12/2011 |
| 05/2015-04/2016 |
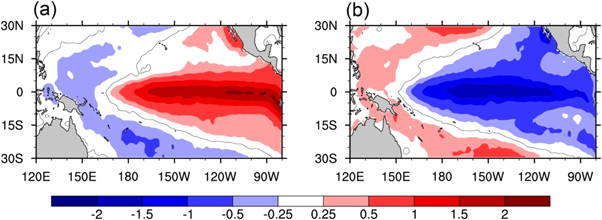
Figure 1. Composite anomalies of SST (units: °C) during El Niño events (a) and La Niña events (b); SST values are based on HadSST for 1979–2016. For the definition of ENSO events, see section 2.
Download figure:
Standard image High-resolution imageThe time-slice simulations preformed in this study derived from the Whole Atmosphere Community Climate Model, version 4 (WACCM4 be included in the CESM1.0.6). The WACCM, developed by the National Center for Atmospheric Research (NCAR), is unable to internally simulate QBO signals but forced by zonal wind of QBO signals; however, it can rationally simulate atmospheric ENSO signals (Garcia et al 2007). WACCM4 has 66 vertical levels extending from the ground to 4.5 × 10⁻⁶ hPa (∼145 km geometric altitude), and the model's vertical resolution is 1.1–1.4 km in the tropical tropopause layer and the lower stratosphere (<30 km). The time-slice simulations presented in this paper were performed at a resolution of 1.9° × 2.5°, with interactive chemistry. The designs and goals of experiments please refer to table 2.
Table 2. Description of the WACCM4 experiments.
| Experimenta | Details |
|---|---|
| R1 (control run) | Observed SST data from the SST and sea-ice field datasets of the Meteorological Office, Hadley Centre for Climate Prediction and Research (Rayner et al 2003), are averaged over the period 1979–2016. QBO phase signals for 28 months (fixed circle) were included in WACCM4 as an external forcing of zonal wind. Monthly mean climatologies of surface emissions used in the model were obtained from the A1B emissions scenario developed by the Intergovernmental Panel on Climate Change (IPCC), averaged over the period 1979–2016 |
| R2 | As for R1, but with El Niño SST anomaliesb added to the SST forcing in all 12 months of the year |
| R3 | As for R1, but with La Niña SST anomaliesc added to the SST forcing in all 12 months of the year |
| R4 | As for R1, but without QBO forcing |
| R5 | As for R4, but with El Niño SST anomaliesb added to the SST forcing in all 12 months of the year |
| R6 | As for R4, but with La Niña SST anomaliesc added to the SST forcing in all 12 months of the year |
| R7 | As for R1, but with SST in the regions 15°S–15°N and 180°W–60°W fixed at 28 °C year-roundd, and 9-point smoothing applied near the boundary of the region |
| R8 | As for R7, but with El Niño SST anomaliesb added to the SST forcing in all 12 months of the year |
| R9 | As for R7, but with La Niña SST anomaliesc added to the SST forcing in all 12 months of the year |
| R10 | As for R7, but without QBO forcing |
| R11 | As for R10, but with El Niño SST anomaliesb added to the SST forcing in all 12 months of the year |
| R12 | As for R10, but with La Niña SST anomaliesc added to the SST forcing in all 12 months of the year |
aExperiments were performed for a period of 43 years, with the first three years excluded for model spin-up. Only the remaining 40 years were used for the analysis. bThe El Niño SST anomalies please refer to figure 1(a). cThe La Niña SST anomalies please refer to figure 1(b). dThe SST in the regions 15°S–15°N and 180°W–60°W fixed at 28°C year-round please refer to figure S4.
3. Results
Figure 2 shows composite anomalies of the zonal mean temperature and wind for El Niño and La Niña events based on ERA-interim and NCEP2 data. Results are in agreement with previous studies in terms of a warming Arctic stratosphere (figures 2(a) and (e)) and a weakening circumpolar jet (figures 2(c) and (g)) during El Niño events (Vanloon and Labitzke 1987, Hamilton 1995, Garcia-Herrera et al 2006, Manzini et al 2006, Taguchi and Hartmann 2006, Camp and Tung 2007, Wei et al 2007, Garfinkel and Hartmann 2007, 2008, Ren et al 2012, Xie et al 2012, Garfinkel et al 2013a, 2013b, Rao and Ren 2016), and vice versa during La Niña events (figures 2(b), (d), (f) and (h)) (Sassi et al 2004, Free and Seidel 2009, Butler and Polvani 2011, Mitchell et al 2011, Iza et al 2016). However, it should be noted that the magnitude of La Niña activity influencing the Arctic stratosphere (figures 2(b), (d), (f) and (h)) is weaker than that of El Niño activity (figures 2(a), (c), (e) and (g)). Figures 3(a)–(d) shows the simulated zonal mean temperature and zonal wind anomalies in the NH caused by El Niño and La Niña events based on experiments R1–3 (table 2), supporting the results from observations (figure 2).
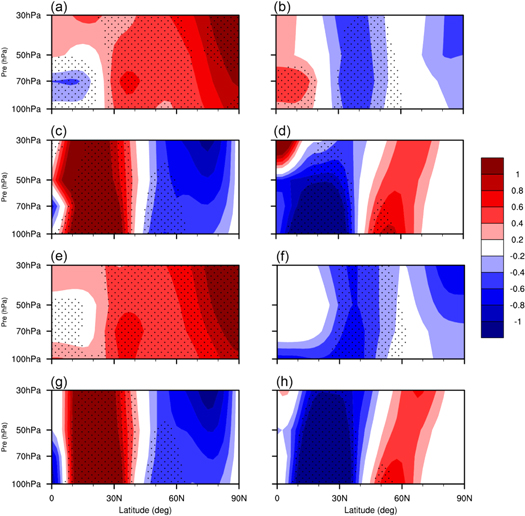
Figure 2. Composite anomalies of the zonal mean T (units: °C) (a) and U (units: m s–1) (c) for El Niño events, based on ERA-interim data for 1979–2016. (b) and (d), Same as (a) and (c), but for La Niña events. (e)–(h) Same as (a)–(d), but for NCEP2 data. The definition of ENSO events please refer to section 2. Dots denote significance at the 90% confidence level, according to Student's t-test. Before done the composite analysis, the QBO signal in the ozone has been filtered out from time series using regression. The QBO signal is removed by first regressing the stratospheric T and U onto the QBO index. Then, the QBO signal is subtracted from the original time series of stratospheric T and U. The QBO index is defined as the 10°S–10°N area averaged zonal wind at 50 hPa.
Download figure:
Standard image High-resolution image
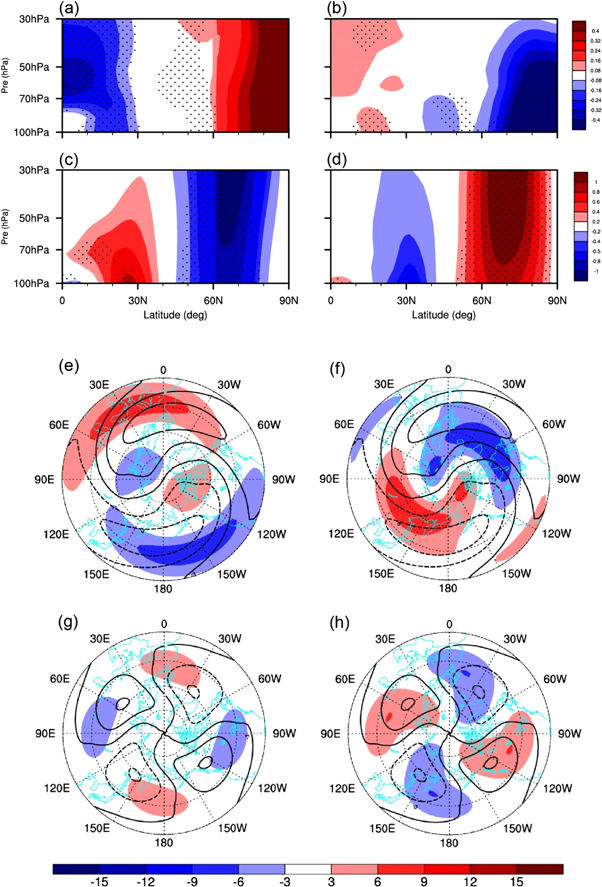
Figure 3. Differences in zonal mean T (units: °C) (a), (b) and U (units: m s–1) (c), (d) between R2 and R1 (a), (c) and between R3 and R1 (b), (d). Dots denote significance at the 95% confidence level, according to Student's t-test. Differences in geopotential height (units: gpm) associated with stationary waves of wavenumber 1 (e), (f) and 2 (g), (h) at 500 hPa in the NH between R2 and R1 (e), (g) and between R3 and R1 (f), (h). In (e)–(h), colors indicate geopotential height anomalies; contours show the climatological stationary wave field from R1.
Download figure:
Standard image High-resolution imageA deepening of the Aleutian low via the PNA pattern during El Niño events leads to extratropical tropospheric teleconnections that enhances the stationary wave 1 (figure 3(e)) and suppresses the stationary wave 2 (figure 3(g)). The enhancement of wave 1 is larger than the attenuation of wave 2, so the net effect is a weakened Arctic polar vortex. La Niña activity has opposite effects on waves 1 and 2 (figures 3(f) and (h)). The wave 1 response to La Niña events (figure 3(f)) is weaker than that to El Niño events (figure 3(e)).
The asymmetric ENSO teleconnections during El Niño and La Niña events are thought to related to the phases of QBO (Garcia-Herrera et al 2006, Manzini et al 2006, Brönnimann 2007, Camp and Tung 2007, Garfinkel and Hartmann 2007, 2008) and stratospheric sudden warming (SSW; Free and Seidel 2009). It should be noted that when QBO signals are removed by regression, as shown in figure 2, the composite anomalies of the Arctic stratosphere during La Niña events are still found to be weaker than those during El Niño events. Because statistical techniques cannot entirely remove QBO and SSW effects (figure 2), we performed experiments R4–6 (table 2), which exclude QBO forcing in simulations and do not include SSW. The weaker influence of La Niña activity on the Arctic stratosphere is still evident in figure S1 is available online at stacks.iop.org/ERL/13/114007/mmedia. This implies that QBO and SSW are not the only two factors leading to the weaker stratospheric response of La Niña activity on the Arctic stratosphere compared with that of El Niño activity, or say, the weaker stratospheric response is independent of the presence of QBO and SSW. Here, we seek to find other potential factors.
One possible reason for the weaker influence of La Niña activity on the Arctic stratosphere is that the forcing of SST anomalies during La Niña events is weaker than that during El Niño events, as previous studies have reported that El Niño and La Niña events are asymmetric (Hoerling et al 1997, Jin et al 2003); i.e. extreme El Niño events are stronger than extreme La Niña events. Figures 1(a) and (b) show the composite SST anomalies during El Niño and La Niña events from 1979–2016, respectively. The magnitudes of SST anomalies caused by La Niña events are not weaker, and can even be stronger, than those during El Niño events. This result agrees with the findings of Zhang et al (2009). Figure 1 indicates that the asymmetric response of the stratosphere to El Nino and La Nina in the NH may not depend on the magnitude of SST anomalies caused by El Nino and La Nina events. We also investigated the composite SST anomalies and asymmetric stratosphere response during El Nino and La Nina events for the period 1948–1980 and obtained similar results (not shown). It implies that the asymmetric response of the stratosphere to El Nino and La Nina does not depend on the period of analysis.
It is well known that the cold tongue in tropical EP is with a very low background SST (figure 4(a); SSTs in most regions are lower than or equal to ∼26 °C, particularly in the Southern Hemisphere). This feature persists throughout the year (figure S2). Tompkins (2001) pointed out that the sensitivity of the tropical atmosphere to SST variations increases sharply for SSTs above ∼26 °C before decreasing as SSTs exceed 30 °C, based on tropical observations. This means the tropical atmosphere is most sensitive to changes in SST for temperatures in the range 26 °C–30 °C. During El Niño events, a positive SST anomaly is added to the background SST of ∼26 °C, leading to SSTs over the tropical EP being above 26 °C (figure S3(a)). According to Tompkins (2001), the atmospheric response to El Niño SST anomalies is expected to be strong and significant. During La Niña events, negative SST anomalies correspond to SSTs below 26 °C (figure S3(b)), which in turn lead to a weak atmospheric response to SST anomalies.

Figure 4. Climatology of SST (a); differences in OLR between R2 and R1 (b) and between R3 and R1 (c); and composite anomalies of OLR (units: W m–2) during El Niño events (d) and La Niña events (e), based on NOAA's OLR data for 1979–2016. SST values are based on HadSST for 1979–2016. For the definition of ENSO events, see section 2.
Download figure:
Standard image High-resolution imageFigures 4(b) and (c) show simulated OLR anomalies in the tropical Pacific caused by El Niño and La Niña activities based on experiments R1–3. The simulated magnitude of convection activity anomalies in cold tongue during El Niño events is noticeably larger than that during La Niña events. This phenomenon is further clarified in figures 4(d) and (e), which shows the composite anomalies of OLR during El Niño and La Niña events based on observed OLR data. Note that, although the patterns of OLR anomalies from observations and simulations are similar, there are differences in the OLR anomalies in response to El Niño and La Niña between observations and simulations. The possible reasons are that the SST anomalies used to force the OLR anomalies in simulations and the SST anomalies corresponding to composite OLR anomalies from observations in each month are not exactly the same; the QBO signal also exists in the OLR variations. Linear regression cannot completely remove the QBO signal in the composite OLR anomalies from observations, whereas the QBO signal can be completely removed in the simulations. The results in figure 4 suggest that, the background SST of tropical EP may be the cause of the asymmetric atmospheric response to El Niño and La Niña activity.
New experiments were performed to evaluate above hypothesis. Experiments R7–12 are the same as R1–6 (table 2), but with background SST in regions 15°S–15°N and 180°W–60°W fixed at 28 °C (figure 5(a)). The background SST was set at 28 °C with El Niño or La Niña SST anomalies added. In this fashion, the background SST plus El Niño or La Niña SST anomalies would still be in the range (26 °C–30 °C) defined by Tompkins (2001). Figures 5(b) and (c) show the simulated OLR anomalies in the tropical Pacific caused by El Niño and La Niña events based on experiments R7–9. The magnitude of convective activity anomalies in cold tongue during La Niña events is similar to that during El Niño events. This supports the assertion that the background SST is an important factor in the atmospheric response to El Niño and La Niña events.

Figure 5. (a) Climatology of SST (units: °C) for the period 1979–2016, and differences in OLR between R8 and R7 (b) and between R9 and R7 (c). SST in the regions 15°S–15°N and 180°W–60°W is fixed at 28 °C, with a 9-point smoothing applied near the boundary of the region.
Download figure:
Standard image High-resolution imageFigure 6 shows the simulated zonal mean temperature and zonal wind anomalies in the NH caused by El Niño and La Niña events based on experiments R7–9 (table 2). As expected, Arctic stratosphere is warmer (figure 6(a)) and circulation is weaker (figure 6(c)) during El Niño events; however, the response of the Arctic stratosphere to La Niña activity is also very strong; i.e. stratospheric temperatures are noticeably lower decreased (figure 6(b)) and circulation is enhanced (figure 6(d)). Experiments R10–12 (table 2) exclude QBO forcing and do not include SSW. The strong influence of La Niña activity on the Arctic stratosphere is also well reproduced (figure S5). El Niño events excite extratropical tropospheric teleconnections that enhance the stationary wave 1 (figure 6(e)). The magnitude of anomalous wave 1 pattern during La Niña events (figure 6(f)) is comparable with that during El Niño events (figure 6(e)). Note that the responses of wave 2 during El Niño and La Niña events (figures 6(g) and (h)) are not noticeably changed. This suggests that background SST primarily affects the response of wave 1.
Figure 6. Same as figure 3, but for differences between R8 and R7 (a), (c), (e), and (g) and between R9 and R7 (b), (d), (f), and (h).
Download figure:
Standard image High-resolution image
4. Conclusions
It is well known that El Niño activity leads to a warm and weak Arctic stratosphere; however, the response of the Arctic stratosphere to La Niña activity is weak compared with that to El Niño activity. The asymmetric responses of the Arctic stratosphere are thought to be caused by asymmetric ENSO teleconnections during El Niño and La Niña events. Here, we propose the low background SST over the cold tongue of tropical EP as one of the factors causing the asymmetric atmospheric response. During El Niño events, the SST over the cold tongue is typically above 26 °C, and the atmospheric response to El Niño SST anomalies is strong. During La Niña events, the SST is typically below 26 °C, which may lead to a weak atmospheric response. Simulations were preformed to evaluate this assertion. With the background SST in regions 15°S–15°N and 180°W–60°W set to 28 °C, the simulated magnitude of convective activity anomalies in the tropical EP during La Niña events is similar to that during El Niño events. The magnitude of stationary wave 1 response during La Niña events is comparable to that during El Niño events. Under these conditions, the response of the Arctic stratosphere to La Niña activity becomes strong; i.e. stratospheric circulation is noticeably enhanced and temperatures fall.
Acknowledgments
Funding for this project was provided by the National Natural Science Foundation of China (41575039) and the SOA International Cooperation Program on Global Change and Air–Sea Interactions (GASI-IPOVAI-03). We acknowledge Meteorological fields from ERA-interim and NCEP2, OLR from NOAA, SST from the UK Met Office Hadley Centre for Climate Prediction and Research, and WACCM4 from NCAR.