

Abstract
Mountain forests provide the main water resources and lumber for Northwest China. The understanding of the differences in forests growing among individual slope aspects in mountainous regions is of great significance to the wise management and planning of these natural systems. The aim of this study was to investigate the impacts of slope aspect on forest dynamic succession in Northwest China by using the dynamic forest succession model (FAREAST).
First, the simulated forest composition and vertical forest zonation produced by the model were compared against recorded data in three sub-regions of the Altai Mountains. The FAREAST model accurately reproduced the vertical zonation, forest composition, growth curves of the dominant species (Larix sibirica), and forest biomass in the Altai Mountains. Transitions along the forest zones of the Altai Mountains averaged about a 400 m difference between the northern and southern sites. Biomass for forests on north-facing slopes were 11.0, 15.3 and 55.9 t C ha−1 higher than for south-facing slopes in the Northeast, Central and Southeast sub-regions, respectively.
Second, our analyses showed that the FAREAST model can be used to predict dynamic forest succession in Northwest China under the influence of slope and aspect. In the Altai Mountains, the north-facing slopes supported the best forest growth, followed by the west- and east-facing slopes. South-facing slopes consistently exhibited the lowest growth, biomass storage and forest diversity.
Export citation and abstract BibTeX RIS

Original content from this work may be used under the terms of the Creative Commons Attribution 3.0 licence.
Any further distribution of this work must maintain attribution to the author(s) and the title of the work, journal citation and DOI.
1. Introduction
In the Northern Hemisphere, south-facing slopes receive much more solar radiation than the other aspects (Holland and Steyn 1975) and are relatively warmer and drier, causing differences in growth and forest composition (Cantlon 1953, Rydgren et al 2003, Bennie et al 2008, Saremi et al 2014). Bale et al (1998) surveyed seven forest sample plots in New South Wales, Australia, and found significant differences in canopy height as a function of aspect. A recent comparison of forest inventory data from North China showed that north-facing slopes supported higher forest growing stock, diversity and forest vertical distribution than the other facing slopes (Yang et al 2006). Such quantification of forest characteristics on different slope aspects on a regional or national scale could provide a scientific foundation for evaluating vegetation patterns and defining management options for forests in mountainous areas (Urban et al 1991, Urban and Shugart 1992, Urban et al 1993, Bale and Charley 1994, Saremi et al 2014).
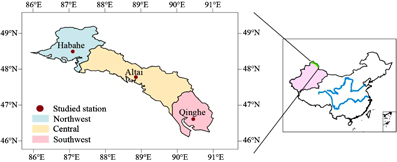
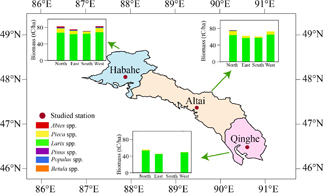
Figure 1. The location of the three sub-regions in the Altai Mountains in China.
Download figure:
Standard image High-resolution imageWhile measurement-based sample-plots and remote-sensing databases both offer the potential for investigating forest growth on different aspects (Bale et al 1998, Badano et al 2005, Yang et al 2006, Saremi et al 2014, Maren et al 2015), it often proves difficult to examine this on a regional scale due to the high spatial variability of extrapolated forest inventory data and the high regional uncertainty of inverse satellite-based products (Piao et al 2004). Ecological models, notably individual-based models (IBMs), are efficient tools for examining forest growth in complex natural forests (Shugart 1984, Shugart et al 1992a, 1992b). With the significant exception of Bugmann's studies (1994, 1996, and subsequent papers) in the Swiss Alps, ecological models have not been widely applied in studies intended to evaluate slope aspect effects. This is principally because the forcing climate data required for these ecological models are difficult to collect among individual aspects in mountainous areas.
For this reason, Running et al (1987) constructed the mountain microclimate simulation model (MTCLIM) to extrapolate routine meteorological data to adjacent mountainous terrain. By combining MTCLIM with a process-based model DAYSTRANS/PSN (Running 1984a, 1984b, Running et al 1987), Running and his colleagues successfully investigated the impacts of aspects on seasonal photosynthesis in coniferous forests in Montana. Although previous model studies evaluated the slope aspect effects on physiological and biochemical processes, few models have been used to investigate aspect effects on forest dynamic succession, forest vertical zonation, biomass and forest composition.
FAREAST (Yan and Shugart 2005), an individual-based forest gap model, was developed from the NEWCOP model (Yan and Zhao 1996) to estimate forest dynamic succession in middle-high latitudes in the Northern Hemisphere. This model has been applied to investigate species composition and forest biomass in Northeast China (Yan and Shugart 2005), Southwest China (Huo et al 2010), and the Russian Far East (Shuman and Shugart 2009, Zhang et al 2009, Shuman et al 2011). In this study, we test how well the FAREAST model captures forest composition, along with the vertical zonation and slope aspect of composition and biomass in Northwest China (the Altai Mountains). Our goals are to (1) examine the FAREAST model's performance across forests in Northwest China for the first time, and (2) combine the FAREAST with MTCLIM models to estimate the impacts of aspect on forests in Altai Mountains, such as forest vertical distribution, composition (shade-intolerant and shade-tolerant species), forest biomass and growth curve of the dominant species (Larix sibirica). One might expect the FAREAST model, which computes solar radiation levels through the forest canopy, to show differences in species replacement patterns and composition on different slope aspects. This consideration generates an interest in understanding the proportions of shade-tolerant versus shade-intolerant trees in different sites.
2. Data and methods
2.1. Study area
The Altai Mountains are located at the junction of China, Mongolia and Russia with an area of 1.15 million ha. They run from northwest to southeast (45°59'-49°10'N, 85°31'-91°01'E), and cover the Habahe, Buerjin, Altai, Fuhai, Fuyun and Qinghe counties in Northwest China (figure 1, table 1). The Altai Mountains are affected by humid air masses from the Arctic and the Atlantic Oceans; water vapor is initially transferred to the northwest through the Irtysh River Valley, and this effect gradually weakens as the latitude decreases. Therefore, the southeastern parts of the mountain region are much drier and warmer than the other parts. Further, the forest diversity decreases with the decreasing latitude. Larix spp., Picea spp., Abies spp. and Pinus spp. are the dominant genera in the northwest of the Altai Mountains, while Larix spp. is the only dominant genus in the southeast (table 1). Based on the climate and forest species diversity, previous studies have divided the Altai Mountain forests into three sub-regions: Northwest, Central and Southeast (Survey and Planning Institute of the China Forestry Administration 1981)
Table 1. The climate and forest composition in three sub-regionsa.
| Sub-region | Counties | Studied station | Climate | Precipitation in forest (mm yr−1) | Dominant forest genera |
|---|---|---|---|---|---|
| Northwest | Habahe Buerjin | Habahe | cool, wet | 500–700 | Larix spp., Picea spp., a small number of Abies spp. and Pinus spp. |
| Central | Fuyun Altai Fuhai | Altai | mild, humid | 400–600 | Larix spp., Picea spp. |
| Southeast | Qinghe | Qinghe | warm, drought | 300–500 | Larix spp. and rarely Picea spp. |
aAll of the records were derived from the Survey and Planning Institute of China Forestry Administration (1981).
2.2. FAREAST model
Similar to most forest gap models, the FAREAST model simulates the growth, regeneration and mortality of individual trees on 200 independent plots, each with a plot area of ~600 m2 (Yan and Shugart 2005). Driven by environmental conditions, the stochastic processes used in the FAREAST model simulate the birth and death of trees on a circular plot. Climate forcing data (i.e. monthly maximum and minimum air temperature, precipitation) and soil parameters (i.e. field water-holding capacity, soil carbon and nitrogen pools) need to be used to drive the model. The biological responses to environmental conditions determine the birth, growth and eventual death of the individual trees. In response to the changing bio-environment, soil conditions, such as the field capacity, soil carbon and nitrogen in the top two soil layers (surface soil and subsoil) are updated annually.
The GROWTH, REGENERATION and MORTALITY sub-models of the FAREAST model determine the life cycle of each tree in a plot. The growth of each tree is reflected by the diameter at breast height (DBH), which is updated annually by the GROWTH sub-model and is based on environmental conditions (temperature and precipitation). The ability of a tree to compete for light determines the species abundance and the light that is available to each tree, and is dependent on the tree's biological parameters (Bugmann 1994, 1996). The MORTALITY sub-model simulates individual tree mortality according to the probability of a tree reaching its maximum life span. Similar to other gap models, the death probability of slow-growing trees is increased to 0.368 in the FAREAST model (Yan and Shugart 2005).
The REGENERATION sub-model randomly selects species from the seed and seedling banks that are established in a given year and that can survive in a given environment. The seeding of species is determined by the relative size of the seedling bank of that species and is reduced to reflect environmental conditions. The seed and seedling banks are updated annually by adding new seedlings from seeds and new seeds from local seed production.
Ten individual tree species were included in this application of the FAREAST model and were grouped into six genera (Abies spp., Larix spp., Picea spp., Pinus spp., Populus spp., Betula spp.). The environmental range of all potential species determines which species potentially grow at a site. The physiological parameter sets for each tree species (e.g. light, nutrient and water demands), determine which of the potential species will establish and survive during succession. Twenty-five parameters describe the tree species fundamental silvicultural characteristics and determine each tree's ability to compete for light or nutrients, and their tolerance to a lack of water (Yan and Shugart 2005). Allometric equations are used to calculate tree growth by species, which is affected by the vertical light environment, the storage of water and plant available nitrogen at a site; a different growth rate is used for early and late growth (Yan and Shugart 2005).
2.3. MTCLIM model
MTCLIM was developed by Running et al (1987) and is based on the mountain climate calculation theory. This model is driven by climate data (i.e. daily maximum and minimum temperature, precipitation), geographic information (i.e. longitude, latitude), and terrain characteristics (i.e. elevation, slope and aspect) to generate a set of climate data for different aspects at different elevations. A comparison of observed and predicted parameters showed that the MTCLIM model successfully captured the daily variance patterns on the north and south slopes in western Montana (Running et al 1987). MTCLIM has been used to detect aspect-induced ecological differences in mountain areas, especially for regions without observed meteorological data (Running et al 1987, Running and Gower 1991, Thornton et al 1997).
2.4. Data and analysis method
There are three major data components used in our study:
- 1.Climate data. The daily maximum and minimum temperature and precipitation data of three studied stations (Habahe, Altai and Qinghe) over the period 1971–2000 were derived from the National Meteorological Information Center. The 30 year averaged monthly climate data were used to drive the FAREAST model and daily climate data over the same period was used in the MTCLIM model to generate climate data for the different aspects in the Altai Mountains.
- 2.Soil data (0~50 cm). The soil physical and chemical parameters used to drive the FAREAST model mainly include field capacity (cm), permanent wilting point (cm), bulk density (g cm−3), soil organic carbon (t C ha−1) and nitrogen pool (t N ha−1).These data were obtained from the Chinese Journal of Soil (National Soil Survey Office, 1996).
- 3.Forest data. We used measured wood volumes (m3 km−2), forest composition, canopy height and DBH of Larix sibirica (Larix spp.), on survey plot scale (~1 km2) to validate the simulated outputs in the Altai Mountains. The investigated data were derived from the Fourth National Forest Resources Inventory (Forest Resources Management Institute of China Forestry Administration, 1994). Moreover, the strong light response of Larix spp. allows their absolute domination in early succession, but these are slowly replaced by shade-tolerant evergreen conifers when the forest is fully mature. Accordingly, the forest compositions of Altai Mountains forests were divided into two groups: Larix spp., Populus spp. and Betula spp. were shade-intolerant, while Picea spp., Pinus spp. and Abies spp. were considered shade-tolerant (Survey and Planning Institute of China Forestry Administration 1981).
- 4.Analysis method. Descriptive statistics was applied to generate means, correlation and standard error in our study. Before statistical analysis, a normality test was used to examine whether the data of canopy height and DBH have a normal distribution. Pearson correlations and T-tests were further applied to determine correlation coefficients and statistically significant differences, respectively.
2.5. Experimental design
We selected the Habahe, Altai and Qinghe stations to represent the Northwest, Central and Southeast sub-regions, respectively (figure 1, table 1). For each station, the simulation was replicated seven times because of seven designed elevations (1200 m, 1400 m, 1600 m, 1800 m, 2000 m, 2200 m and 2400 m). For each elevation, the model was run for the four individual aspects (south, east, north and west). There were a total of 28 simulations for each station. To achieve an expected forest initialization for each simulation case, we first 'spun-up' 200 replications of the FAREAST model for a period of 1000 years during which the structure of the forest ecosystem changed from bare soil into the stand succession. This produced an assumed quasi-equilibrium forest condition. We took the average value of the 900–1000 years as simulated expectation for a mature forest landscape. The FAREAST model was tested for the Altai Mountains in Northwest China based on the following comparisons.
The simulated forest composition and vertical forest belt were compared against recorded data from the three sub-regions:
- 1.The simulated growth curve of canopy height and DBH of dominant species (Larix sibirica) were similarly compared.
- 2.The forest biomasses along four aspects in the Central sub-region were compared with the corresponding investigated data.
- 3.The FAREAST and MTCLIM models were combined and used to evaluate the slope aspect effects on forests dynamic succession, such as forest vertical distribution, dominant species' growth, forest biomass and composition.
3. Results
3.1. Model simulation performance for the Altai Mountains
Overall, the FAREAST model accurately reproduced the horizontal and vertical distributions of the Altai forests in Northwest China. The simulation results were consistent with the measured forest composition in the three sub-regions. For the simulation results in the Northwest sub-region (Habahe station), the dominant forest genera were Larix spp. and Picea spp., with a few Abies spp., Pinus spp. and Populus spp.; the simulated proportion of the above-mentioned genera was 75.1%, 13.8%, 5.4%, 4.1% and 1.6% (figure 2), respectively, which is consistent with the observation. However, there was no occurrence of Betula spp. in the simulation, whereas it was identified in the observation.
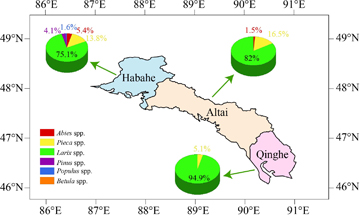
Figure 2. Simulated forest composition in the three sub-regions.
Download figure:
Standard image High-resolution imageTable 2. Simulated and observed forest composition and vertical forest belt in three sub-regionsa.
| Sub-region | Forest composition | Vertical forest belt(m) | |
|---|---|---|---|
| Northwest | Simulated | Larix spp., Picea spp., Abies spp., Populus spp., Pinus spp. | 1000–1200 |
| Observed | Larix spp., Picea spp., Abies spp., Populus spp., Pinus spp., Betula spp. | 1000–1300 | |
| Central | Simulated | Larix spp., Picea spp., Abies spp., Populus spp. | 900–1100 |
| Observed | Larix spp., Picea spp., Abies spp., Populus spp. | 800–1000 | |
| Southeast | Simulated | Larix spp., Picea spp., Populus spp. | 800–900 |
| Observed | Larix spp., Picea spp., Populus spp. | 600–900 |
aAll of the observations were derived from the Survey and Planning Institute of the China Forestry Administration (1981).
The simulation results in the Central sub-region (Altai station) indicated that the dominant forest genera were Larix spp. and Picea spp., with a few species of Abies spp. and Populus spp. This forest composition was also consistent with the observation (table 2). The proportions of Larix spp., Picea spp., Abies spp. and Populus spp. derived from the FAREAST model were 82%, 16.5%, 1.4% and 0.1%, respectively.
The simulated and observed vertical zonations across the three sub-regions are presented in table 2. The simulated forest compositions in the Southeast sub-region (Qinghe station) were Larix spp., Picea spp. and Populus spp., with the proportions of 94.9%, 5.0% and 0.1%, respectively. These results are also similar to the investigated forest data (table 2). Meanwhile, note that the forest diversity in the Northwest was more abundant when it was compared with the Central and Southeast sub-regions.
In general, the Northwest supported the widest vertical forest-belt, followed by the Central and Southeast sub-regions. Specifically, the simulated value in the Northwest ranged from 1000–1200 m compared with the observation of 1000–1300 m. There was a small discrepancy in the vertical belt in the Central sub-region, i.e. a difference of 100 m (900–1100 m for the simulation, 800–1000 m for the observation). The smallest width of the vertical belt occurred in the Southeast, i.e. 600–900 m for the observation and 800–900 m for the simulation.
Larix sibirica (Larix spp.) is not only the dominant species in the secondary forest but also the old forest of the Altai Mountains. Comparing the simulated growth curve of canopy height and DBH with the observations, the model showed a good agreement with the measurement-based data. The simulated and measured tree height increased rapidly in the first 200 years, then slowed gradually as time progressed and eventually reached a steady status; the Pearson correlation between the simulated and measured tree heights was approximately 0.99 (P < 0.001). The simulated value was slightly lower than the observed value (figure 3(a)). For the DBH growth curve, the simulated value was slightly lower than the observed value by −0.77 cm in the first 160 years, but higher than the observations by 1.2 cm during 160–280 years. The Pearson correlation was 0.98 (P < 0.001) over the whole period of 280 years (figure 3(b)).
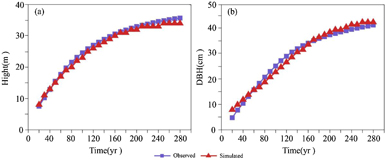
Figure 3. Comparison of observed and simulated canopy height (a) and DBH (b) of Larix sibirica (Larix spp.) at 1800 m in the Central sub-region (Altai station). The red solid line denotes the simulation, and the blue dotted line denotes the observation, which was derived from the Fourth National Forest Resources Inventory (Forest Resources Management Institute of China Forestry Administration 1994).
Download figure:
Standard image High-resolution imageA comparison of simulated and observed biomass across seven elevations and four aspects in the Central sub-region (Altai station) is shown in figure 4. Before the comparison, the investigated wood volumes (m3 ha−1) data need to be converted into the aboveground biomass in carbon units (t C ha−1) by multiplying the biomass expansion factor 0.9 (Fang et al 2007) and carbon content factor 0.467 (Zhu et al 2017). From figure 4, the FAREAST model captures the variances in forest biomass with increased elevation in the Central sub-region, regardless of the aspect. In the North, the simulated biomass values were 78.1, 94.4 and 95.4 t C ha−1 at elevations of 1600 m, 1800 m and 2000 m, while the corresponding observations were 77.3, 90.1 and 96.9 t C ha−1, with differences of 0.8, 3.3 and −1.5 t C ha−1, respectively (figure 4(a)); in the South, the respective simulated and observed values were 79.2 and 77.7 t C ha−1 at 2000 m, and 80.5 and 90.1 t C ha−1 at 2200 m. With the exception of 2400 m, the biomass in the South was consistently smaller than that in the North (P < 0.05) at the same elevation irrespective of whether the result was a simulation or an observation (figure 4(c)); in the East and West, the simulations exhibited similar distributions, with the minimum biomass at the lower tree line and the maximum value at 2200 m (figures 4(b) and (d)). However, because of the limited investigated forest plots in the East (supplement, table S1 available at stacks.iop.org/ERL/13/034027/mmedia), the corresponding simulation had a larger bias than that for the West, with average differences of 9.9 and −3.7 t C ha−1, respectively. The simulated uncertainties derived from the 900–1000 year have an increasing tendency with the increase of elevation for all aspects (figure 4).
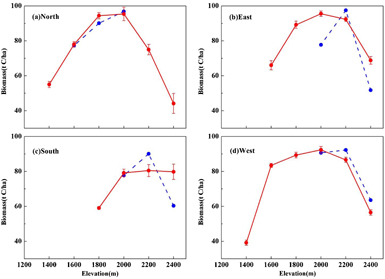
Figure 4. Comparison of observed and simulated forest biomass across seven elevations and four aspects in the Central sub-region. The blue dotted line represents the observation and the red solid line represents the simulation. The simulated uncertainty refers to one standard deviation and is derived from the spread of the 900–1000 year data.
Download figure:
Standard image High-resolution image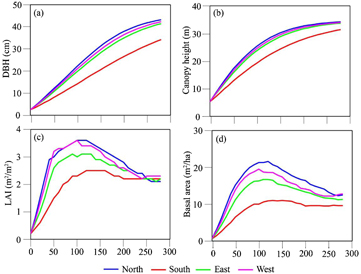
Figure 5. The annual variance of DBH, canopy height, LAI and basal area of Larix sibirica (Larix spp.), along four aspects at 1800 m in the Central sub-region (Altai station).
Download figure:
Standard image High-resolution image3.2. The impact of aspect on forests in the Altai Mountains
Simulations showed the smallest lower tree-line value in the North, followed by the East, West, and South (where largest value was shown) for all sub-regions. However, this was not observed for the upper tree-lines, and all of the simulations were within the range of 2400–2500 m. Hence, the vertical forest belt, which is the difference between the upper and lower tree-line, had the widest value in the North, followed by the East, West, and South. Furthermore, the vertical forest belt exhibited a decreasing trend with the decrease in latitude: 1000–1200 m in the Northwest, 900–1100 m in the Central, and 0–900 m in the Southeast.
A comparison of simulated DBH and canopy height of Larix sibirica (Larix spp.), among the four aspects in the Central sub-region (Altai station) is shown in figure 5. The growth curves for the North, East and West are comparable, all of which increased rapidly in the first 200 years, and eventually reached a steady status in the last 100 years (figures 5(a) and (b)). In terms of leaf area index (LAI) and basal area, with the exception of the South slope, the growth curves in the North, West and East increased rapidly in the first 100 years, but decreased gradually over 100–280 years. Moreover, the discrepancy among the four aspects showed that the best growth of Larix sibirica (Larix spp.) occurred in the North, followed by the West and East, and the South performed the worst growth status (P < 0.05).
With respect to the proportion of shade-tolerant species, the averaged value derived from all the elevations indicated a similar distribution among the three sub-regions (figure 6(d)). The highest proportion of shade-tolerant species was found along the North aspect, with values of 16.1%, 8.1% and 3.8% in the Northwest, Central and Southeast sub-regions, respectively, and the corresponding values decreased to 8.4%, 4.7% and 0% for the South aspect. In addition, we found the proportion of shade-tolerant species exhibited a decreasing trend with the increase in elevation (figures 6(a)–(c)).
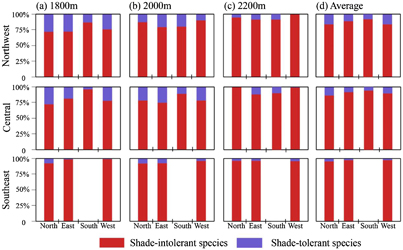
Figure 6. The proportion of shade-intolerant and shade-tolerant species along four aspects in the three sub-regions.
Download figure:
Standard image High-resolution imageThe simulated biomass values of the forest growing along the four aspects in the three sub-regions are shown in figure 7 and table 4. The FAREAST model simulated maximum forest biomass in the Northwest (Habahe station) with a value of 77.6 t C ha−1, but a minimum value of 50.7 t C ha−1 in the Southeast (Qinghe station) (P < 0.05). The North aspect supported the greatest biomass, followed by the West and East, whereas the South aspect showed the lowest value. The difference between the North and South reached approximately 11.0 t C ha−1 in the Northwest (Habahe station), and the corresponding differences increased to 15.6 and 55.9 t C ha−1 in the Central (Altai station) and Southeast (Qinghe station) sub-regions, respectively. The North supports richer forest diversity when it was compared with the other aspects (table 4). For instance, Larix spp., Picea spp., Populus spp., Abies spp. and Pinus spp. were observed in the North aspect of the Central sub-region (Altai station); however, Abies spp. and Pinus spp. were not observed in the South. Moreover, due to the warmer and drier climate in the Southeast sub-region (Qinghe station), our simulations showed there was no forest growth in the South aspect.
Figure 7. The simulated forest aboveground biomass along four aspects in the three sub-regions.
Download figure:
Standard image High-resolution image
4. Discussion
4.1. Slope aspect and forest dynamic succession
The precipitation regime in the Altai Mountains is totally affected by humid air masses from the Arctic Oceans, and therefore, the rainfall pattern presents the gradually decreasing tendency from the North to South aspect. With greater solar radiation received in the South sub-region, the relatively higher temperatures caused by solar radiation increase soil evaporation and plant transpiration, and leadto the warmer and drier microclimate on the south-facing slopes. Experiments on controlling factors in altitudinal zonations are an ancient idea in ecology, dating from the work of Theophrastus, the 'father of ecology' (Shugart and Woodward 2011). Needless to say, the patterns are complex, but generally for vertical forest zonations in mountain areas, the main limiting factor for upper tree-line locations is temperature related, as seems the case regionally for our study (Lyu et al 2016). It is more frequently water-balance variables for the lower tree-line boundary (Pearson 1931, Wang et al 2017). We found that the slope aspect with the drier and warmer climate supports higher tree-lines (table 3); this result is consistent with previous studies, such as Daniels and Veblen (2003). Meanwhile, the higher proportion of shade-intolerant species was found along the southern aspect (figure 6), which could also be attributed to the higher solar radiation received in the corresponding areas. In addition, we noticed both of the forest diversity and biomass in the slopes facing north are higher than other aspects (table 4, figure 7); these could be partially caused by the corresponding cooler and wetter climate, which is much more suitable for the growth of forest than the arid mountain areas (Survey and Planning Institute of China Forestry Administration 1981). Furthermore, we also found that the simulated uncertainties performed an increasing tendency with the increase of elevation for all aspects; this can be largely explained by lower temperatures at higher elevations. The FAREAST model does not consider the impact of low temperature on water balance, and this could be a critical environmental factor controlling forest growth in mountainous areas (Yan and Shugart 2005).
Table 3. Simulated vertical forest belt and lower and upper tree-line along four aspects.
| Sub-region | Slope direction | Lower tree-line (m) | Upper tree-line (m) | Vertical forest belt (m) |
|---|---|---|---|---|
| Northwest | North | 1300 | 2400 | 1200 |
| East | 1400 | 2400 | 1100 | |
| South | 1600 | 2500 | 1000 | |
| West | 1400 | 2400 | 1100 | |
| Central | North | 1400 | 2400 | 1100 |
| East | 1500 | 2400 | 1000 | |
| South | 1700 | 2500 | 900 | |
| West | 1400 | 2400 | 1100 | |
| Southeast | North | 1600 | 2400 | 900 |
| East | 1800 | 2500 | 800 | |
| South | – | – | – | |
| West | 1800 | 2500 | 800 |
Table 4. The simulated aboveground biomass of forest along four aspects (t C ha−1).
| Sub–region | Slope–direction | Larix spp. | Picea spp. | Populus spp. | Abies spp. | Pinus spp. |
|---|---|---|---|---|---|---|
| Northwest | North | 67.3 | 10.3 | 1.5 | 1.6 | 1.3 |
| East | 62.9 | 8.2 | 1.0 | 1.2 | 1.3 | |
| South | 64.6 | 5.0 | 0.4 | 0.5 | 0.5 | |
| West | 68.5 | 10.0 | 1.3 | 1.4 | 1.5 | |
| Central | North | 64.0 | 9.8 | 1.0 | 0.8 | 0.2 |
| East | 57.1 | 5.0 | 0.3 | – | – | |
| South | 57.6 | 2.8 | 0.1 | – | – | |
| West | 65.2 | 7.6 | 0.1 | 0.4 | – | |
| Southeast | North | 53.6 | 2.0 | 0.3 | – | – |
| East | 44.9 | 0.8 | – | – | – | |
| South | – | – | – | – | – | |
| West | 49.4 | 0.9 | 0.1 | – | – |
As the pioneer tree species, Larix sibirica (Larix spp.) could quickly colonize the forest from different types of disturbances (wildfire, deforestation or clearing), and become the initial forest tree component of a new forest in the early forest succession of Altai Mountains. Due to shade-intolerant characteristics, parts of the original Larix sibirica (Larix spp.) are gradually replaced by new species (such as Picea spp.) during the late stage of forest dynamic succession (Survey and Planning Institute of China Forestry Administration 1981). Therefore, the simulated annual LAI and basal area curves increased rapidly, then decreased gradually in the North, West and East aspect. Because of the limited occurrences of forest dynamic succession in the warmer and drier climate, there was no obviously decreasing trend in the annual LAI and basal area over 100–280 years in the South aspect (figures 5(c) and (d)).
4.2. Model limitations
In this study, we initially validated the FAREAST model, and then evaluated the impacts of aspect on forests in the Altai Mountains in Northwest China. Although relatively reasonable conclusions were derived from the model, there are some limitations to the simulation process:
There was no occurrence of Betula spp. in the simulation, whereas these species were observed in the Northwest sub-region (table 2). This phenomenon probably arises from the following reasons: on the one hand, Betula spp. species are shade-intolerant and are assumed to grow rapidly in the first 200 years in the FAREAST model. Subsequently, Betula spp. is gradually replaced by other shade-tolerant species (such as Picea spp.) during dynamic forest succession. Therefore, it was difficult to detect Betula spp. in the quasi-equilibrium forest in our simulations. On the other hand, as observed in forest survey data (Survey and Planning Institute of China Forestry Administration 1981), Betula spp. prefers to grow in the lower elevation and river valley area in the Altai Mountains, which has a mild and wet climate; however, the elevation in our simulations ranged from 1200–2400 m, and the lower temperatures and fewer available water resources at such high elevations cannot support the growth of Betula spp.
On the basis of wildfire data from the Altai Mountains (Statistics Bureau of Xinjiang Uygur Autonomous Region 2008), we set the wildfire frequency as six times over the whole period of 1000 years for all slope aspects in the simulations. However, previous studies demonstrated that the wildfire frequency and duration are considerably higher and longer along the south-facing aspect (Hayes 1941, Byram and Campbell 1948). In the application here, because of inadequate knowledge of wildfire differences, the FAREAST model was set to the same wildfire frequency among the four aspects, which might increase the uncertainty of forest composition and biomass in the Altai Mountains. This is particularly true for future projection studies, for which the sensitivity of forest wildfire to climate change might be substantially different between individual aspects (Viereck 1973, Williams et al 2001, Pausas 2004, Hallett and Hills 2006).
Uncertainties in process-based model estimates are often considered to be largely induced by biases in forcing climate data (Zhao et al 2006, Barman et al 2014). In the present study, although we used the MTCLIM model to produce the input meteorological data for the four aspects and seven elevations, it was difficult to estimate error from the generated climate data because none of the observed variables were available for validation across all aspects and elevations. Accordingly, further efforts should be focused on the collection of observed climate data from different aspects. This technique, to a certain extent, could effectively improve the accuracy of final forest assessment results by reducing the uncertainty associated with the MTCLIM model.
The outstanding performance of our model in reproducing forest growth at site scale provides theoretical foundations for the application of this model to estimate dynamic forest succession at a larger scale, particularly at national or continental levels. Furthermore, if FAREAST is further coupled with climate models under different RCP climate scenarios (Meinshausen et al 2011), we could more quantitatively project future impacts of global change on forest growth along different aspects.
5. Conclusion
The FAREAST model accurately reproduced the vertical forest belt, forest composition, growth curve of Larix sibirica (Larix spp.) and the forest biomass in three sub-regions in the Altai Mountains. This indicates that the FAREAST model can be successfully applied in Northwest China. Moreover, all of the simulations indicated a substantial discrepancy in forest growth status among the individual aspects regardless of elevation. Overall, the best forest growth occurred in the North, followed by the West and East, whereas the south-facing aspect consistently exhibited the worst performance on the forest belt, biomass storage and forest diversity. The average forest belt difference between the North and South Altai Mountains reached approximately to 400 m. The biomass in the North was 11.0, 15.3 and 55.9 t C ha−1 higher than that along the south-facing aspect in the Northeast, Central and Southeast sub-regions, respectively. As a whole, our findings endorse the concept of using a dynamic forest succession model with a physically based distributed mode of mountain climate as a conceptual tool to evaluate mountain vegetation patterns and eventually the complex problem of representing climate change in mountainous regions.
Acknowledgments
We would like to acknowledge financial support from the National Natural Science Foundation of China (grant number: 31570473) and Fundamental Research Funds for the Central University (grant number: 2662016QD041) and Global Research Programs of Distinction, University of Virginia.