
Abstract
Many empirical hurricane economic loss models consider only wind speed and neglect storm size. These models may be inadequate in accurately predicting the losses of super-sized storms, such as Hurricane Sandy in 2012. In this study, we examined the dependences of normalized US hurricane loss on both wind speed and storm size for 73 tropical cyclones that made landfall in the US from 1988 through 2012. A multi-variate least squares regression is used to construct a hurricane loss model using both wind speed and size as predictors. Using maximum wind speed and size together captures more variance of losses than using wind speed or size alone. It is found that normalized hurricane loss (L) approximately follows a power law relation with maximum wind speed (Vmax) and size (R), L = 10c Vmaxa Rb , with c determining an overall scaling factor and the exponents a and b generally ranging between 4–12 and 2–4 respectively. Both a and b tend to increase with stronger wind speed. Hurricane Sandy's size was about three times of the average size of all hurricanes analyzed. Based on the bi-variate regression model that explains the most variance for hurricanes, Hurricane Sandy's loss would be approximately 20 times smaller if its size were of the average size with maximum wind speed unchanged. It is important to revise conventional empirical hurricane loss models that are only dependent on maximum wind speed to include both maximum wind speed and size as predictors.
Export citation and abstract BibTeX RIS

Content from this work may be used under the terms of the Creative Commons Attribution 3.0 licence. Any further distribution of this work must maintain attribution to the author(s) and the title of the work, journal citation and DOI.
1. Introduction
Landfalling hurricanes cause large amounts of economic damage, injury and loss of life. In the United States, hurricane losses account for the largest fraction of insured losses from all natural hazards (Bevere et al 2013). It is expected that hurricane loss (L) would depend on maximum wind speed (Vmax), storm size (R), duration, wind direction, precipitation, storm surge, and local exposure and vulnerability factors such as the number of housing units, composition, value and age of properties, and demographic information including population density (Vickery et al 2006, Bouwer 2011, Murphy and Strobl 2010, Nordhaus 2010, Schmidt et al 2010, Mendelsohn et al 2012, Czajkowski and Done 2014). A comprehensive hurricane loss model should consider all these factors, although empirical models usually include a limited number of predictors for macro-scale assessment of hurricane damages resulted from climate and socio-economic changes (e.g., Nordhaus 2010, Emanuel 2011, Mendelsohn et al 2012). We focus on the dependence of hurricane loss on maximum wind speed and storm size on an aggregate scale in this study.
The dependence of hurricane loss on maximum wind speed has been examined extensively. It has been shown that hurricane economic loss follows an approximate power-law relationship with maximum wind speed, i.e., L = CVmaxa , with a ranging between 3 and 9 (Nordhaus 2010, Bouwer and Botzen 2011, Emanuel 2011) and C being a scaling factor. Murnane and Elsner (2012) analyzed normalized US hurricane losses from 1900 to 2011 using a linear fitting between log10(L) and Vmax for the top 10%, 25%, 50%, 75%, and 90% of hurricane losses. This method, called quantile regression approach, suggested an exponential relationship between normalized loss and maximum wind speed.
While Vmax is found to explain the largest variance of hurricane damage (Nordhaus 2006, Schmidt et al 2010, Jain 2010, Murphy and Strobl 2010), the fact that many low intensity storms caused substantial losses suggests that it is necessary to consider factors beyond maximum wind speed in estimating hurricane losses. For example, Hurricane Sandy (2012) was a category 1 hurricane with a Vmax of 75 miles per hour (mph) when it made landfall on 29 October 2012. It caused widespread damage in New Jersey and New York, with a total loss around 51.2 billion when normalized to 2013 US dollars (USD) according to the ICAT damage estimates (http://www.icatdamageestimator.com). On the other hand, Hurricane Andrew (1992) had a Vmax of 170 mph (category 5) at landfall and its total normalized loss was similar to the Sandy's, about 53.7 billion in 2013 USD (table 1). Obviously, factors other than maximum wind speed contribute to the similar losses between Hurricane Andrew (1992) and Sandy (2012). In the top 30 most costly tropical cyclones (TCs) whose normalized losses are greater than one billion (table 1), 9 (30%) storms have Vmax less than 95 mph, the upper limit of category 1 Hurricane on the Saffir–Simpson hurricane wind scale.
Table 1. The list of landfalling Atlantic tropical cyclones used in the study. The normalized losses are in billions of 2013 US dollars. The maximum wind speeds (Vmax) are in miles per hour (mph). The radii of 34 knots wind speed (R34) are in nautical miles (nm).
| Rank | Name | Date | Loss ($Billion) | Vmax (mph) | R34(nm) |
|---|---|---|---|---|---|
| 1 | Katrina | 8/29/2005 | 96.56 | 125 | 175 |
| 2 | Andrew | 8/24/1992 | 53.77 | 170 | 97.5 |
| 3 | Sandy | 10/29/2012 | 51.21 | 75 | 385 |
| 4 | Wilma | 10/23/2001 | 24.56 | 120 | 181.25 |
| 5 | Ike | 9/13/2008 | 20.32 | 110 | 168.75 |
| 6 | Ivan | 9/16/2004 | 18.39 | 120 | 175 |
| 7 | Charley | 8/13/2004 | 17.5 | 150 | 78.75 |
| 8 | Hugo | 9/21/1989 | 17 | 140 | 137.5 |
| 9 | Rita | 9/24/2005 | 11.92 | 115 | 145 |
| 10 | Frances | 9/5/2004 | 11.65 | 105 | 155 |
| 11 | Jeanne | 9/26/2004 | 8.94 | 120 | 145 |
| 12 | Allison | 6/5/2001 | 7.68 | 50 | 95 |
| 13 | Floyd | 9/16/1999 | 7.47 | 105 | 162.5 |
| 14 | Irene | 8/27/2011 | 7.33 | 75 | 182.5 |
| 15 | Fran | 9/5/1996 | 6.09 | 115 | 181.25 |
| 16 | Opal | 10/3/1991 | 5.93 | 115 | 181.25 |
| 17 | Isabel | 9/18/2003 | 4.76 | 105 | 237.5 |
| 18 | Gustav | 9/1/2008 | 4.53 | 105 | 180 |
| 19 | Bob | 8/19/1991 | 3.46 | 105 | 112.5 |
| 20 | Georges | 9/28/1998 | 2.85 | 105 | 121.25 |
| 21 | Dennis | 7/10/2005 | 2.66 | 120 | 153.75 |
| 22 | Isaac | 8/28/2012 | 2.41 | 80 | 152.5 |
| 23 | Andrew | 8/25/1992 | 2.24 | 115 | 125 |
| 24 | Gordon | 11/15/1990 | 1.64 | 50 | 120 |
| 25 | Irene | 10/14/1995 | 1.33 | 80 | 90 |
| 26 | Lili | 10/2/1998 | 1.27 | 90 | 142.5 |
| 27 | Bonnie | 8/26/1998 | 1.26 | 110 | 156.25 |
| 28 | Georges | 9/25/1998 | 1.19 | 105 | 112.5 |
| 29 | Dolly | 7/23/2008 | 1.11 | 85 | 110 |
| 30 | Alberto | 7/3/1994 | 1.03 | 65 | 60 |
| 31 | Erin | 8/2/1995 | 0.69 | 85 | 87.5 |
| 32 | Erin | 8/3/1995 | 0.69 | 100 | 87.5 |
| 33 | Fay | 8/19/2008 | 0.59 | 65 | 65 |
| 34 | Ernesto | 8/29/2006 | 0.56 | 45 | 31.25 |
| 35 | Bertha | 7/12/1996 | 0.51 | 105 | 143.75 |
| 36 | Josephine | 10/6/1992 | 0.5 | 70 | 50 |
| 37 | Isidore | 9/26/2002 | 0.49 | 65 | 235 |
| 38 | Cindy | 7/5/2005 | 0.38 | 75 | 37.5 |
| 39 | Gabrielle | 9/14/2001 | 0.35 | 70 | 87.5 |
| 40 | Marco | 10/10/1986 | 0.27 | 35 | 87.5 |
| 41 | Hermine | 9/6/2010 | 0.26 | 70 | 37.5 |
| 42 | Dennis | 9/4/1999 | 0.26 | 70 | 97.5 |
| 43 | Claudette | 7/15/2003 | 0.25 | 90 | 96.25 |
| 44 | Gilbert | 9/16/1988 | 0.25 | 70 | 237.5 |
| 45 | Chantal | 8/1/1989 | 0.24 | 80 | 100 |
| 46 | Danny | 7/19/1997 | 0.18 | 80 | 45 |
| 47 | Hanna | 9/6/2008 | 0.17 | 70 | 106.25 |
| 48 | Jerry | 10/14/1985 | 0.17 | 85 | 87.5 |
| 49 | Gaston | 8/29/2004 | 0.17 | 75 | 47.5 |
| 50 | Earl | 9/2/1998 | 0.14 | 80 | 83.75 |
| 51 | Mitch | 11/4/1994 | 0.14 | 65 | 143.75 |
| 52 | Charley | 8/14/2004 | 0.12 | 80 | 63.75 |
| 53 | Bret | 8/22/1999 | 0.1 | 115 | 67.5 |
| 54 | Charley | 8/22/1998 | 0.087 | 45 | 106.25 |
| 55 | Ophelia | 9/15/2005 | 0.083 | 75 | 97.5 |
| 56 | Bill | 6/30/2003 | 0.071 | 60 | 91.25 |
| 57 | Humberto | 9/13/2007 | 0.054 | 90 | 37.5 |
| 58 | Arlene | 6/20/1993 | 0.047 | 40 | 31.25 |
| 59 | Barry | 8/5/2001 | 0.046 | 70 | 60 |
| 60 | Hanna | 9/14/2002 | 0.03 | 60 | 62.5 |
| 61 | Harvey | 9/21/1999 | 0.025 | 60 | 43.75 |
| 62 | Earl | 9/2/2010 | 0.019 | 70 | 170 |
| 63 | Gordon | 9/17/2000 | 0.017 | 65 | 118.75 |
| 64 | Keith | 11/22/1984 | 0.015 | 65 | 162.5 |
| 65 | Alex | 6/30/2010 | 0.011 | 70 | 137.5 |
| 66 | Beryl | 8/9/1988 | 0.008 | 50 | 62.5 |
| 67 | Florence | 9/9/1988 | 0.007 | 80 | 75 |
| 68 | Kyle | 10/10/1998 | 0.007 | 40 | 10 |
| 69 | Fay | 9/7/2002 | 0.007 | 60 | 42.5 |
| 70 | Alex | 8/3/2004 | 0.005 | 80 | 63.75 |
| 71 | Chris | 8/28/1988 | 0.003 | 45 | 60 |
| 72 | Allison | 6/5/1995 | 0.003 | 70 | 87.5 |
| 73 | Gustav | 9/10/2002 | 0.0001 | 65 | 106.25 |
Kantha (2006) pointed out that storm size is an important parameter that must be incorporated into the index for hurricane hazard in addition to maximum wind speed and storm translation speed (S). He proposed a Hurricane Hazard Index (HHI) in the form of (R/R0)2(Vmax/Vmax0)3(S0/S), in which the subscript '0' indicates corresponding reference values. Storm size not only determines the impacted area, but also affects wind duration and wind directional change in the census tracts, both factors being important drivers of losses on local scale (Czajkowski and Done 2014, Powell et al 1995, Jain 2010). Holland et al (2010) also showed that wind speed, size and translation speed all contribute to the offshore energy industry losses. Based on the work of Kantha (2006), Dr Steve Smith of Willis Re, created the CME Hurricane IndexTM (CHITM), i.e., CHI = (Vmax/Vmax0)3 + (3/2)(R/R0)(Vmax/Vmax0)2, for quick estimates of hurricane damage. Although both HHI and CHITM take into account storm size, the exact dependence of loss on size varies. Thus, it is imperative to examine historical data to quantify the relationship between hurricane loss and size on an aggregate level.
Emanuel (2005) provided a theoretical basis for a possible relation between hurricane loss and size. He expressed the total power dissipation (PD) of a tropical cyclone (TC) as the integral of the cubic of maximum wind speed over the size  of a storm through its lifetime

where  is the surface drag coefficient,
  is the surface air density, |V| is the magnitude of surface wind speed, r is the radius of the storm, and the integral is from storm center to the outer storm limit and over the lifetime
  of the storm. Since the economic loss of a hurricane is driven by PD, equation (1) shows that loss would increase with the square of average storm size. Powell and Reinhold (2007) proposed to use the integrated kinetic energy (IKE) over the volume of a TC as an indicator of storm destructive potential. In their paper, the IKE is a quadratic function of maximum wind speed and several size measures. Whether the theoretical models are applicable to actual hurricane losses needs to be tested with real data.
The availability of storm size information from the National Hurricane Center (NHC) Extended Best Track (EBT) database (Demuth et al 2006) provides us an opportunity to determine the dependence of hurricane loss on size from observations. In this study, we aim to quantify the relationship between hurricane loss and the hurricane maximum wind speed and size using historical data and create an empirical model for hurricane loss using both maximum wind speed and size as predictors. The estimated hurricane losses by the bivariate regression model are compared with those from the simple regression models using maximum wind speed or size alone. In particular, the relative roles of maximum wind speed and size in determining Hurricane Sandy's loss are analyzed.
The structure of the paper is as follows. Section 2 describes the data for hurricane loss, maximum wind speed and size, as well as the analysis method. Sections 3 and 4 show the relationship between loss and maximum wind speed, and between loss and size, respectively. Section 5 presents the bi-variate regression results, the sensitivity, uncertainty and statistical significance of the regression coefficients. Section 6 discusses the importance of the size for predicting Hurricane Sandy's loss, and conclusions are given in section 7.
2. Data and approach
The US hurricane loss data are downloaded from the ICAT Damage Estimator website (http://www.icatdamageestimator.com/viewdata). ICAT is an insurance company that provides catastrophe insurance coverage to business and homeowners in the US. The losses are normalized to 2013 USD, taking into account of inflation, wealth and population differences between the years that landfalling hurricanes occurred (Pielke et al 2008) and the reference year (2013 in our study). The loss data include only direct losses associated with a hurricane's impact and do not consider indirect damage and longer-term macroeconomic effects (Pielke et al 2008). They are based on the historical economic damage compiled by Landsea (1991) from the monthly weather review annual summaries and more recently from the storm summary archive at the NHC website (NHC 2006). They are total losses, including both wind and flooding damages, roughly following a doubling of the insured losses, although adjustments are made on a storm-by-storm basis (Pielke et al 2008). The uncertainties of the normalized loss data come from both the original hurricane damage estimate and the normalization procedure. Although Downton and Pielke (2005) found that the individual damage estimates between states and the federal government over different time periods could vary by as much as 40% for a large-impact storm with a loss of more than $500 million, no systematic biases in damage estimate are found (Downton et al 2005). The assumptions in the normalization methodology, such as the growth rate of national wealth, could have a sizeable impact on the normalized losses (Pielke and Landsea 1998) especially for the years before 1940. We use the loss data starting from 1988, when storm size data became available. The exposure and vulnerability characteristics are more similar in the past 25 years than over a longer period and therefore the normalization is prone to less error. Details about the normalized loss data can be found in Pielke et al (2008).
The maximum wind speeds at landfall for each storm are also provided by ICAT. We have verified that the maximum wind speeds at ICAT are consistent with the NHC data at the closest 6-hourly point prior to landfall, rounded up at a 5 mph interval.
For storm size, five metrics are available in the EBT database, dating back to 1988 (Demuth et al 2006). R34, R50 and R64 represent the radii of a storm where wind speeds at 10 m height above the surface are 34, 50 and 64 knots, respectively. Rmax represents the radius of maximum wind speed. Rout is the radius of the outmost closed isobar, i.e., the outer limit of a storm. The size data are given at four quadrants for each storm at 6-hourly interval. Averages of radii at the four quadrants are used in this study, although different weights for each quadrant may be explored in the future. The data at the closest 6-hourly interval prior to landfall are used. While R50, R64 and Rout are highly correlated with R34 with correlation coefficients close to 0.8, Rmax and R34 are only weakly correlated with a correlation coefficient of 0.13 for all available size data since 1988. The correlation between normalized hurricane loss and Rmax is found to be less than 0.1. Therefore, only R34 is used as a size metric for the regression models for loss. A total of 73 TCs that made landfall in the US between 1988 and 2012 form the basis of this analysis. Table 1 lists the 73 cases with storm name, date of landfall, normalized loss, maximum wind speed and R34 in descending order of loss values.
To quantify the relationship of hurricane loss with maximum wind speed and size, we use the multi-variate least-squares regression analysis tool. The best-fit regression line is identified by minimizing the sum of the squares of the vertical deviations from each data point to the line. The regression tool yields R2 as explained variance and p-value for statistical significance of each fit. The explained variance indicates how much variance of the predictand (y) can be accounted for by the regression model using the predictor(s). The higher R2 corresponds to a better fitting in terms of capturing the variations of a predictand. The p-value is the probability of the fitting coefficients for each predictor being zero. In other words, it is the chance of the dependence of the predictand on a predictor being purely random. To reject the null hypothesis that the dependence is random at a 95% statistical significance level, the p-value should be less than 0.05. The smaller the p-values, the more statically significant it is that the fitting coefficients are nonzero.
We conduct regression analyses for losses expressed as a function of maximum wind speed, a function of size, and a function of both wind speed and size. Sensitivity of the fittings to storm intensity (i.e., maximum wind speed) is examined. The uncertainty and statistical significance of the fitting results are quantified using the bootstrapping resampling method (Efron 1979). The details are described in section 5.
3. The relationship between loss and maximum wind speed
Figure 1 is a scatter plot between losses and maximum wind speeds for the 73 cases. Both quantities are expressed in logarithms of base 10. There is an approximate linear relation between loss and wind speed in logarithmic scale, suggesting a power-law relationship between L and Vmax. A least-squares linear fit yields  which gives an R2 of 0.39. The economic loss model thus explains 39% of the variance of the loss with a p-value of 3.32 × 10⁻⁹ for statistical significance level of 95%. This small p-value suggests that it is statistically significant at 95% level to reject a null hypothesis that the coefficient for Vmax equals zero. The correlation between the logarithms of L and Vmax is 0.63. The calculated root mean square (rms) for the least-squares fit residuals of log10(L) is 0.93. The rms accounts for how accurate the model is when estimating the actual loss. A low rms means the model's estimated values are close to the actual values while a high rms means the model's estimated values are far off from the actual values. Therefore, a low rms is preferred. Here, a rms of 0.93 for log10(L) suggests that the fitting errors for losses are on average within a factor of 10.

Figure 1. The scatter plot of loss versus maximum wind speed for the 73 tropical cyclone cases. Both loss and wind speed are shown in logarithm of base 10.
Download figure:
Standard image High-resolution image4. The relationship between loss and storm size
Figure 2 shows the relationship between loss and storm size, represented by R34. Their logarithms exhibit an approximately linear relation, but with more scatter than the counterpart for loss and wind speed. The least-squares fit yields  This linear fit captures only 26% of the variance of the loss, with the corresponding correlation of 0.51 and a p-value of 5.04 × 10⁻⁶ for statistical significance level of 95%. The rms for the least-squares fit residue of log10(L) is 1.03, somewhat larger than that for the regression using Vmax.
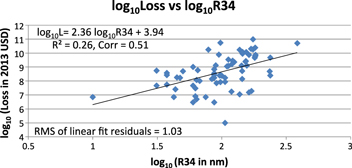
Figure 2. The scatter plot of loss versus R34 for the 73 tropical cyclone cases. Both loss and R34 are shown in logarithm of base 10.
Download figure:
Standard image High-resolution image5. Dependence of loss on maximum wind speed and size
Using multi-variate linear regression, a loss model using both maximum wind speed and size as predictors can be obtained. The correlation between Vmax and R34 is about 0.34 for the 73 TCs (0.16 for the 43 hurricanes with Vmax ⩾ 75 mph), indicating that they could serve as two nearly 'independent' variables for the prediction of losses. Quiring et al (2011) showed that annual averages of Vmax and R34 over the Atlantic Basin from 1988 to 2008 are correlated at 0.55 with even higher correlations up to 0.81 in sub-basins such as over the Caribbean. On the basis of individual storms, the correlation between Vmax and R34 is much weaker.
Following the approximate power-law relations shown in the preceding sections, a general form of the loss model is assumed to be

where a and b represent the power-law dependences of losses on maximum wind speed and size, respectively. They are termed 'elasticity' in Nordhaus (2010) and can be obtained as the regression slopes from a double-logarithmic (for predictand and predictors) least-squares regression. The constant c is a scaling factor that can be obtained using the regression y-intercept. It approximately represents the impacts of factors other than Vmax and R34, including the underlying exposure and vulnerability characteristics. This multiplicative relation for maximum wind speed and size, equation (2), is partly based on the theoretical consideration that the destructiveness of a storm is proportional to its total energy such as the IKE (Powell and Reinhold 2007) or the PD in equation (1) (Emanuel 2005). It also partly resembles the HHI proposed by Kantha (2006). On the other hand, an additive relation for maximum wind speed and size is also possible such as the CHI or the discrete equations for the IKE calculations (Powell and Reinhold 2007). As the function forms do not need to be unique, we focus on the multiplicative function form as in equation (2) in this paper. The additive function for Vmax and R34 is explored but not shown here because they generally explain similar or even less variance than equation (2).
As in Nordhaus (2010), we find the fitting coefficients are somewhat different for subsets of the data grouped by maximum wind speed, shown in table 2. For all 73 TC cases (Vmax ⩾ 35 mph), a is 4.18, b is 1.25, and c is −1.83. For category 1 or higher hurricanes (Vmax ⩾ 75 mph), a is 4.98, b is 2.66, and c is −6.22. For major hurricanes of category 3 or higher (Vmax ⩾ 110 mph), a and b increase to 11.97 and 4.44, respectively, and c is −24.62. When Vmax ⩾ 120 mph, a and b slightly decrease to 9.97 and 3.52, respectively; however, the sample size is very small (only 8) and the results are not statistically significant at these extremely high wind speeds (p-value > 0.05, thus not shown in table 2). Figure 3 shows the general increasing trend of 'elasticity' for wind speed and size with storm intensity. The higher elasticity on wind speed for stronger storms is consistent with the previous studies (Nordhaus 2010, Murnane and Elsner 2012) despite that fewer but more recent samples are examined here.
Table 2. Regression results using maximum wind speed and/or size as predictors for loss, following the function form L = 10c Vmaxa (R34)b . See text for details. R2 is the explained variance of loss by a regression model.
| Threshold Vmax | Sample size | R2 | a | b | c | R2 (Vmax only) | a (Vmax only, b = 0) | R2 (R34 only) | b (R34 only, a = 0) |
|---|---|---|---|---|---|---|---|---|---|
| ⩾ 35 | 73 | 0.45 | 4.19 | 1.25 | −1.83 | 0.39 | 5.27 | 0.26 | 2.36 |
| ⩾ 60 | 64 | 0.58 | 6.78 | 1.43 | −7.31 | 0.52 | 7.77 | 0.23 | 2.57 |
| ⩾ 65 | 60 | 0.55 | 6.92 | 1.44 | −7.62 | 0.48 | 7.69 | 0.18 | 2.32 |
| ⩾ 70 | 53 | 0.62 | 6.29 | 1.82 | −7.11 | 0.49 | 7.60 | 0.31 | 2.75 |
| ⩾ 75 | 43 | 0.69 | 4.98 | 2.66 | −6.22 | 0.40 | 7.11 | 0.51 | 3.36 |
| ⩾ 80 | 38 | 0.75 | 6.53 | 2.61 | −9.30 | 0.57 | 9.01 | 0.51 | 3.92 |
| ⩾ 85 | 30 | 0.75 | 6.82 | 2.48 | −9.64 | 0.50 | 8.07 | 0.41 | 3.10 |
| ⩾ 90 | 27 | 0.74 | 7.80 | 2.59 | −11.90 | 0.44 | 8.42 | 0.37 | 2.85 |
| ⩾ 100 | 24 | 0.64 | 8.82 | 3.13 | −15.17 | 0.30 | 6.73 | 0.16 | 2.09 |
| ⩾ 110 | 15 | 0.75 | 11.97 | 4.44 | −24.62 | 0.23 | 6.54 | 0.16 | 2.17 |
| ⩾ 115 | 13 | 0.80 | 12.11 | 4.34 | −24.72 | 0.25 | 6.92 | 0.20 | 2.31 |

Figure 3. Variations of bi-variate regression coefficients, a for maximum wind speed and b for size, with increasing threshold maximum wind speed, assuming that loss (L) follows the function form L = 10c Vmaxa (R34)b .
Download figure:
Standard image High-resolution imageTo test the statistical significance of the larger exponents a and b for hurricanes (Vmax ⩾ 75 mph) than those for all tropical storms (Vmax ⩾ 35 mph), we use the bootstrapping resampling (with replacement) method (Efron 1979) to identify the distributions of the fitting exponents and then compute the probability of the two means being from the same sample population. Similar tests can be conducted for all subsamples. However, we only focus on comparing the fittings for all tropical storms (Vmax ⩾ 35 mph) and for all hurricanes (Vmax ⩾ 75 mph) because of the physical importance of these two distinct groups and for compactness.
First, 43 samples are drawn randomly from the 73 storms and a bi-variate regression to the 43 losses using Vmax and R34 as predictors is conducted. This procedure is repeated 10 000 times by bootstrapping with replacement, resulting in a distribution of the fitting exponents a and b, the blue histograms in figure 4. Similarly, 43 bootstrapping resamples (with repetitions) of the hurricane cases (Vmax ⩾ 75 mph) are performed and the corresponding distributions for exponents a and b are shown in red histograms in figure 4. The mean values of a and b for all storms are 4.24 and 1.27, respectively, very close to the results from direct bi-variate regression of the cases (table 2, the second row, columns 4 and 5). The standard deviations of a and b for all storms based on the bootstrapping resamples are 0.98 and 0.5, respectively. In the cases of hurricanes only, the means of a and b become 5.04 and 2.66, respectively, nearly identical to the fitting coefficients in table 2 (the sixth row, column 4 and 5). The corresponding standard deviations for a and b are 1.2 and 0.58, respectively.
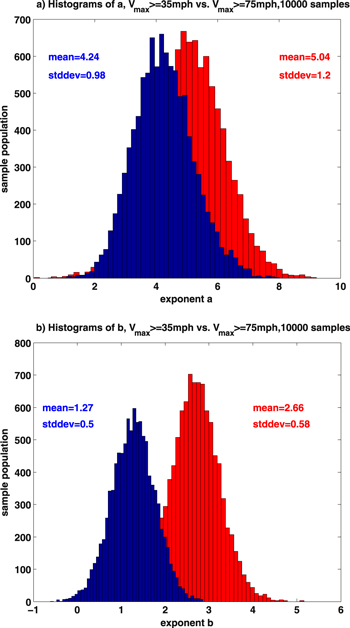
Figure 4. The histograms of bi-variate regression exponents a (top) and b (bottom) from 10 000 bootstrapping sample sets. The blue ones are from the random resamples of 43 storms from the 73 cases with Vmax ⩾ 35 mph, while the red ones are from the bootstrapping (with replacement) 43 hurricanes with Vmax ⩾ 75 mph. The mean and standard deviation of a and b for each group are marked.
Download figure:
Standard image High-resolution imageFor the exponent a, the two sample populations for Vmax ⩾ 35 mph and Vmax ⩾ 75 mph have quite some overlapping. The probability of a being 5.04 or greater for the all storm cases is about 21% based on the blue histogram (figure 4(a)). In other words, the mean values of the two sample populations for Vmax ⩾ 35 mph and Vmax ⩾ 75 mph are statistically different at about 80% level. On the other hand, the two sample populations of the exponent b for all storms and hurricanes are well separated (figure 4(b)). The probability of b being 2.66 or greater for the all storm cases is only 0.004, suggesting that the two means of the exponent b for all storms and hurricanes are statistically different at 99.6% level.
The increased power-law dependence of loss on size for hurricanes suggests that it is particularly important to consider the impact of size on loss for high-intensity storms, which are generally associated with greater losses than weaker tropical storms. For lower intensity tropical storms, the underlying exposure and vulnerability characteristics may mask the dependence of loss on size.
Furthermore, the explained variances by the bi-variate regressions are noticeably higher when maximum wind speed is higher. For example, the value of R2 increases from 45% for all storms with Vmax ⩾ 35 mph to 69% for hurricanes with Vmax ⩾ 75 mph, as shown in table 2, column 3. The smaller sample size for hurricanes (43) than for all storms (73) may contribute somewhat to the larger R2 for hurricane cases as less variability is present in the fewer samples. However, our bootstrapping resamples suggest that the sample size is not the dominant factor for the greater explained variance for higher intensity TCs.
Figure 5 shows the distributions of R2 for the 10 000 times of bootstrapping drawn from the 73 all storm cases and the 43 hurricane cases. For all storms, only 43 samples are drawn randomly each time. Thus, the sample size for bi-variate regressions is kept at 43 for both bootstrapping procedures. The blue (from all storms) and red (from hurricanes) histograms of R2 yield sample means of 0.46 and 0.71, respectively. The probably of R2 being 0.71 and higher from the regressions of all storms is only 0.002, suggesting the means for the two sample populations are statistically different at 99.8% level. Therefore, the larger explained variance by Vmax and R34 for hurricane losses than for the losses of all storms indicates that wind speed and size play a greater role in determining the losses for higher intensity TCs. Other factors such as storm path, wind direction, duration, and local exposure and vulnerability characteristics are less important for high intensity TCs, but they may have a comparable role as maximum wind speed and size in driving the losses when storm intensity is relatively weak.
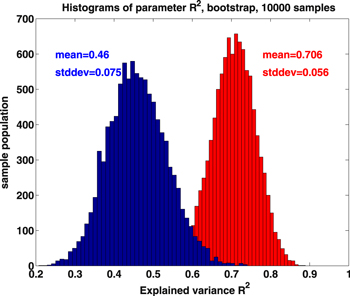
Figure 5. The histograms of the explained variance (R2) by the bi-variate regressions from 10 000 bootstrapping sample sets. The blue ones are from the random resamples of 43 storms from the 73 cases with Vmax ⩾ 35 mph, while the red ones are from the bootstrapping (with replacement) 43 hurricanes with Vmax ⩾ 75 mph. The mean and standard deviation of R2 for each group are marked.
Download figure:
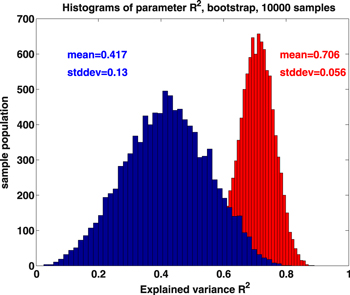
Standard image High-resolution imageTable 2 also lists the regression coefficients and explained variances if only wind speed or size is used for the least-squares fit for each subset of samples (columns 7–10 in table 2). Using two predictors consistently captures more variance of losses than using either wind speed or size alone in any subsets of samples. The statistical significance of higher explained variance by two predictors (Vmax and R34) than by one predictor (Vmax) is tested using the 10 000 realizations of bootstrapping drawn from the 43 hurricanes (figure 6). The histogram of the explained variance by uni-variate regression using Vmax only (blue in figure 6) is compared with the explained variance by bi-variate regression using Vmax and R34 together (red in figure 6). The two sample populations of R2 are statistically different at 98.5% level, as the probability of R2 being 0.71 from the uni-variate regressions is merely 0.015. Thus, we are confident that using both Vmax and R34 as predictors captures significantly more variabilities of the losses than using Vmax alone.
Figure 6. The histograms of the explained variance (R2) from 10 000 bootstrapping sample sets from the 43 hurricanes with Vmax ⩾ 75 mph. The blue ones are based on the uni-regression using only Vmax as a predictor. The red ones are based on the bi-variate regression using both Vmax and R34 as predictors. The mean and standard deviation of R2 for each group are marked.
Download figure:
Standard image High-resolution image
6. The importance of the size on Hurricane Sandy's loss
Hurricane Sandy (2012) is the largest Atlantic hurricane on record in terms of size. At its peak (20 h before landfall), Sandy's tropical storm-force winds (wind speed greater than 34 knots) spanned 1100 miles, about 1/5 of the area of the entire United States. At landfall, it covered almost 900 miles across with R34 being 385 nautical miles (nm). However, Sandy's Vmax is only 75 mph at landfall. Out of the top ten most expensive storms in table 1, Sandy is the only category 1 hurricane at landfall; all other storms have Vmax ⩾ 105 mph (category 2 and higher). Out of the 43 hurricanes analyzed, Sandy's Vmax is 74% of the average hurricane intensity (101 mph) and its R34 is about three times of the average hurricane size (127 nm).
To estimate the role of its enormous size in determining Sandy's loss, we use the bi-variate regression model for the 43 hurricanes,

because this model explains the largest variance of losses among all models applicable to Sandy (the second to sixth rows in table 2). Considering that the standard deviation of the fitting coefficient b is 0.58 based on the bootstrapping sample population (figure 4(b)), b may vary between 2.08 and 3.24 considering 1σ errors. Therefore, given that Sandy's size (R34) is about three times of the average storm, its loss would be approximately 20 (≈3.02.66) times the loss of a storm with the same maximum wind speed (75 mph) and the average hurricane size (127 mph), with about a factor of 2 (≈30.58) uncertainty for the ratio, i.e., 10–40 times. On the other hand, Sandy's relatively weak maximum wind speed would make its loss ∼20% of a storm with the average intensity (101 mph) and Sandy's size (385 nm). The 1σ uncertainty of the exponent a causes the ratio to vary between 15% and 30%. Clearly, the enormous size of Hurricane Sandy plays a predominant role in its economic loss.
7. Conclusions
The US normalized hurricane losses are found to have an approximate power-law relation with maximum wind speed and size, indicated by the radius of tropical-storm force winds. The power-law order for maximum wind speed ranges from between 4 and 12, while the power-law order for size is approximately between 2 and 4. The high elasticity on wind speed is consistent with previous studies (Bouwer and Botzen 2011, Howard et al 1972, Nordhaus 2010). This study, for the first time, presents a quantitative relationship between loss and size using historical data.
The dependence on the storm size is consistent with the expectation that the potential destructiveness of a storm is proportional to the area of the tropical-storm force winds (Emanuel 2005, Kantha 2006). The exact elasticity (the power-law order) is sensitive to the storm intensity—stronger storms have higher order power-law dependence on wind speed and size than the weaker storms, suggesting that it is especially important to take into account storm size when estimating losses for high-intensity hurricanes.
Storm size by itself does not account for a large fraction of the variance of hurricane losses. However, using wind speed and size together explains much more variance of losses than using the wind speed alone. Based on this study, conventional empirical models based on only maximum wind speed for hurricane loss should be revised to include both wind speed and size as predictors.
For Hurricane Sandy, its enormous size contributes predominantly to the economic loss. Out of the 43 hurricanes that were examined, Sandy's size was ∼3 times of the average hurricane size, corresponding to about 20 times greater economic loss than that by an average sized hurricane at the same maximum wind speed. Note that the uncertainty of the ratio 20 times is approximately a factor of two (i.e., 10–40 times). The huge loss by Hurricane Sandy is clearly a demonstration of the impact of storm size on hurricane damage.
As many other factors could contribute to hurricane losses, continued work is needed to incorporate the impacts of storm translation speed, wind duration, wind direction, precipitation rate, and rainfall amount in the loss model. In addition, the relatively short duration of the data and uncertainties in the normalized hurricane damage, maximum wind speed and size at landfall could affect the accuracy of the regression results. The varying elasticities with maximum wind speed could indicate more complicated nonlinear relationships than the simple linear regression models represent. It is also desirable to test the generality of our regression models by independent datasets. Nevertheless, the simple regression model using maximum wind speed and size as predictors provides the first-order estimate of hurricane economic damages. The quantitative dependences reported here provide useful guidance for developing more comprehensive loss models for hurricane damage research, insurance needs, and hazard preparations.
Acknowledgements
We thank Drs Lixin Zeng, Hui Su and Chengxing Zhai for helpful discussions and detailed comments on the manuscript. We thank Dr Longtao Wu and Dr Lee Poulsen for help with processing the Best Track data. We are grateful to two anonymous reviewers for constructive comments. ARZ thanks the support from La Cañada High School, especially Ms Patricia Compeau. JHJ performs the work at the Jet Propulsion Laboratory, California Institute of Technology, under contract with NASA.