
Abstract
Texas experienced the most extreme drought on record in 2011 with up to 100 days of triple digit temperatures resulting in record electricity demand and historically low reservoir levels. We quantified water and electricity demand and supply for each power plant during the drought relative to 2010 (baseline). Drought raised electricity demands/generation by 6%, increasing water demands/consumption for electricity by 9%. Reductions in monitored reservoir storage <50% of capacity in 2011 would suggest drought vulnerability, but data show that the power plants were flexible enough at the plant level to adapt by switching to less water-intensive technologies. Natural gas, now ∼50% of power generation in Texas, enhances drought resilience by increasing the flexibility of power plant generators, including gas combustion turbines to complement increasing wind generation and combined cycle generators with ∼30% of cooling water requirements of traditional steam turbine plants. These reductions in water use are projected to continue to 2030 with increased use of natural gas and renewables. Although water use for gas production is controversial, these data show that water saved by using natural gas combined cycle plants relative to coal steam turbine plants is 25–50 times greater than the amount of water used in hydraulic fracturing to extract the gas.
Export citation and abstract BibTeX RIS

Content from this work may be used under the terms of the Creative Commons Attribution 3.0 licence. Any further distribution of this work must maintain attribution to the author(s) and the title of the work, journal citation and DOI.
Abbreviations
| CC | Combined cycle (generally 2 CT to 1 ST generators) |
| CT | Combustion turbine |
| CWIS | Cooling water intake structure |
| EIA | Energy Information Administration |
| ERCOT | Electric Reliability Council of Texas |
| kWh | Kilowatt hour |
| TWh | Terawatt hour = 1 million megawatt hour (MWh) |
| NGCC | Natural gas combined cycle |
| NGST | Natural gas steam turbine |
| ST | Steam turbine |
| TCEQ | Texas Commission on Environmental Quality |
| TWDB | Texas Water Development Board |
1. Introduction
The interdependence of water and energy (or, in this study, electricity—a secondary form of energy) has been termed the water–energy nexus. Because of this interdependence, constraints on water can severely limit electricity generation that requires water, and constraints on energy can limit water supplies caused by lack of electricity to treat or transport water. Thermoelectric, or steam electric, generation requires water for cooling and accounts for ∼90% of US electricity generation. With maximum extent of droughts covering up to 65% of the US in 2012 and up to 30% in 2011 [1], concerns about impacts of water shortage on electricity generation are high. Thermoelectric generation accounts for ∼40% of withdrawals and 3% of consumption of freshwater in the US [2, 3]. Confusion between the terms water withdrawal and water consumption, with some studies using the two terms interchangeably, may suggest much greater drought vulnerability to water shortages; in fact, consumption is often two orders of magnitude less than withdrawal at the plant level [4]. Widespread use of water for cooling in power plants reflects the greater efficiency of water, relative to air, for dissipating heat and also reflects a legacy of more widespread physical and legal availability of water in the past.
The terms vulnerability and resilience are often applied to drought assessments. The concept of vulnerability in the context of this study refers to a system's susceptibility to reduced electric generation or brownouts or blackouts when subjected to drought-related water shortages. In contrast, the concept of resilience refers to the ability of a power plant to recover from drought stress. Resilience includes short-term coping strategies for the drought and long-term adaptive capacity. Turner [5] recognized that vulnerability and resilience are complementary, with vulnerability focusing on system weaknesses and resilience on system strengths. Comprehensive vulnerability analyses should consider the totality of the system, including technical aspects, socioeconomic factors, and governance issues (figure 1); however, such an exhaustive scope is rarely achievable with available data [5]. Birkmann [6] emphasizes that vulnerability assessments should not simply focus on system deficiencies but should also consider the capacities that vulnerable groups have developed to cope and survive within the context of change.
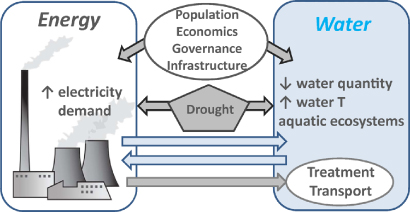
Figure 1. Interdependence of energy and water showing electricity use to treat and transport water and water use to cool thermoelectricity. Thermoelectric power plants burn fossil fuels (usually coal or natural gas in the US) or use nuclear fission or solar to create heat to boil water to produce steam that drives turbines that generate electricity. Although water or air can be used to condense the steam, water cooling enables higher energy efficiency. In 2011, thermoelectric plants in Texas represented 87% of net generation. Drought impacts both water and electricity by increasing electricity demand and reducing water supplies and increasing water temperatures that can impact aquatic species. In addition to direct impacts of drought on water and electricity demand/supply issues, many other factors need to be considered for a comprehensive vulnerability analysis. Such factors include (a) long-term changes in water and electricity demand related to population growth and economic development; (b) variations in fuel availability and prices; (c) long lifespan (30–50 yr) and high cost of power plants and legacy infrastructure; (d) technology advances for power plant generation and cooling; and (e) governance issues related to water and air emissions.
Download figure:
Standard image High-resolution imageDrought vulnerability of electricity generation is often evaluated using the concept of water scarcity, i.e., water demand exceeding supply. Applying the water supply stress index to the US showed that the semiarid western US has the highest water scarcity [7]; however, droughts have had a greater impact on power generation (apart from hydroelectricity) in the humid eastern half of the country [8]. The problem with relying solely on scarcity indices is that they do not account for the coping strategies that power plants have developed to deal with water stress [9]. Although regional analyses are valuable for initial assessments, as many have noted, water issues, like politics, are local and ultimately evaluation of water shortages for power plants needs to be conducted at the local scale.
At the power plant scale, primary factors contributing to drought vulnerability are disconnects between (a) demands for and (b) supplies of water and electricity. (a) Summer droughts generally increase electricity demands, mostly because of high temperatures and increased air conditioning [8]; increased electricity generation may also increase water demands for cooling. (b) Droughts also reduce water supplies, which can affect electricity supplies by:
- decreasing water availability for cooling, and/or
- increasing temperatures of power plant water intakes, and/or
- increasing temperatures of power plant water discharges, possibly exceeding regulatory thresholds.
These impacts have been documented in the US on the basis of analysis of 2006–2012 data [8, 10]. Problems with water quantity and discharge temperatures are associated mostly with once-through cooling rather than with recirculating wet cooling towers. Once-through systems have water withdrawal rates up to two orders of magnitude greater than the rates for recirculating wet cooling towers, and generally discharge the water to the source at a higher temperature than do cooling tower systems. Intake temperature issues are primarily associated with nuclear plants, which are subject to strict temperature regulations for safety reasons [11].
To understand the vulnerability of thermoelectric generation to drought, it is important to first understand how water and electricity systems differ.
- Generation. Electricity can be created or generated, whereas water generally cannot. However, saline water can be converted to fresh water (at a cost of energy) using desalination.
- Substitutability. There is no substitute for water for many uses; however, there are many different sources of electricity.
- Storage. Water can be stored in oceans, surface reservoirs, or in aquifers, whereas bulk storage of electricity is technologically infeasible for some forms of electricity and cost-prohibitive in most cases.
- Transport. Electricity can readily be transported, as is evident in the widespread electric grid with relatively low transmission losses (mean 7% for the US [12]) whereas transport of water through pipelines is limited.
The lack of cost-effective bulk storage for electricity means that real-time generation capacity needs to meet peak demands. In the US, these peaks typically correspond to a few hours of extreme temperature in late summer. While the interconnectedness of the electric grid allows electricity to be readily transported, this interconnectedness also means that problems in one region could impact the entire grid.
1.1. What is the status of knowledge on drought vulnerability of thermoelectric generation?
Few refereed publications deal directly with drought vulnerability of electric generation. Some of these papers are described in this section. Analysis of power plants in the western US indicates that hydroelectric generation is more drought vulnerable than is thermoelectric generation, and that the limited vulnerability of thermoelectric generation could be mitigated by purchasing electricity from the grid or from excess generation capacity [13]. Evaluation of power plant water intakes in the US showed that plant curtailments or shutdowns during droughts were generally not the result of shallow water intake depths, but more commonly by cooling water discharge temperatures exceeding regulatory thresholds, potentially impacting aquatic ecosystems [14].
Water–energy 'collision problems' related to droughts, identified by the Union of Concerned Scientists, were based on reductions in generation and shutdowns of plants from 2006 to 2012 [8]. Many of the problems were found in the eastern US where once-through cooling systems withdrawing water directly from rivers are prevalent; problems resulted from reduced water quantity and high water temperatures. The widespread 2012 drought, which, at its maximum extent, covered 65% of the US, caused problems mostly in the East and Midwest. Shutdowns or idling of generators at the Browns Ferry Nuclear Plant in 2007, 2008, 2011, and 2012 to avoid exceeding the 90° F temperature in the Tennessee River were mitigated by purchasing electricity from the grid, with additional costs of up to $1 million/day [8, 15]. High temperatures in Long Island Sound (76.7° F) exceeded the safety limit (75° F) for the Millstone Nuclear Power Plant, shutting down a generator for two weeks; however, ISO New England indicated there was excess generation capacity to cover the losses [8, 10, 16]. Nuclear and coal plants in Illinois (at least seven facilities) received thermal variances from the Environmental Protection Agency (EPA) to exceed regulatory discharge temperatures [8]. The 2003 drought and heat wave in Europe, which caused ∼70 000 deaths [17], resulted in nuclear power plants shutting down because of temperatures exceeding design values and discharge limits; however, some power plants in France and Germany continued to operate outside their design limits [18]. These examples demonstrate the range of problems and some coping strategies, including purchasing power from the grid, having excess generation capacity, and obtaining temperature variances. More recently, Electricité de France began evaluating the addition of chillers or helper cooling towers to chill part of the discharge stream in order to reduce discharge temperatures from their plants. Other strategies to increase drought resilience include conservation, increased renewables (wind and solar photovoltaic, which have no cooling water requirements), dry and hybrid (wet and dry) cooling, and use of alternative water sources, such as municipal waste water, brackish water, and seawater [10, 19]. Many studies project increases in intensity of droughts as a result of climate change; such droughts may have large-scale impacts on water supplies for thermoelectric cooling [20–22].
1.2. Purpose and scope
The purpose of this study was to address the following questions related to thermoelectric generation and drought:
- How does drought impact electricity and water demand versus supply?
- Are power plants more drought vulnerable in semiarid versus humid regions?
- How do power plants adapt to water shortages during drought?
- What governance issues affect drought vulnerability of power generation?
- What impact does increasing power generation from natural gas have on drought resilience?
- How can we increase resilience of the power plant fleet to water-related drought impacts?
Drought vulnerability was assessed by comparing demand versus supply to assess scarcity (scarcity occurs when demand exceeds supply). A unique aspect of this study is that we did not limit the analysis to evaluation of drought vulnerability, but extended the work to examine drought resilience related to coping strategies adopted by power plants in response to the 2011 drought, and longer-term trends to assess adaptation strategies. This study focuses on water for electricity generation during droughts which may involve tradeoffs with water supply for other sectors that are not fully explored in this analysis. Increasing power generation from natural gas may have important implications for drought resilience. Some aspects of the Texas system are specific to Texas, including:
- deregulation of electricity market and competitive markets;
- in-state generation/production;
- isolation of the primary electric grid (Electric Reliability Council of Texas, ERCOT) from other North American grids;
- rapid projected population growth: double that of the US (TX: ∼80%, 25 million 2010 to 46 million in 2060; US: 36%, 309 million in 2010 to 420 million in 2060); and,
- availability of federal and state databases providing reliable estimates of water use for drought (2011) and nondrought (2010) years [23], partially offsetting concerns about data reliability [24] (SI, section 1).
Other aspects of the Texas system can be used as a case study to assess water-related drought vulnerability for the US, such as:
- range of climates in Texas, from semiarid west to sub-humid east, mimicking the western versus the eastern climate of the US;
- range of fuel sources, generator technologies, and cooling systems, which generally match the US (supporting information, SI, figures S1 and S2); and,
- high percentage of natural gas used for thermoelectric generation in Texas (47% of fuel source, in 2011), which may serve as a future projection for the US, where generation from natural gas increased from 16% (2000) to 24% (2011) and is projected to increase to 30% (2040) [25].
Some aspects of the 2011 drought provide a model of an extreme case for the US, these aspects include:
- extent of the drought, with 88% of the state subjected to exceptional drought at its maximum extent (figure 2(a));
- severity of the drought, including record temperatures (≤100 days with ≥100° F (∼38 ° C) and record low precipitation (40% of long-term mean, 1896–2010); and,
- general isolation of Texas' power grid, precluding mitigation of the state's drought-related electricity shortages by the purchase of power from other regions (figure 2(b)).
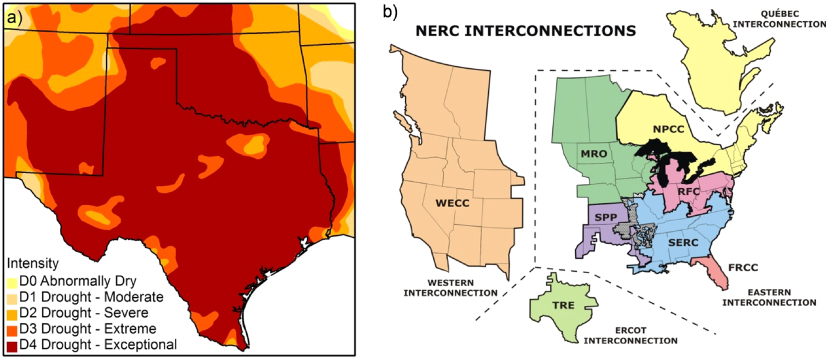
Figure 2. (a) Drought severity in Texas and surrounding states in October 2011 (http://droughtmonitor.unl.edu/) and (b) North American Electric Reliability Corporation (NERC) interconnections (www.ercot.com). The Electric Reliability Council of Texas (ERCOT) has limited connection to the western and eastern interconnections.
Download figure:
Standard image High-resolution image2. Methods
Our basic approach was to quantify electricity and water demand and supply to assess scarcity at the statewide scale and power plant scale (figure 3). The impact of water scarcity on power generation was also examined at the power plant scale in order to identify coping strategies. Longer-term trends in water use for thermoelectric generation were used to assess adaptive strategies to enhance drought resilience.

Figure 3. Methods used to assess vulnerability and resilience of power plants to water shortages during drought. Vulnerability was estimated by quantifying water demand from EIA, TCEQ, and TWDB databases, electricity demand from EIA, water supply from monitored reservoirs by TWDB relative to depth of cooling water intakes from EIA, and electricity supply from EIA. Drought impacts on demand and supply were evaluated by comparing results from the drought (2011) to nondrought (2010) periods. The impact of low water availability on power generation was evaluated by comparing generation from power plants on reservoirs with storage less than 50% of capacity. Drought resilience was evaluated by comparing net generation for power plants with low water availability in 2011 relative to 2010 and evaluating adaptation strategies. Long-term adaptation strategies were evaluated by examining trends in water demand and supply over decades.
Download figure:
Standard image High-resolution imageWe quantified water withdrawal and consumption for thermoelectric cooling for Texas for the 2011 drought year and compared the results with data for 2010, a nondrought ('baseline') year. Water use data were analyzed at the scale of individual power plants for the 423 power plants in the state. Data on water use were obtained from the Federal Energy Information Administration (EIA) and from state agencies, including the Texas Commission on Environmental Quality (TCEQ) and the Texas Water Development Board (TWDB). Detailed analysis of water use data for 2010 was described in a previous study [26], and in the current analysis, data were obtained from the same sources as much as possible to ensure that differences reflect water uses related to the drought rather than reflecting differences in reporting from various sources. Details of data acquisition and processing are described in supporting information (SI).
Information on reservoir water levels and storage for power plants was obtained from monitoring records from the TWDB. A total of 20 out of 43 reservoirs supporting power plants are monitored by TWDB. Water levels in reservoirs were compared with cooling water intake levels for 65 cooling systems at 60 Texas power plants, including those with once-through and cooling towers, on the basis of data from EIA in the 2011 database. Information on the source of water for the power plants (reservoirs (industrial, multipurpose), groundwater, municipal waste water, etc) was obtained from the EIA.
The impact of the 2011 drought on power plants subjected to low water availability (reservoirs ≤50% of capacity) was examined by comparing net electricity generation in 2011 relative to 2010. A threshold capacity of 50% was also applied in the drought analysis of Yan et al [27]. We assumed that, if net generation in 2011 was ≥ that in 2010, that power generation was not greatly impacted by the drought. This comparison between 2011 and 2010 seems appropriate as the previous load record in ERCOT was recorded in 2010 [28]. Adaptation strategies to drought-related water shortages at these plants were examined, in terms of water intensity of cooling systems, generator technologies, and procurement of additional water supplies. We also evaluated adaptation strategies through discussions with power plant operators. The impact of generation based on natural gas on drought resilience was also examined. Long-term trends in water use for thermoelectric generation were evaluated to assess approaches to enhancing drought resilience in the future.
Thermoelectric generation is also vulnerable to droughts because of temperature limitations on power plant discharges. These temperature regulations are set by the Texas Pollutant Discharge Elimination System (TPDES), which is administered by the TCEQ; however, permits must be reviewed and approved by the EPA. Using the EPA Environmental Compliance History Online (ECHO) database [29] and the EIA database, we reviewed temperature data for reservoirs containing power plants for compliance.
3. Results and discussion
In understanding drought vulnerability, a number of issues are important. Firstly, how does drought impact the demand versus the supply of both electricity and water? Are power plants more vulnerable to drought in semiarid versus humid regions? Has the industry developed adaptive strategies to cope with drought? How does increased use of natural gas affect drought resilience? Because governance issues (such as federal and state regulations) can overrule many other factors, how do these regulations impact drought vulnerability? The long lifespans of power plants (30–50 yr) emphasize the importance of examining how we can enhance drought resilience.
3.1. How did drought impact electricity and water demand versus supply?
Drought increased demand for thermoelectricity or net generation of electricity by 6% (411 TWh [2010] to 434 TWh [2011]) in response to record high temperatures and related increase in air conditioning in summer 2011 (SI, figures S3 and S4, tables S1, S2 and S3). Record peak electricity demand in early August 2011 was 4% higher than the previous record. Although electricity supplies were generally sufficient to meet the increased demand, ERCOT shed 1500 MW of interruptible load on 4 Aug to avoid imposing rolling blackouts after record peak electricity demands on 1–3 Aug (68 300 MW) [28].
The increased electricity demand increased water demand or consumption (evaporation) of cooling water by 9% (0.43 maf (0.53 km3) in 2010 to 0.47 maf (0.58 km3) in 2011) (SI, table S1). Water consumption for thermoelectric generation represented 3.5% of total estimated state water consumption in 2011 (13.3 maf), much less than water consumption for irrigation (71%) and municipal (17%) sectors (SI, figure S5). Comparison of consumption (0.47 maf) and reported withdrawal (∼25 maf) volumes for thermoelectric generation indicates that 98% of water withdrawn is returned to the source.
The 2011 drought markedly reduced water supplies for power generation and other sectors in the state. Statewide mean precipitation was 47% lower in 2011 than in 2010, representing only 40% of the long-term mean (1896–2011), the lowest annual precipitation since records began in 1896 (SI, figure S4). As a result, statewide runoff decreased by 88% in 2011 (0.49 in yr−1, 12.4 mm yr−1) relative to 2010 (4.0 in yr−1, 102 mm yr−1), also the lowest on record (<1 percentile) (SI, figure S6). Reduced runoff lowered inflows to reservoirs. Statewide reservoir water storage decreased by ∼30% from October 2010 to the minimum in November 2011 (∼18.8 maf, ∼23.2 km3), representing ∼58% of total conservation pool capacity (SI, figure S7). Reduced water supply was caused in part by lower precipitation and increased reservoir evaporation (14% higher in 2011 relative to 2010, attributed to higher temperatures and winds [30]) during the drought, but also by increased water use by other sectors, with 45% higher water consumption for irrigation and 32% higher for the municipal sector in 2011 than in 2010 (SI, figure S5 [31]). Reduced runoff resulted in increased water demand from reservoirs for many sectors. For example, water for the city of Austin (population 0.8 million) derived from run-of-river from the Lower Colorado River Authority (LCRA) decreased by 60% in 2011 relative to 2010, whereas water derived from reservoirs (Lakes Buchanan and Travis) increased by 120% (SI, figure S8). In addition, evaporation from the reservoirs (0.192 maf) slightly exceeded water use by Austin (0.185 maf) in 2011 [32].
Water storage declines during drought are superimposed on long-term storage declines, with per-capita reservoir storage decreasing by 45% since 1970 because very few reservoirs have been built since that time, although population grew by 126% (figure 4). Population growth is related to municipal water use, which approximately doubled between 1974 and 2010 (1.9–4.2 maf), with most of the increase in surface water use [33]. The State Water Plan indicates that municipal water demand should increase by ∼70% in the next 50 yr with the projected ∼80% increase in population (2010: 25 million; 2060: 46 million [34]).
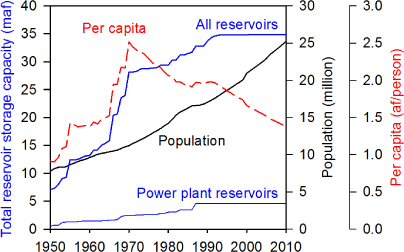
Figure 4. Evolution of Texas reservoir storage, population, and per-capita reservoir storage since 1950. Results show ∼45% decline in per-capita reservoir storage since 1970. Power plant reservoirs accounted for 13% of total Texas reservoir storage capacity in 2011.
Download figure:
Standard image High-resolution image3.2. Are power plants more drought vulnerable in semiarid versus humid regions?
Although water is scarcer in semiarid regions, power plants in the semiarid western part of Texas are not necessarily more drought vulnerable than those in the more-humid east because they have adjusted to low water availability, with essentially 100% of net generation relying on wet cooling towers, which operate with low water withdrawal rates (mean 0.23 gal kWh−1, 0.87 L kWh−1). In contrast, 70% of net thermoelectric generation in the eastern part of the state relies on once-through cooling, mostly from ponds/reservoirs, with about two orders of magnitude higher water withdrawal rates (mean 21.5 gal kWh−1, 81 L kWh−1) than required by wet cooling towers (figure 5).

Figure 5. Spatial distribution of thermoelectric power plant water withdrawals in Texas for plants using once-through and tower cooling systems. The locations of selected plants that use only gas combustion turbines or wind turbines and require no water for cooling are also shown. Inset graphs depict changes in surface water reservoir storage (RS), power plant water withdrawals (WW), and power plant water consumption (WC) west and east of the 100° W meridian, which generally marks the boundary between humid east and semiarid west. Note order of magnitude scale difference between west and east. Reservoir storage values represent totals from September 2010 (West 2.20 maf, East 23.86 maf) at the beginning of the drought and November 2011 (West 1.67 maf, East 16.51 maf) when statewide storage reached a minimum. Power plant withdrawal and consumption represent calendar year totals. Withdrawal for 2010 and 2011 was West: 0.04–0.04 maf; East: 26.1–25.0 maf, respectively, and consumption was West: 0.040–0.039 maf, East: 0.39–0.43 maf, respectively. Location references from text are Victoria and Sam Rayburn plants with once-through cooling directly from the Guadalupe River, and power plants on reservoirs whose storage dropped below 50% of capacity in 2011: Formosa plant on Lake Texana, Limestone plant on Lake Limestone, Morgan Creek plant on Lake Colorado City, and Martin Creek plant on Martin Creek Lake.
Download figure:
Standard image High-resolution imageThe source of water is also important for drought vulnerability, with those in the west relying on groundwater (52% of withdrawal) and treated municipal waste water (45% of withdrawal), which is originally derived from groundwater, whereas those in the east are more dependent on surface water (85%) (SI, table S4). Therefore, power plants in the semiarid west are not necessarily more drought vulnerable because they have pre-adapted to drought, with low water withdrawals and low reliance on surface water relative to those in the more-humid east. This dichotomy is similar to power production in western versus eastern US.
3.3. How did power plants adapt to reduced water supplies?
Power plants adapted to lower water availability (runoff and reservoir storage) by reducing water demand and increasing water supplies to mitigate drought impacts, as described in the following sections.
3.3.1. Reduced runoff.
Although statewide runoff was at a record low (∼1 percentile) in 2011 (SI, figure S6), only two power plants in the state (Victoria and Sam Rayburn) extract water for once-through cooling directly from a river, the Guadalupe River, without any pond/reservoir storage (#1, figure 5; SI, figure S9). This is in contrast to the eastern US, where many power plants obtain water directly from large rivers. Although runoff in the Guadalupe River decreased by 10 times in 2011 relative to 2010, net generation in the power plants did not decrease (SI, figure S10(a)). For example, the Victoria power plant adapted by switching from once-through cooling to wet cooling towers in the drought, reducing water withdrawal rates by ∼two orders of magnitude (25 to 0.3 gal kWh−1) (SI, figure S10(b)). Therefore, when there is insufficient water available, cooling towers can be operated at much lower flows than once-through systems. However, the Victoria and Sam Rayburn power plants are unusual in having both types of cooling systems. In the case of these plants, once-through cooling systems were installed in the mid-1950s and wet cooling towers in the late 1950s, most likely in response to low flows in the Guadalupe River in the late 1950s, which were less than those recorded in 2011.
3.3.2. Reduced pond/reservoir storage.
ERCOT indicated that if the 2011 drought persisted into 2012, ∼11 000 MW of Texas power generation (∼16% of ERCOT's total power resources) would be reliant on cooling from ponds/reservoirs that were at historically low levels [35], calling attention to the connection between reservoir levels and drought vulnerability. Pond/reservoir storage used for thermoelectric generation represents only 13% of total reservoir capacity in the state, including 25 industrial ponds and 17 multipurpose reservoirs, which are used primarily for municipal water supply (figure 4, SI, figure S11, tables S5 and S6). Although industrial ponds account for 80% of the net generation, they represent only 1.0 maf (1.2 km3), compared to 3.5 maf (4.3 km3) of water storage in multipurpose reservoirs.
Relying on reservoir storage data alone to assess drought vulnerability of power plants is insufficient because it ignores the strategies adopted by power plants to reduce drought impacts. Monitoring data (available for 20 out of 43 reservoirs) indicate that 20% of the power plant reservoirs (4 out of 20) dropped below 50% of their conservation capacity (capacity between flood pool and dead pool) in 2011: Colorado City (lowest, at 33% of conservation capacity in 2011 further declining to 26% in 2012), Lake Limestone, (49%), Martin Lake (44%), and Lake Texana (40%) (figure 4, SI, figure S12). However, net generation for power plants on these reservoirs in 2011 was similar to or higher than that in 2010, indicating that reservoir storage changes did not impact thermoelectric generation at an annual or monthly timescale. The impact of reservoir storage on power plants depends on the water supply/demand ratio for each plant. Power plants using water from Lakes Limestone and Texana both have cooling towers with low water withdrawal rates, and the capacities of their associated reservoirs were 10–75 times annual withdrawal rates in 2011 (SI, table S5); therefore, these plants are generally not impacted by reservoir storage reductions to the same degree as once-through cooling systems. Morgan Creek Power Plant in West Texas mitigated the drought impacts of low reservoir storage in the Colorado City reservoir by operating only the gas combustion turbine part of the plant, which requires no cooling water, and not the steam turbine part of the plant, which has a once-through cooling system. The power plant on Martin Lake mitigated the drought impact by completing a pipeline (∼8.5 mi long) to divert water from the Sabine River that originated in Lake Fork. Before 2011, the power plant had relied solely on runoff from its watershed (130 mi2; 340 km2 area) to replenish the lake (SI, table S5). Although the power plant had a water right to access water from Lake Fork for many decades, the pipeline took about a decade to permit and construct, emphasizing the long time required for infrastructure development. Some other ponds/reservoirs showed greater depletion during previous droughts in 1978, 2006, and 2009; however, power plant withdrawals were much lower than reservoir capacities for these reservoirs, affording large buffers of stored water. The relative levels of reservoirs and power plant intakes are shown for selected power plants with intakes closest to reservoir levels in SI, figure S13. Despite intake levels being close to reservoir levels for some power plants, net generation was generally higher in 2011 than in 2010, indicating that power plants adapted to low reservoir levels.
Although the 2011 drought was extreme, power plants may be more vulnerable to multi-year droughts. The drought of record in Texas is the 1950s drought, lasting from 1950 to 1956. A previous study evaluated the impact of the 1950s drought on projected 2030 water demands using the Soil and Water Assessment Tool (SWAT) hydrologic model; this study identified 14 reservoirs whose storage would drop below 50% (SI, table S7) [27]. Some of the reservoirs identified were similar to those impacted by the 2011 drought, having storage levels slightly less than or greater than the 2011 levels. However, 50% of the affected power plants have additional water sources, not included in the SWAT modeling (SI, table S7); therefore, the SWAT analysis may have overestimated drought impacts. Other issues with some of the remaining seven reservoirs are noted in the footnote to table S7. ERCOT evaluated the potential impact of a three-year drought, utilizing detailed analysis of drought vulnerability from reservoir storage and temperature discharge issues [27], and suggested ∼7000 MW loss of generation capacity.
3.3.3. Power plant discharge temperature issues.
In addition to water quantity issues, power plants are also drought vulnerable when discharge temperatures exceed regulatory limits (SI, section 2). Discharge temperature issues generally only apply to power plants using once-through cooling, because plants with wet cooling towers discharge little or no water. No temperature discharge citations were recorded during the 2011 drought, possibly because most of the reservoirs in question are industrial ponds (27 out of 35) with little discharge from ponds to rivers/reservoirs and high evaporation may have maintained lower temperatures (EPA ECHO database for 35 power plants on 32 ponds/reservoirs [29]). Only two plants had temperature violations cited in the ECHO database for the period of record from 2007 to 2011: R W Miller and Coleto Creek, with temperature limits for Coleto Creek subsequently increased. Three additional power plants on industrial cooling ponds have historically operated at or very close to their allowable limits, including W A Parish on Smithers Lake, Comanche Peak Nuclear Plant on Squaw Creek Reservoir, and Martin Creek Power Plant on Martin Creek Lake, all characterized by low reservoir capacity/withdrawal volume ratios (0.02–0.07) (SI, tables S5 and S6). Power plants can also add cooling towers, termed helper cooling towers or chillers, to supplement cooling provided by reservoirs and alleviate discharge temperature issues (e.g., Wilkes and Welsh power plants).
3.4. How does increased use of natural gas for power generation affect drought resilience?
Recent increased production and low price of natural gas have revolutionized the electric power industry, with natural gas plants representing 47% of net generation in 2011. Natural gas is the only fuel that can readily support the three basic generator technologies (steam turbine, ST; gas combustion turbine, CT, and combined cycle, CC). Generator technology is the primary control on water consumption, with highest consumption for steam turbines (STs), no cooling requirement for traditional gas combustion turbines (CTs), and cooling requirements for NG combined cycle (CC) plants being about 1/3rd of requirements for steam turbines because they generally combine 2 CTs to 1 ST [26] (table 1, figure 6). Switching from NGST to NGCC generators represents increasing energy or thermal efficiency, because waste heat from CTs is used in STs in NGCC plants, reducing water consumption relative to ST generators by about a factor of 3 (table 1).
Table 1. 2011 water consumption and withdrawal rates or intensities for the Texas power plant fleet. Note the main control on withdrawal rates is the cooling system (once-through about an order of magnitude higher than tower) (e.g. 138 NGCC, OT versus 1.02 NGCC, T) and main control on consumption is generator with about a factor of three difference between combined cycle and steam turbine plants (e.g. 0.71 NGST, T versus 0.22 NGCC, T). (Note: NG: natural gas, ST: steam turbine, CC: combined cycle, OT: once-through, T: tower.)
| Fuel | Generator | Cooling | Consumption | Withdrawal | ||
|---|---|---|---|---|---|---|
| (gal kWh−1) | (L kWh−1) | (gal kWh−1) | (L kWh−1) | |||
| Nuclear | ST | OT | 0.46 | 1.74 | 37.1 | 140 |
| Coal | ST | OT | 0.54 | 2.04 | 36.6 | 139 |
| T | 0.65 | 2.46 | 0.76 | 2.88 | ||
| NG | ST | OT | 0.44 | 1.67 | 124 | 469 |
| T | 0.71 | 2.69 | 0.75 | 2.84 | ||
| CC | OT | 0.18 | 0.68 | 36.4 | 138 | |
| T | 0.22 | 0.83 | 0.27 | 1.02 | ||
| Alla | ST, CC | OT, T | 0.41 | 1.55 | 22.0 | 83.3 |
| Allb | Allb | Allb | 0.35 | 1.32 | 18.8 | 71.1 |
aNuclear, coal, and natural gas (371 TWh generation). bStatewide power plant fleet rates, including all fuel, generator, cooled, and non-cooled types (434 TWh generation).
Natural gas combustion turbines (NGCT) have been increasing steadily with no water requirements. In addition, net generation from NGCC generators increased by about an order of magnitude, from 7 to 75 TWh, from 1999 to 2005. Most of this new generation has been based on cooling towers rather than once-through systems, because of limited unappropriated water to support large water withdrawals for once-through systems. These changes in fuel, generator technology and cooling systems represent significant advantages for drought, by:
- reducing water withdrawal by 1–2 orders of magnitude for wet cooling towers relative to once-through systems;
- reducing water consumption by about a factor of 3 relative to traditional steam turbines;
- allowing power plants to operate either with water (NGCC) or without water (NGCT); and,
- ability to operate as base load or as peaking plants (NGCT) to complement increasing wind energy.
Statewide water consumption and withdrawal volumes and rates decreased by ∼15% from 2000 to 2003 (figure 7). These reductions in water use are consistent with the findings in previous studies [36]. These trends in reducing water consumption to continue through 2030 based on ERCOT projections with the Business As Usual (BAU) scenario that includes 65% of new generation from NGCC plants and 35% from NGCT. Although previous studies on drought in the western US suggested that NGCC plants could mitigate drought impacts by operating using only their CTs, resulting in no cooling water requirements during droughts [37], most plants are not constructed to do this and retrofitting would require a large investment.

Figure 6. Water (a) consumption and (b) withdrawal rates in 2011 by generator technology and cooling system type for the Texas thermoelectric power plant fleet. Mean values noted in figure are in gal kWh−1. Points represent mean values weighted by net generation. Shaded areas represent approximate range of values (0.1–0.9 percentile). Water consumption is controlled primarily by generator technology, with steam turbine (ST) generation having the highest consumption, natural gas consumption turbine (NGCT) generation having no consumption, and natural gas combined cycle (NGCC) generation having intermediate consumption because NGCC generation consists of ∼2 CTs to 1 ST. Note log scale for water withdrawals, which are controlled primarily by cooling technology with once-through cooling systems having 1–2 orders of magnitude higher withdrawal than cooling towers.
Download figure:
Standard image High-resolution image
Figure 7. Historical trends in Texas (a) net electric generation, (b) water consumption, and (c) water withdrawal. Hindcast estimates of water consumption and withdrawal are based on current water intensities according to fuel types, including nuclear, coal, and natural gas consumption and withdrawal intensities (table 1) applied to historical net electric generation by fuel type [25]. Note sharp declines in water consumption and withdrawal volumes and rates around 2000 which reflect reductions in water use related to increases in natural gas combined cycle plants with cooling towers.
Download figure:
Standard image High-resolution image
In 2011, NGCC with cooling towers generated 83 TWh of electricity, consuming ∼55 000 af of water (0.22 gal kWh−1; SI, table S1a). In contrast, if the same amount of energy had been produced by coal steam turbine plant (0.65 gal kWh−1), ∼3 times as much water would have been consumed at the power plant for cooling (∼160 000 af of water) using statewide estimates. The amount of water saved by using NGCC rather than coal steam turbine plants (∼100 000 af) is about 25–50 times the amount of water required (∼2000–4000 af) to hydraulically fracture and produce the natural gas (700 e12 Btu) used to generate this electricity, based on 1–2 gal to extract 1 million Btu of gas in Texas and assuming a thermal energy efficiency of NGCC plants of 44% efficient based on data for Texas [38]. Use of natural gas provides additional co-benefits in terms of CO2 emissions: natural gas emits about half of the CO2 of coal [39]. Recent reductions in CO2 emissions in the US have been attributed to increasing power production from natural gas [40].
3.5. How do governance issues impact drought vulnerability?
Governance issues can have a significant impact on power generation with both state and federal regulations playing a role. Examples of governance issues related to drought include the Governor's drought proclamation (section 418.016 of the Texas Government Code) which allows suspension of all rules and regulations that may inhibit or prevent prompt response to this threat for the duration of a state of disaster. As a result of the drought proclamation, temporary water permits were granted to some power plants, including Lake Bastrop, Cedar Creek Reservoir, Martin Lake, and Trinidad Lake. Because surface water is regulated under the Prior Appropriation Doctrine where first in time is first in right, TCEQ suspended junior water rights use (∼950 water rights), mostly in the Brazos, Colorado, and Neches River basins, during the 2011 drought in order to support the ability of senior water rights users to continue diversion elsewhere in the basin. Five junior water rights for thermoelectric generators and three municipal water rights were exempted from suspension because of public health and safety concerns; however, TCEQ's authority to exempt these junior water rights holders is currently being challenged, with an initial court ruling indicating that the TCEQ does not have this authority [41].
In Texas, electric generation was deregulated in response to Senate Bill 7 on 1 January 2002. Although many new power plants were built from 1998 to 2004 related to deregulation, very few have been constructed since then. ERCOT includes a reserve margin of 13.75% to ensure sufficient power to meet extreme weather and unplanned outages. The reserve margin is defined as follows:

Reserve margin reflects the percentage that available capacity is expected to exceed forecasted peak demand and provides a buffer during drought [42]. However, deregulation makes it difficult to control construction of new generation capacity and the reserve margin.
Senate Bill 7 also included the Texas Renewable Portfolio Standard, with a target of 10 000 MW by 2025. As a result, wind generation, having no cooling water requirement, has markedly increased within the past decade, with ∼10 000 MW of installed wind capacity by 2010, 15 yr ahead of the target set for 2025 and representing more than double the generation capacity installed in any other state at the end of 2012 (12 200 MW) [43]. However, because of the intermittency of wind, ERCOT only counts ∼15% and ∼30% of the nominal capacity of inland and coastal wind generation, respectively. Approximately $7 billion is being invested in lines to transmit electricity (Competitive Renewable Energy Zones, CREZ) from wind energy in West Texas to demand and population centers in Central Texas [42].
Because of the water–energy nexus, regulations reducing electric generation capacity could have a large impact on future drought vulnerability. ERCOT indicated that EPA regulations for cooling water intake structures (CWIS) under the Clean Water Act (Section 316B, to minimize impingement and entrainment of fish) could mandate cooling towers instead of once-through cooling ponds to reduce water withdrawals [44]. The cost of retrofitting 39 power plants in Texas that have once-through cooling with cooling towers was estimated to be $12.5 billion [44]. ERCOT indicated that mandated cooling towers would likely result in retirement of ∼10 000 MW of older natural gas steam turbine (NGST) units, ∼10% of total generation capacity in the state [45]. These units are close to the end of their useful life and would not support the capital costs of retrofitting them with cooling towers. Loss of this generation capacity would reduce the reserve margin to zero, greatly increasing drought vulnerability.
3.6. How can we enhance resilience of thermoelectric generation to droughts?
Various approaches can be used to enhance drought resilience of power plants. Many studies emphasize the high costs associated with retrofitting the existing fleet [46] and opportunities for drought proofing the system may lie more in choices for new generation capacity rather than modifying the existing fleet. The basic approaches evaluated in this section include reducing demands (conservation), increasing supplies of water and electricity, and storing more water to buffer against the impact of future droughts.
3.6.1. Reducing electricity and water demands.
Reducing or conserving electricity saves water and vice versa. The major issue for power plants is the need to meet peak demands during the hottest time of the year. Many power plants have contracts with industry to shift peak loads, e.g., CPS Energy with San Antonio Water System. ERCOT includes these demand-response strategies in their long-term projections (500 MW for industrial and 2200 MW for residential) [47]. Smart grids are being strongly promoted for improved industrial and residential demand-side management. These efforts could be coordinated to use less water-intensive generation from renewables or low water intensity thermoelectric generation.
Water withdrawal demands can be reduced by one to two orders of magnitude by switching from once-through cooling ponds to wet cooling towers (table 1, figure 5). Most new plants built since the 1980s and 1990s in Texas and the US have installed wet cooling towers rather than once-through cooling, because of reduced access to water and EPA regulations to protect aquatic species (EPA, 316B). The effect of this shift in cooling systems can be seen in stabilization of water withdrawals and large reductions in withdrawal rates in the US since the 1980s [48]. As noted earlier, retrofitting existing once-through systems would result in premature retirement of ∼10 000 MW of old NGST plants, ∼10% of total capacity in Texas [47]. The question is whether replacements for plants currently using once-through cooling will continue to use once-through cooling or switch to wet cooling towers. This is difficult to determine; however, currently a natural gas steam turbine (NGST) power plant (TC Ferguson Plant) is being replaced with a natural gas combined cycle (NGCC) plant that will continue to use once-through cooling [49]. Although dry cooling would greatly reduce water requirements, these systems have high capital costs and are less energy efficient than wet cooled systems. Comparisons of estimated costs of water savings for NGCC plants with wet and dry cooling towers were up to 6 times more expensive than typical water rates for residential or industrial customers [50]. There are only two dry cooling systems in Texas; however, some of the planned new power plants include dry cooling (e.g., Tenaska Power Plant, 900 MW Coal ST). ERCOT [47] evaluated eight different scenarios for future electricity projections, considering variable fuel pricing, environmental regulations, drought conditions, etc. The BAU scenario included mostly NGCC plants while the remaining seven scenarios included mostly renewables with minimal water requirements (wind and solar): one scenario had up to 70 000 MW of wind. The analysis indicated that the cost of water would need to increase to $2.50 MW−1 to support an NGCC plant with dry cooling. The importance of assessing the cost of conserved water to evaluate different drought proofing options was also emphasized in previous studies [51].
3.6.2. Increasing electric and water supplies.
Electric and water supplies can be increased by (a) purchasing from another system; (b) changing pricing; or (c) storing either electricity or water. (a) Impacts of droughts on power plants in the US are generally mitigated by purchasing power from the grid [13]; however, this was not feasible in 2011 owing to the statewide extent of the drought and only 3000 MW of connection between ERCOT and other grids (figure 2). However, more spatially limited droughts may be accommodated by purchasing from different regions within the ERCOT grid. (b) To increase electricity generation during peak demand, the Public Utility Commission of Texas (PUCT) voted to increase the scarcity price index signal by raising the system wide offer cap from $3000 to $9000 by June 2015. (c) Although electricity storage is limited, a new compressed air energy storage (CAES) plant (317 MW) will be installed in North-Central Texas, west of Dallas. Increasing the reserve margin can provide additional buffer during drought. Estimates by the North American Electric Reliability Corporation (NERC) show that the ERCOT reserve margin was slightly less than the target reserve margin in summer 2012, whereas reserve margins in some other regions in the US greatly exceed their targeted amounts (e.g., by more than a factor of 2 throughout much of the southeastern US) [52].
It is difficult to increase water supplies to reduce drought vulnerability because surface water is mostly over appropriated with the exception of the Sabine and Sulphur River basins in East Texas and groundwater resources are also being depleted in many aquifers (SI, figure S14). Purchasing appropriated water in irrigated areas could alleviate drought impacts in some river basins, particularly where power plants and irrigated areas are collocated, mostly near the coast [27]. However, most irrigation occurs in the Texas High Plains, using water mined from the High Plains aquifer, which includes the Ogallala aquifer, and is not co-located with areas of high thermoelectric generation. Increasing water storage is an important part of the Texas State Water Plan, which includes construction of 26 major new reservoirs (≥5000 af of storage), many of which are off-channel reservoirs that are more readily permitted (Federal 404 permit not required), and the expansion of pipelines, and building of additional infrastructure to transport surface water to points of use on the basis mostly of existing water rights, representing ∼50% of the water volume for the 2060 strategies [34]. Conjunctive use of surface water and groundwater (i.e., use of surface water during wet periods, transitioning to groundwater during droughts) could also be used to reduce drought vulnerability in the eastern part of Texas. Current thermoelectric generation uses predominantly surface water in Texas (85% of withdrawals in 2011), with groundwater used for limited generation in the more semiarid western part of the state (SI, table S4).
Many existing power plants are located over major or minor aquifers. The TWDB has developed groundwater models for the major aquifers of the state to support water management and planning. These models can be used to provide preliminary analyses of groundwater availability. However, there are ∼100 Groundwater Conservation Districts (GCDs) in the state, imposing varying regulations, and some offer permits of only 1–5 yr duration. One power plant we visited was surrounded by 3 GCDs, with varying rules and regulations, making it very difficult to commit to groundwater. Policies would have to be modified to promote joint management of surface water and groundwater. Another option for water storage is underground aquifers, which would avoid the problems of reservoir evaporation. This approach, known as aquifer storage and recovery (ASR) or managed aquifer recharge (MAR), has been applied to a limited extent in Texas but much more in other states, including California, Arizona, and Florida [53, 54]. In addition, many of the water contracts for power plants are 'take or pay' contracts, which means that the power plants pay for contracted water whether they use it or not. Excess contracted water from wet years could be stored in aquifers for future droughts; however, it may be logistically very difficult. Unappropriated storm water provides an additional water source that could be stored underground.
3.6.2.1. Non-traditional or non-fresh water supplies
Currently, there is strong interest in promoting alternative or 'non-traditional' water sources, including municipal wastewater (MWW) or 'reclaimed water', brackish water, and seawater [20, 19]. MWW reuse represented 14% of water consumption and 10% of water withdrawal for thermoelectric generation in 2011, mostly in West Texas (51% of consumption) (SI, table S4). For cooling, CPS Energy in San Antonio switched from 100% Edwards Aquifer groundwater in the early 1960s to, in 2011, 98% MWW from San Antonio Water System, totaling 0.05 maf (0.06 km3). The amount of MWW available ranges from ∼50% of power plant water use in ERCOT based on discharge water from waste water treatment plants within a 10 mi radius from power plants [55], to much lower values when current reuse and discharge to perennial streams are considered [27]. The Texas State Water Plan projects an increase in MWW reuse from 0.1 maf (0.1 km3) in 2010 to 0.9 maf (1.1 km3) by 2060, potentially increasing water availability for power plants [34].
Inland brackish water provides an alternative to freshwater resources. Analysis of brackish groundwater in the state suggests that there is ∼2.7 billion af (3300 M km3) in place; however, attempts to produce brackish water in a pilot study in West Texas were unsuccessful in terms of yield and quality issues for desalination [56, 57]. While the perception exists that there is a sea of brackish water in the subsurface, there is very little information on brackish water production and quality. Seawater for power generation currently represents only 1–2% of water withdrawal and consumption in Texas, in contrast to 30% of withdrawals in the US as a whole, mostly in California and Florida [2].
Several technological advances are being researched for using these non-traditional water sources for electricity generation [51]. Additional energy penalties are incurred because energy is required to treat and transport the water. Costs for various water sources in the ERCOT region have been estimated to range from $10–$100/af (1233 m3) for groundwater, $100–$1000/af for MWW, and ≥$1000/af for brackish water [27]. In addition to simply using these water sources for power plant cooling, integration of electricity generation and water treatment may provide new fresh water, such as integration of wind energy and brackish water desalination in West Texas [58] and a natural gas power plant and desalination by the Guadalupe Blanco River Authority [59].
4. Conclusions
Projected increases in frequency and extent of droughts raise concerns about the impact of water shortages on thermoelectric generation.
- (1)While spatial and temporal water scarcity is often used to infer drought vulnerability, this study shows that power plants in water-scarce semiarid settings are not necessarily more drought vulnerable because they are generally pre-adapted to low water availability, with low water withdrawal and more-reliable water sources (groundwater and municipal waste water) than power plants in humid settings with high water withdrawal of surface water. These differences between semiarid western Texas and more-humid eastern Texas mirror the differences between the western and eastern US.
- (2)Although the 2011 drought resulted in only a 6% increase in net generation with a corresponding 9% increase in water consumption for this increased generation compared to 2010, water supplies decreased sharply, with a 30% decline in monitored reservoir storage for power plant cooling.
- (3)Power plants subjected to large reductions in runoff and reservoir storage adapted by switching from once-through cooling to cooling towers, switching from steam turbines to gas combustion turbines, and piping additional water to a power plant.
- (4)Increasing generation from natural gas plants since the late 1990s enhances drought resilience of the power plant fleet by reducing the water demand, allowing power plants to operate without (gas combustion turbines) and with (combined cycle) water, and as baseload and peaking (combustion turbines) plants to complement intermittency of wind. These changes in water and electricity in Texas may also apply to the US, which has seen a 30% increase in natural gas consumption for electric power production since 2005.
- (5)Various approaches can be used to enhance drought resilience, including reducing demand (conservation) and increasing supplies of water and electricity.
This analysis demonstrates the complexities associated with evaluation of drought vulnerability of thermoelectric generation, the importance of considering short-term coping strategies, and identifying long-term adaptation strategies to enhance drought resilience.
Acknowledgments
We would like to acknowledge financial support for this study from the State of Texas Comptrollers of Public Accounts and from The University of Texas Jackson School of Geosciences. The study benefited greatly from meetings with power plant operators, river-basin authorities, EPRI researchers, and ERCOT staff. Ruben Solis and John Zhu (TWDB) provided data on reservoir evaporation. Chris Linendol (TCEQ) and George Ward (Center for Research in Water Resources, The University of Texas at Austin) provided insights into discharge temperature regulations. We are also very grateful for NRG for hosting a visit to their Limestone Power Plant. Discussions with Dr Carey King (Energy Institute—The University of Texas at Austin) were very valuable for understanding processes related to power plant operations. Publication authorized by the Director, Bureau of Economic Geology.