

Abstract
Different methods have been developed for measuring carbon stocks and fluxes in the northern high latitudes, ranging from intensively measured small plots to space-based methods that use reflectance data to drive production efficiency models. The field of dendroecology has used samples of tree growth from radial increments to quantify long-term variability in ecosystem productivity, but these have very limited spatial domains. Since the cambium material in tree cores is itself a product of photosynthesis in the canopy, it would be ideal to link these two approaches. We examine the associations between the normalized differenced vegetation index (NDVI) and tree growth using 19 pairs of tree-ring widths (TRW) and maximum latewood density (MXD) across much of Siberia. We find consistent correlations between NDVI and both measures of tree growth and no systematic difference between MXD and TRW. At the regional level we note strong correspondence between the first principal component of tree growth and NDVI for MXD and TRW in a temperature-limited bioregion, indicating that canopy reflectance and cambial production are broadly linked. Using a network of 21 TRW chronologies from south of Lake Baikal, we find a similarly strong regional correspondence with NDVI in a markedly drier region. We show that tree growth is dominated by variation at decadal and multidecadal time periods, which the satellite record is incapable of recording given its relatively short record.
Export citation and abstract BibTeX RIS

Content from this work may be used under the terms of the Creative Commons Attribution 3.0 licence. Any further distribution of this work must maintain attribution to the author(s) and the title of the work, journal citation and DOI.
1. Introduction
A careful accounting of terrestrial carbon is a major and ongoing goal in the biogeosciences (Schimel 1995). The magnitude and the uncertainty of stocks and fluxes in the northern high latitudes are of special concern given the potential for dramatic change to the net ecosystem exchange of carbon in a changing climate (McGuire et al 2009). Yet measuring those carbon pools over large spatial extents (∼105 km2) and over reasonably long time periods (∼102 years) remains difficult and estimates remain uncertain (Houghton et al 2007). Ecosystem ecologists have long been concerned with understanding the global carbon cycle and have used tools from remote sensing to quantify plant production by linking the amount of photosynthetically available shortwave radiation absorbed by vegetation to gross primary productivity (reviewed in Chapin et al 2006). At the same time, dendroecologists have been using the radial increment in trees to estimate tree or ecosystem production contributed by wood growth via standardized tree-ring chronologies or by time series of basal area increment (e.g., Graumlich et al 1989, Biondi 1999, Shashkin and Vaganov 2000) and less often, by using allometric equations that link carbon accumulation in the stem to biomass accumulation in the plant (e.g., Metsaranta and Lieffers 2009, Alexander et al 2012). Both methods have their strengths. The ecosystem ecology approach is able to cover very large contiguous areas but relies on a short temporal record. Conversely, the dendroecological method is based on direct measurements of a major component of net primary production, and can extend over centuries, but uses disjunct and uneven sample distribution over a small fraction of the area of interest. If it were possible to marry these two approaches we would be able to make inference about low frequency variability in ecosystem productivity (decadal to centennial) while gaining understanding about spatial variability across the landscape. However, combining the remote sensing approach and the point-based method from tree rings is difficult because they deal with different aspects of plant growth.
Developing better understanding of carbon stocks and carbon fluxes is important globally but in the northern high latitudes in particular. After all, the role of northern forests in modulating atmospheric carbon dioxide concentrations is well documented (Keeling et al 1996, Myneni et al 1997) as is the importance of energy partitioning between bright tundra and dark trees (Loranty et al 2011). Recently Beck et al (2013) published a study establishing an association between the normalized differenced vegetation index (NDVI) and two separate tree-ring metrics: the width of tree rings (TRW) as well as the maximum latewood density (MXD) across large regions of Alaska and Canada but this association has not been analyzed as comprehensively in northern Eurasia (but see Shishov et al 2002, Lopatin et al 2006 for work in Eurasia and Berner et al 2011 who analyzed sites from Eurasia and North America). One of the goals of the Northern Eurasia Earth Science Partnership Initiative is to further develop connections and collaborations between the North American and Eurasian earth science communities in understanding cold, carbon-rich landscapes (Groisman et al 2009). As such, we have one broad objective in this letter: we will evaluate whether a productivity index from satellites (NDVI) correlates with the radial growth of trees across a broad swath of Northern Eurasia. We will assess this association for TRW and MXD at relatively fine (102 km2) and coarse (105 km2) spatial scales.
2. Methods
2.1. Study sites
In this study we used 19 pairs of TRW and MXD data sets from the Siberian taiga (38 total chronologies, figure 1, table 1). The material was of five species from three genera (one each of Pinus, Picea and three Larix species). The data sets were taken from a group of 26 available pairs developed by one of us (AVK) for use in dendroclimatology. The seven pairs of data sets not used were those with fewer than ten samples for one or both variables (TRW and MXD) remaining after quality control as described in the supplemental material (available at stacks.iop.org/ERL/8/035034/mmedia). In addition to these pairs of TRW and MXD data sets, we examined 21 TRW data sets of Pinus sylvestris from the dry region of Buryatia, south and east of Lake Baikal (Andreev et al 2001, Shishov et al 2002). See table S2 in the supplementary material (available at stacks.iop.org/ERL/8/035034/mmedia).
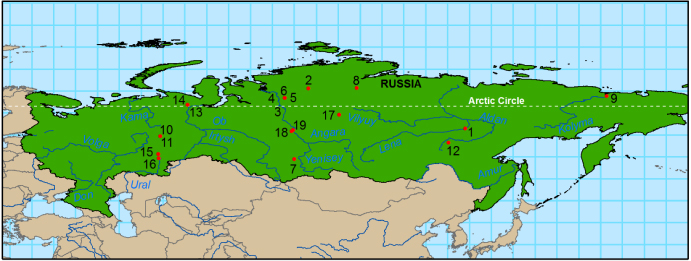
Figure 1. Nineteen paired sets of tree-ring widths and maximum latewood density spanning 100° of longitude and 16° latitude and five species were used across Siberia. Cross-reference to table 1.
Download figure:
Standard image High-resolution imageTable 1.
Descriptive statistics for the nineteen pairs of TRW and MXD tree-ring data from Siberia. Species codes: PISY (Pinus sylvestris), LAGM (Larix gmelinii), PIOB (Picea obovata), LASI (Larix sibirica), LACA (Larix cajanderi). n: number of cross-dated tree-ring series at each site. rTRW|MXD: correlation between the TRW and MXD chronologies over the years in the period column.  : mean interseries correlation of pre-whitened series. EPS: expressed population signal. ϕ: first-order autocorrelation.
| ID | Site | Long | Lat | Species | Period | nTRW | nMXD | rTRW|MXD |

|

|
EPSTRW | EPSMXD | ϕTRW | ϕMXD |
|---|---|---|---|---|---|---|---|---|---|---|---|---|---|---|
| 1 | BALi | 129.08 | 61.34 | PISY | 1880–2007 | 11 | 11 | 0.75 | 0.54 | 0.42 | 0.93 | 0.89 | 0.29 | 0.28 |
| 2 | BAVga | 93.17 | 70.50 | LAGM | 1880–2002 | 14 | 19 | 0.75 | 0.69 | 0.67 | 0.97 | 0.97 | 0.20 | −0.11 |
| 3 | KH1oa | 87.83 | 68.33 | PIOB | 1880–1998 | 43 | 46 | 0.49 | 0.46 | 0.46 | 0.97 | 0.97 | 0.27 | −0.09 |
| 4 | KH1sa | 87.83 | 68.33 | LASI | 1880–1998 | 39 | 38 | 0.80 | 0.61 | 0.53 | 0.98 | 0.97 | 0.35 | 0.06 |
| 5 | KH9oa | 87.83 | 68.33 | PIOB | 1880–1998 | 42 | 46 | 0.32 | 0.43 | 0.46 | 0.97 | 0.97 | −0.02 | −0.10 |
| 6 | KH9sa | 87.83 | 68.33 | LASI | 1880–1998 | 29 | 26 | 0.87 | 0.52 | 0.48 | 0.96 | 0.95 | 0.34 | 0.03 |
| 7 | KHAs | 89.97 | 54.40 | LASI | 1880–2005 | 20 | 18 | 0.85 | 0.70 | 0.56 | 0.98 | 0.96 | 0.23 | 0.19 |
| 8 | KOTga | 104.25 | 70.60 | LAGM | 1880–2006 | 34 | 32 | 0.54 | 0.56 | 0.53 | 0.98 | 0.97 | 0.20 | 0.02 |
| 9 | NSSc | 161.42 | 68.75 | LACA | 1880–2007 | 18 | 19 | 0.77 | 0.60 | 0.56 | 0.97 | 0.97 | 0.12 | −0.13 |
| 10 | NURo | 59.27 | 59.63 | PIOB | 1880–2003 | 11 | 15 | 0.04 | 0.47 | 0.59 | 0.90 | 0.95 | 0.38 | −0.11 |
| 11 | NURs | 59.27 | 59.63 | LASI | 1880–2003 | 16 | 7 | 0.47 | 0.62 | 0.70 | 0.96 | 0.94 | 0.34 | 0.02 |
| 12 | PL5o | 125.22 | 58.18 | PIOB | 1880–1998 | 22 | 11 | 0.80 | 0.35 | 0.45 | 0.94 | 0.91 | 0.56 | 0.05 |
| 13 | PURo | 65.58 | 66.80 | PIOB | 1880–2001 | 29 | 26 | −0.33 | 0.38 | 0.48 | 0.94 | 0.96 | −0.03 | −0.01 |
| 14 | PURs | 65.58 | 66.80 | LASI | 1880–2001 | 22 | 22 | 0.25 | 0.6 | 0.60 | 0.98 | 0.97 | 0.22 | 0.14 |
| 15 | SURo | 58.87 | 55.55 | PIOB | 1880–2001 | 30 | 31 | 0.08 | 0.48 | 0.59 | 0.96 | 0.98 | 0.66 | −0.13 |
| 16 | SURs | 58.92 | 54.55 | LASI | 1880–2002 | 21 | 26 | 0.73 | 0.69 | 0.69 | 0.98 | 0.99 | 0.38 | 0.36 |
| 17 | TURga | 100.23 | 64.53 | LAGM | 1880–2006 | 26 | 16 | 0.84 | 0.47 | 0.36 | 0.96 | 0.91 | 0.25 | 0.16 |
| 18 | ZOTi | 89.38 | 60.75 | PISY | 1880–1999 | 43 | 40 | 0.79 | 0.32 | 0.34 | 0.95 | 0.95 | 0.51 | 0.33 |
| 19 | ZOTo | 89.75 | 61.00 | PIOB | 1880–2005 | 18 | 17 | 0.34 | 0.36 | 0.37 | 0.92 | 0.91 | 0.38 | −0.08 |
aIndicates that series was used in the PCA for the regional correlation map (figure 3).
2.2. Tree-ring processing
We built mean-value chronologies for TRW and MXD at each site. Each series was detrended using a cubic-smoothing spline with a frequency response of 50% at a wavelength of 2/3 of the series length. We then built a chronology using Tukey's biweight robust mean. (Readers unfamiliar with tree-ring detrending and chronology development can refer to Cook et al 1990.)
We also performed principal components analysis on the TRW data from Buryatia and from seven sites in the paired TRW and MXD data set in order to assess the regional correlation with a larger swath of July NDVI.
2.3. Spatial data
We used the GIMMS NDVI3g data from the advanced very high resolution radiometers (AVHRR) onboard a series of NOAA satellites as part of the Global Inventory Modeling and Mapping Studies project. See Tucker et al (2005) for description of the original NDVIg data and Xu et al (2013) who give a thorough description of the updated NDVI3g data. The GIMMS NDVI3g data have a spatial resolution of 8 km by 8 km per pixel and a temporal resolution of 15-days resulting in two maximum-value NDVI composites per month. The NDVI record begins in July 1981. We analyzed data from 1982 (the first complete year of the NDVI data) through the end of 2009, which was the end year of our most recently collected tree-ring data set.
3. Results
Our 19 tree-ring data sets of paired ring width and density measurements were comprised of five species and span much of Siberia (figure 1, table 1). TRW and MXD tended to correlate well at each site with median r = 0.73 and interquartile range (IQR) 0.33–0.80. The individual sites had high correlation between series for ring widths (median  , IQR 0.45–0.61) and for maximum latewood density (median
  , IQR 0.46–0.59). The expressed population signal was similarly high for the ring widths (median EPS = 0.96, IQR 0.94–0.97) and for maximum latewood density (median EPS = 0.95, IQR 0.93–0.97). As expected, median first-order autocorrelation was higher for tree-ring widths (ϕ1 = 0.29, IQR 0.21–0.38) than for maximum latewood density (ϕ1 = 0.02, IQR −0.10–0.15).
When subset to the satellite record from 1982 to the end of the tree-ring record (table 1), we found moderately strong and moderately consistent correlations (rtree|NDVI) between tree growth and fortnightly NDVI during spring and summer (especially early July, median rtree|NDVI = 0.29, IQR 0.22–0.52 for TRW and median rtree|NDVI = 0.32, IQR 0.16–0.44 for MXD) for the four-pixel neighborhood around each site (figure 2). However, we found no obvious patterns in the magnitude or timing for these correlations in terms of measurement type (i.e., TRW versus MXD), species, genera, or plant functional type (i.e., coniferous or needle-leaved deciduous). These results were consistent whether the tree-ring data were standardized using the mean of each series or the spline method. See figure S1 in the supplementary material (available at stacks.iop.org/ERL/8/035034/mmedia).
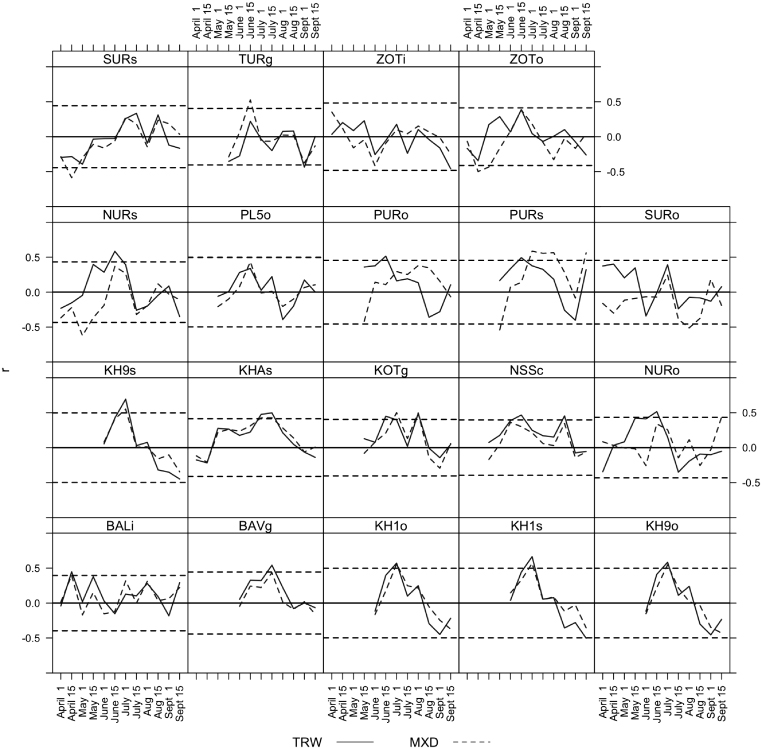
Figure 2. Correlations were calculated between NDVI and tree growth (rtree|NDVI) fortnightly over the spring and summer for the four-pixel neighborhood around each site. Some sites showed significant correlations at 95% confidence (dashed horizontal lines) in summer months (especially July) although there was no clear systematic difference between ring widths (TRW) and density (MXD).
Download figure:
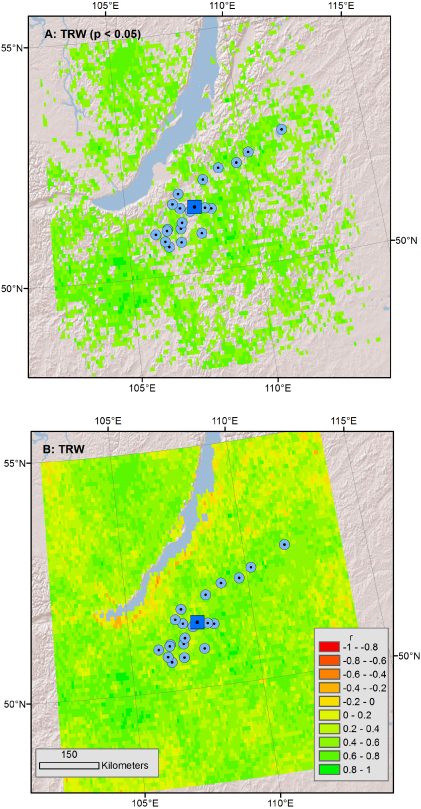
Standard image High-resolution imageIn order to assess tree growth regionally with respect to NDVI we reduced the growth data from seven sites in Central Siberia (from roughly 85°E to 105°E and 50°N to 75°N, table 1) using principal component analysis over the period 1880–1998. In the MXD data the first principal component (PC1) captured 72% of the variance while PC1 captured 61% of the variance in the TRW data. PC1 was very highly correlated to the annual mean of these chronologies for MXD (r = 0.98) and TRW (r = 0.98) as well. Additional diagnostics including the eigenvectors for each site are given in the supplementary material in order to assess the relative importance of each site. When PC1 was correlated with average July NDVI across the domain of the sites, we found strong regional patterns (figure 3). These correlation patterns differed only very slightly between ring width and density across the region. When the growth patterns from PC1 for MXD and TRW were viewed from 1880 to 1998 as both time series and continuous wavelet spectra it was clear that tree growth was dominated by low frequency variability at the scale of decades to multiple decades (figure 4).
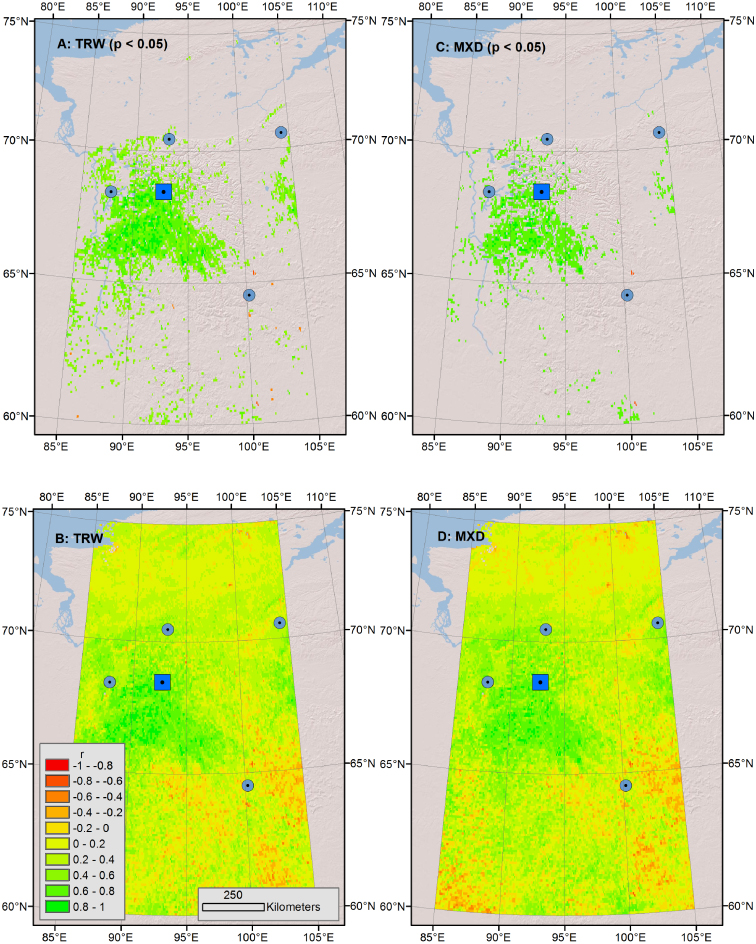
Figure 3. Regionally, the first principal component of a cluster of Siberian tree-ring data correlated positively (green colors) with mean July NDVI for both TRW ((A) and (B)) and MXD ((C) and (D)). Significant correlations (p < 0.05) are shown in the top row while the whole correlation field is shown in the bottom row. Individual sites (seven total chronologies at four sites) are shown as small blue dots while the centroid of those sites is shown as a bigger blue square.
Download figure:
Standard image High-resolution image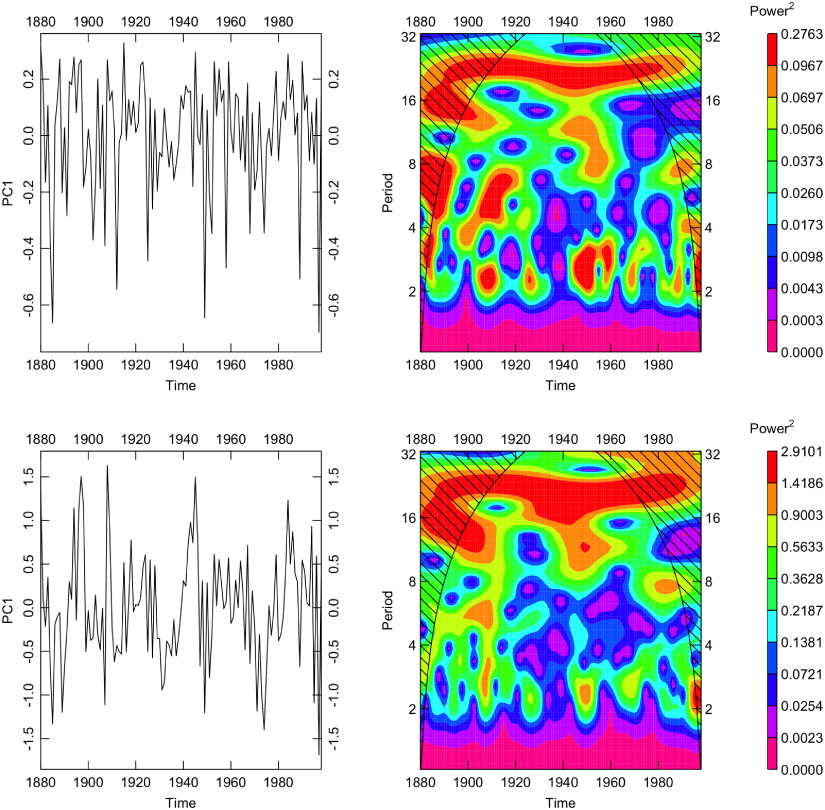
Figure 4. Continuous wavelet transformations of the first principal component of the central Siberian MXD data (top) and TRW (bottom) show significant power at decadal and multidecadal periods over the period 1880–1998. For instance, the red colors indicate persistent variability in tree growth at a period of decades (from about 16 to 32 years) in both TRW and MXD while the cooler colors indicate little in the way of power at higher frequencies (e.g., interannual). Color scale is by 10% quantiles.
Download figure:
Standard image High-resolution imageUnlike the 19 pairs of data sets above, only TRW was measured for the Buryatia samples. In the PCA of the 21 chronologies, PC1 captured 60% of the variation and as with the Central Siberia data above, the pattern of broad-scale association between July NDVI and tree-ring widths was consistent with the analysis above (figure 5).
Figure 5. The first principal component from a collection of 21 TRW chronologies from Pinus sylvestris in the Buryatia region show similar positive correlation (green colors) with July NDVI (compare to figure 3). Significant correlations (p < 0.05) are shown in the top panel while the whole correlation field is shown in the bottom panel. Individual sites are shown as small blue dots while the centroid of those sites is shown as a bigger blue square.
Download figure:
Standard image High-resolution image
4. Discussion
We used a large network of MXD and TRW tree-ring data and showed a general correspondence in rtree|NDVI. This follows on an emerging body of research indicating a loose coupling between canopy dynamics as measured by vegetation indices and xylogenesis measured in tree rings (D'Arrigo et al 2000, Kaufmann et al 2004, Lopatin et al 2006, Berner et al 2011, Beck et al 2013). Our results are consistent with some of the previous literature on this subject but differ in other respects. In particular, our results differ from a recent study by Beck et al (2013) that also used paired MXD and TRW chronologies.
Beck et al (2013) used well-replicated data sets of Picea glauca from four regions in northern North America and showed that their MXD chronologies correlated well with NDVI across the largely temperature-limited boreal forest. That study showed that TRW did not correlate well with either NDVI or temperature in recent decades which might be related to the so-called divergence effect where TRW at some sites appears to have decoupled from temperature in classically temperature-limited areas (Briffa et al 1998a, 1998b, and reviewed by D'Arrigo et al (2000)). Unlike Beck et al (2013) we do not see systematic differences between rtree|NDVI using different measures of cambial activity (TRW versus MXD) and indeed our tree-ring widths and density data are largely well correlated at most sites (median r = 0.73, table 1). This is consistent with the results reported for three northern tree-line larch sites in Siberia (Kirdyanov et al 2007). In these cases MXD and TRW in individual samples and between chronologies of the two parameters are almost always strongly correlated, and the relationship between them is not linear. They reported that if TRW was less than ∼0.3 mm the relationship was linear and if TRW was over ∼0.7 mm there was no linear relation. As Kirdyanov et al (2007) note, at 'high latitudes, MXD shows significant correlation with temperature for most of the summer but TRW appears to respond only to early summer temperature'. Complementary work by Rossi et al (2006) shows that the formation of new tracheids decreases after early summer. Since TRW is usually generally strongly correlated with the total number of tracheids (Vaganov et al 2006), it too is most strongly related to conditions in the first part of the season. Another surprising result from our study is that we do not see coherent patterns in rtree|NDVI by genus or functional type (e.g., deciduous Larix and evergreen Picea and Pinus) even though the monthly/seasonal responses between climate and TRW differ across these functional types (Lloyd et al 2011, Dufour-Tremblay et al 2012).
While Beck et al (2013) found good correlations between MXD and NDVI across a large region of boreal North America, we find good correlations between both measures of tree growth and NDVI across a large swath of Siberia (figure 3). The spatial patterns of correlation between PC1 and July NDVI are similar between TRW and MXD, which is not surprising given that those principal components are well correlated with each other with r = 0.69 over the period 1880–1998 and r = 0.85 during overlap with the NDVI record. That we find better correlation using a PCA as a regional measure of tree growth is also expected due to the nature of multispecies tree-ring networks. The existence of robust patterns of variability in tree-ring properties on large spatial scales (>105 km2 in some regions) and time scales from interannual to centennial has been thoroughly documented in many parts of the world (e.g., Fritts 1965). The existence of these emergent modes of spatiotemporal variability has been attributed convincingly and repeatedly to antecedent and current seasonal climatic conditions in regions where growth is predominantly limited by moisture availability (Meko et al 1993), growing season temperature (Briffa et al 2004), and more generally in temperate regions (Friedrichs et al 2009, Babst et al 2012).
Thus, like other studies, we showed an association between tree rings and NDVI in Siberian taiga (D'Arrigo et al 2000, Kaufmann et al 2004, Lopatin et al 2006, Lloyd et al 2011, Berner et al 2011). The magnitudes of the correlations, while many cases significant locally and at the regional level are consistent with values found in other studies but still are not very high. It is unclear why NDVI consistently models tree growth but does so weakly compared with other ecosystem properties like soil respiration (Bond-Lamberty et al 2012).
Still, the similarity in the correlation fields from Buryatia (figure 5) and Central Siberia (figure 3) lends support to the coupling between tree growth as measured by tree rings and canopy reflectance. Much of the Central Siberia region shown in figure 3, as well as the areas considered in North America by Beck et al (2013), are extremely cold and dry environments, often underlain by permafrost, where ecosystem production is often limited by temperature. The Buryatia region south of Lake Baikal, on the other hand, is a semi-arid region where ecosystem productivity is more likely limited by precipitation. But in both cases, the signals of production from canopy reflectance and tree rings are coherent over a broad spatial extent. These links between space-based and ground-based measures of ecosystem production are encouraging with regards to better quantifying the terrestrial carbon cycle. We have analyzed these links in Siberia which is an ideal place to look at large-scale associations between tree-ring and remote sensing as it is a vast area that is largely flat and comprised of very few species. It would be interesting to see how these results vary in areas of more complex topography, in disturbed areas, and in forests with more tree species.
Given that our results indicated agreement between the short NDVI record and the longer tree-ring record, it is interesting to note that tree growth at our sites and more generally tended to be dominated by variation at decadal and multidecadal time scales (figure 4). If indeed ecosystem production can be loosely inferred from tree-ring data across large spatial extents, it implies that production efficiency models driven by NDVI should be able to reproduce that low frequency variation in model hindcasts, experiments, and projections as well as track high frequency, species-specific autocorrelation (e.g., Berner et al 2011). While ecosystem productivity as measured by canopy reflectance is not currently interchangeable with either respiration (e.g., Bond-Lamberty et al 2012) or cambial growth, we do see that it is increasingly possible to make statistical links between site-level ecosystem properties and space-based measurements.
While results like these and others that link canopy reflectance to carbon accumulation in the stem of the tree are encouraging, there is still a large gap that needs to be made mechanistically before we can make inferences about forest carbon budgets at longer time scales and across larger spatial extents. Improving the statistical models between tree growth and canopy reflectance is an interesting beginning but the underlying biological processes are needed to pull apart spatial and temporal variability in northern forest growth and carbon cycling.
Acknowledgments
We thank the Northern Eurasian Earth Science Partnership Initiative for support via a grant from NASA-LCLUC-NEESPI (NNX09AK58G) to MKH and AGB and from NSF 0612341 and NSF 1044417 to AGB. VVS was supported by the Fulbright Scholar Program. Figure 1 was produced by Randal Bernhardt of the WWU Geography Department.