
Abstract
An analysis of the interannual variability of surface air temperature during the boreal winter in the East Asian (EA) region from 1960 to 2009 reveals that the East Asian winter monsoon (EAWM) significantly weakens after the mid-1980s. The robust warming over the EA region in the lower and middle troposphere as well as at the surface is caused mainly by changes in circulations over the North Pacific and Eurasian continent. The 300 hPa East Asian jet and 500 hPa trough over the EA region, which are closely linked to cold surges, significantly weaken after the mid-1980s. The weakened northerly wind in the Siberian high region and north of the EA region interfere with cold advection toward the EA region. The anomalous southeasterlies over the East China Sea due to an enhanced North Pacific oscillation (NPO)-like sea level pressure (SLP) pattern lead to anomalous warm advection over the EA region. It is also found that the advection of mean temperature by anomalous wind and the advection of anomalous temperature by mean wind mainly contribute to the anomalous warm advection in the EA region after the mid-1980s. Consequently, these anomalous circulations provide a more favorable environment for weakening of the EAWM.
Export citation and abstract BibTeX RIS

Content from this work may be used under the terms of the Creative Commons Attribution 3.0 licence. Any further distribution of this work must maintain attribution to the author(s) and the title of the work, journal citation and DOI.
1. Introduction
The East Asian winter monsoon (EAWM), one of the important climate systems, plays a significant role in the economies of societies in the East Asian (EA) region because anomalous variations of the EAWM can lead to disaster over East Asia (Huang et al 2007). A significant correlation exists between interannual variation of the EAWM and winter rainfall over southeastern and southern China. A weak EAWM induces strong winter rainfall over southeastern China (Zhou 2011). Sometimes extensive damage and general disruption occurred in southern China due to an anomalously strong EAWM with extremely low temperatures, blizzard conditions, and freezing rain (Zhou et al 2009).
Numerous previous studies (e.g. Gong et al 2001, Wu and Wang 2002, Jhun and Lee 2004, Ha et al 2012, Wang et al 2009a, 2009b) have shown that the interannual variability of the EAWM is pronounced and this variability is closely related to large-scale circulations such as the Siberian high (SH), Aleutian low (AL), EA jet, 500 hPa trough, and Arctic oscillation (AO) (Thompson and Wallace 1998). Noticeable features of the EAWM include the strong northwesterly and northeasterly winds from the SH and AL regions, respectively, a strong trough at 500 hPa over northeastern Asia, and a strong polar jet stream (Jhun and Lee 2004). The AO affects the EAWM through its impact on the SH (Gong et al 2001) or directly influences surface air temperature (SAT), sea level pressure (SLP), and the EA trough in the EA region (Wu and Wang 2002).
Furthermore, it is evident that the EAWM shows significant interdecadal variability (e.g. Jhun and Lee 2004, Wang et al 2009b). By assessing several EAWM indices (EAWMIs) for the period 1957–2001, Wang and Chen (2010) indicated that most of the EAWMIs could represent the weakening that occurred around the mid-1980s, but the transition times showed a spread. Using the EAWMI from 1957 to 2001, Wang et al (2009b) showed that a weakening of the EAWM occurs around the late 1980s. The propagation and amplitude of quasi-stationary planetary waves showing obvious interdecadal variations are closely related to the weakening of the EAWM. It has been found that winter rainfall over southeastern China, which is closely related to the EAWM, has been above normal since the mid-1980s (Wang and Feng 2011).
The dependence of transition time of the EAWM on the choice of EAWMIs indicates that multiple factors could lead the interdecadal variability of EAWM. It is noted that the El Niño–Southern Oscillation (ENSO) significantly influences the EAWM (e.g. Zhang et al 1996, Wang et al 2000, Yang et al 2002). However, the ENSO–EAWM relationship is not stationary, and it depends on the phase of the Pacific decadal oscillation (Wang et al 2008). Therefore, a climate shift in the mid-1970s characterized by a transition from a negative to positive Interdecadal Pacific Oscillation (IPO) (e.g. Meehl et al 2009) could affect the interdecadal variability of the EAWM. Although previous studies have examined the interdecadal variability of the EAWM and its possible causes, the mechanism for the weakening of the EAWM remains unclear. In this study, we examine the interannual and interdecadal variabilities of the EAWM for 50 years and find a significant change point of decadal variation. The linkage between the EAWM and circulation is investigated to understand the mechanism of the weakening of the EAWM. Influences of the SH, AL, AO, and North Pacific oscillation (NPO) (Rogers 1981), which may modulate EAWM variability, are examined and the thermal advection is also compared.
The National Centers for Environmental Prediction-National Center for Atmospheric Research reanalysis data set (NCEP-1; Kalnay et al 1996) from December 1960 to February 2010 is mainly used. The National Centers for Environmental Prediction/Department of Energy AMIP-II reanalysis data set (NCEP-2; Kanamitsu et al 2002), the European Centre for Medium-range Weather Forecasts (ECMWF) 40-year reanalysis data (ERA-40) (Uppala et al 2005), and the Climate Research Unit TS 2.1 global climate data set (CRU) (Mitchell and Jones 2005) are also utilized.
2. Robust warming over East Asia during the boreal winter monsoon
Several previous studies used air temperature to depict the variability of EAWM (e.g. Wang et al 2008, Wang et al 2010a, Kim et al 2013) since the severity of the winter weather is often estimated by the degree of coldness (Wang et al 2010a). In addition, to evaluate how well the EAWMIs measure the strength of the EAWM, correlation between EAWMIs and air temperature over the East Asian region is examined (Jhun and Lee 2004, Wang and Chen 2010). Therefore, in this study, 2 m air temperature in the region of 25–45°N, 105–145°E is used as a measure of the EAWM. This region is selected after considering the results of previous studies on the EAWM intensity and cold surges (e.g. Yang et al 2002, Jhun and Lee 2004, Lu et al 2007). Figure 1(a) shows a time series of anomalous 2 m air temperature during the boreal winter normalized by the standard deviation over the region of 25–45°N, 105–145°E from the winter of 1960 (December 1960; January and February 1961) to the winter of 2009, which is obtained by NCEP-1 (hereafter 'Ts_EA'), NCEP-2, and ECMWF ERA-40. The CRU TS2.1 temperature is also depicted in figure 1(a). A distinct interdecadal variability as well as interannual variability of the EAWM is revealed, and the four different datasets present very similar variation. Positive temperature anomalies occur frequently after the mid-1980s, implying a weakening of the EAWM.
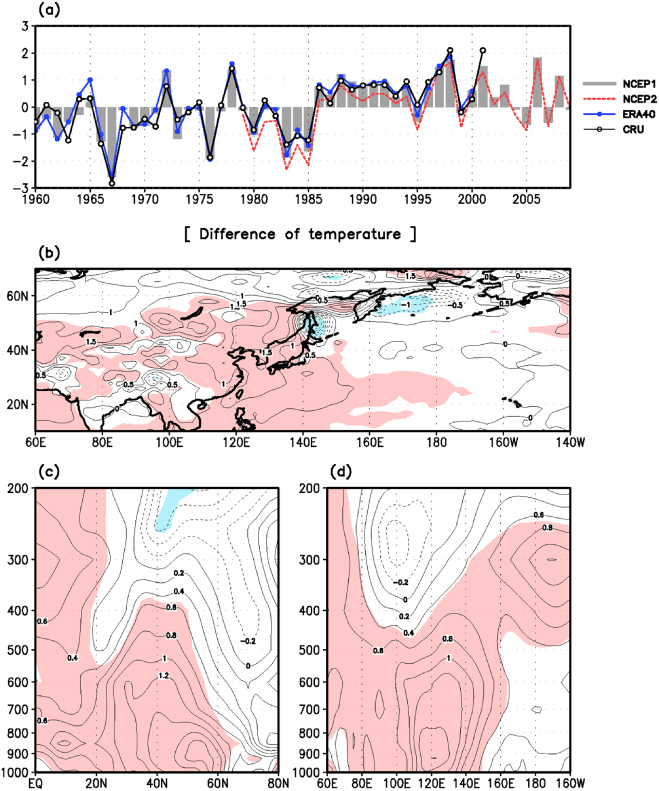
Figure 1. (a) The normalized time series of anomalous winter mean 2 m air temperature over East Asia (25–45°N, 105–145°E). Differences in air temperature (K) between AFT1985 and BEF1985 (b) at surface, (c) in latitude–height cross section averaged along 105–145°E, and (d) in longitude–height cross section averaged along 25–45°N. Contour intervals in (b) and ((c), (d)) are 0.5 K and 0.2 K, respectively. Shadings in (b), (c) and (d) represent the values significant at the 95% confidence level.
Download figure:
Standard image High-resolution imageUsing the test statistic of Pettitt (1979), which is a test statistic of whether there is a change in the median of a sequence of observations based on the rank of the observations, the Ts_EA for 50 years is statistically evaluated to detect a significant change point. Here, we briefly explain the Pettitt test procedure. The change point can be obtained by the calculating W and K.

Each of the observations X1,X2,...,XN is ranked from 1 to N and ri is the rank associated with the observations Xi. The change point is the value of j at which the maximum in K occurs. A detailed description of Pettitt's change point test is given in Ha and Ha (2006). From the evaluation, the year 1985 emerges as a significant change year with the 80% confidence level. Since several cold winters occurred in the late 2000s, the change point test is applied to the Ts_EA for 45 years from 1960 to 2004 again, and the winter of 1985 emerges as a change point at the 90% confidence level. Since the late 1990s, the standing Central Pacific warming (CPW) becomes a dominant mode in the Pacific and the SST change shows a La Niña-like pattern (Xiang et al 2013). Because the strong EAWM is associated with the cold event in the eastern Pacific (Wang et al 2000), cold winters in 2000s is partly attributable to the change of ENSO behavior. The Lepage test statistic (Yonetani and McCabe 1994), which is useful for detecting an abrupt change between two periods, is also applied to the Ts_EA. The test result indicates that the shift occurred around 1985–1989 is significant at the 95% confidence level. Therefore, the total time period is divided into two subperiods 1960–85 (hereafter 'BEF1985') and 1986–2009 (hereafter 'AFT1985').
The spatial distribution of the SAT difference between AFT1985 and BEF1985 is presented in figure 1(b). SAT increases strongly over the EA region. To determine whether the temperature exhibits a similar interdecadal shift at other vertical levels, the vertical structure of the temperature difference is examined. In latitude–height structure, a significant warming is distinct in equatorial and subtropical regions as well as in the EA region from the surface to the mid-troposphere (figure 1(c)). In longitude–height cross section, the largest warming exists near the surface over 120°E and a significant increase of temperature occurs below the 500 hPa level from 60°E to 145°E (figure 1(d)), indicating that the weakening of the EAWM occurs in the lower and middle troposphere as well as at the surface. These significant differences are also observed in other datasets, although the available analysis periods are different for each dataset (not shown).
3. Changes in circulations and their influences on the EAWM
To understand the transition of the EAWM from BEF1985 to AFT1985, changes in circulations and their influences on the weakening of the EAWM are explored (figure 2). The upper-level jet is one of the major factors determining winter climate in the EA region (Jhun and Lee 2004). A strong EA jet stream at 300 hPa with weak intensity in the north of its core, which provides a favorable condition for strong cold surges by the development of an EA trough, leads to a strong EAWM. Figures 2(b) and (d) indicate that upper-level jet intensity decreases in the core region and 500 hPa trough also weakens significantly over the EA region in AFT1985, respectively. These results imply that anomalous circulations in AFT1985 do not provide a suitable environment for the occurrence of cold surges over the EA region compared to BEF1985.
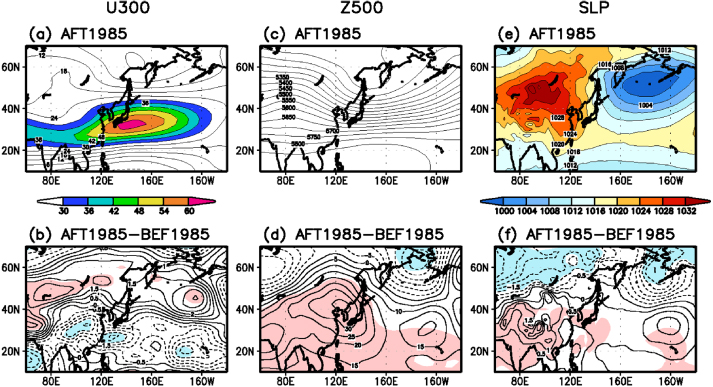
Figure 2. (a) 300 hPa zonal wind (ms−1), (c) 500 hPa geopotential height (m), and (e) SLP (hPa) during the boreal winter in AFT1985. Differences of (b) 300 hPa zonal wind, (d) 500 hPa geopotential height, and (f) SLP between AFT1985 and BEF1985. Contour intervals in (b) and (d) are 0.5 ms−1 and 5 m, respectively. Contour interval in (f) is 0.5 hPa. Shadings in (b), (d), and (f) represent the values significant at the 95% confidence level.
Download figure:
Standard image High-resolution imageThe variability of the EAWM largely depends on the behavior of both the SH and AL. It can be seen that SLP increases south of 40°N, while it significantly decreases north of 50°N (i.e., to the north of the centers of SH and AL), indicating that the SH weakens and AL deepens in AFT1985 (figure 2(f)). The pronounced weakening of the SH from the 1980s to the 1990s has been noted in previous studies (Gong and Ho 2002, Panagiotopoulos et al 2005), although a recovery of SH intensity has been observed in recent decades (Jeong et al 2011). In particular, the negative core in the SLP difference filed over the North Pacific suggests a northeastward shift of the AL accompanying its deepening. A northward or southward shift of the AL is related to the West Pacific (WP) pattern (Sugimoto and Hanawa 2009). The SLP difference in the North Pacific resembles an NPO-like SLP pattern, which is characterized by a cyclonic anomaly in the AL region and an anticyclonic anomaly in the subtropical Pacific (e.g. Rogers 1981, Yeh and Kim 2010). This NPO-like SLP pattern is consistent with the NPO index, which entered its decadal positive phase since 1986, as shown in Wang et al (2007). In addition, we examined the SST change during the boreal winter from BEF1985 to AFT1985 to find a possible relation between ENSO and weakening of the EAWM. The significant SST change related to the El Niño or La Niña patterns is not observed in the eastern Pacific, while the distinct warming occurs over the Indian Ocean (IO) and western North Pacific (WNP) (not shown). Further studies on the relationship between the warming of IO/WNP and weakening of the EAWM after the mid-1980s are needed in the future.
Differences of low-level wind and geopotential height between AFT1985 and BEF1985 are shown in figure 3. The difference in low-level geopotential height also shows the NPO-like pattern. It should be noted that anomalous southeasterlies toward the EA region associated with easterlies from an anomalous anticyclone in the subtropical Pacific may give rise to anomalous warm advection inducing a weakening of the EAWM. Significant southwesterly anomalies dominate over the SH region and north of the EA region. The enhanced mean westerly and weakened mean northerly over the Eurasian continent are consistent with circulation features that are distinct in the positive phase of the AO (Wu and Wang 2002). These anomalous circulations may interfere with cold temperature advection from the SH and consequently lead to warming over the EA region. Strong cyclonic circulation related to a northeastward shift and deepening of the AL occurs in the Bering Sea. Because of the northeastward shift of the AL, northeasterlies from the AL cannot effectively influence the EAWM.
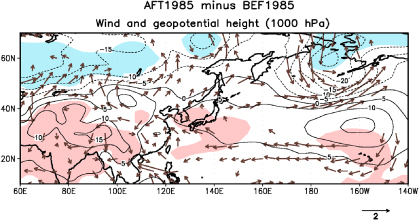
Figure 3. Differences in 1000 hPa wind (ms−1) (vector) and geopotential height (m) (contour) during the boreal winter between AFT1985 and BEF1985. Arrows significant at the 90% the confidence level are shown. Contour interval is 5 m. Shadings represent the values of geopotential height significant at the 95% confidence level.
Download figure:
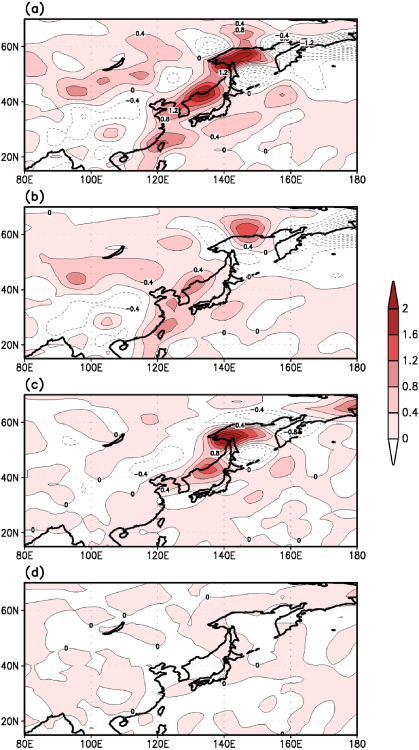
Standard image High-resolution imageThe thermal advections (−V⋅∇T) in BEF1985 and AFT1985 are compared. In temperature tendency during the cold surge occurrence in East Asia, the horizontal temperature advection is more important compared to the vertical advection term and diabatic heating term (Park et al 2008). Therefore, we focused on the change in horizontal temperature advection in present study. As expected, the difference in temperature advection between AFT1985 and BEF1985 is a significantly positive advection, i.e., anomalous warm advection, over the EA region (figure 4(a)). We further examine the temperature advection difference in detail by dividing into three terms of the advection of mean temperature by anomalous wind ( ), the advection of anomalous temperature by mean wind (
 ), and the nonlinear advection (−V'⋅∇T') (Wang et al 2010b, Kim et al 2013). In present study, the prime represents the difference between AFT1985 and BEF1985 and bar represents the mean during BEF1985. It is noted that the advection of mean temperature by anomalous wind and the advection of anomalous temperature by mean wind contribute predominantly to the anomalous warm advection (figures 4(b) and (c)). The nonlinear advection is very small and cannot contribute to the anomalous warm advection in the EA region (figure 4(d)). The advection of mean temperature by anomalous wind contributes to the warm advection in the SH region, Korean peninsula, and East China Sea (figure 4(b)), where the anomalous southerly occurs (figure 3). The contribution of the advection of anomalous temperature by mean wind is dominant along the northeastern coast of the Eurasian continent (figure 4(c)). As a result, figure 4 indicates that these two temperature advection terms play an important role in the anomalous warm advection inducing the weakening of EAWM after the mid-1980s.
Figure 4. (a) Difference in temperature advection (K day−1) at 1000 hPa between AFT1985 and BEF1985. The contributions of (b) the advection of mean temperature by anomalous wind (K day−1), (c) the advection of anomalous temperature by mean wind (K day−1), and (d) the nonlinear advection (K day−1) to the temperature advection difference in (a).
Download figure:
Standard image High-resolution image
4. Concluding remarks
An analysis of the interannual variability of winter SAT in the EA region indicates that strong warming occurs after the mid-1980s, implying a weakening of the EAWM. This weakening of the EAWM takes place in the lower and middle troposphere as well as at the surface. Focusing on the weakening of the EAWM, changes in circulations and their influences on the EAWM are examined to find possible causes of the robust warming over the EA region.
Upper-level jet intensity at 300 and a 500 hPa trough over the EA region significantly weaken during AFT1985, indicating that anomalous circulations in AFT1985 cannot provide a suitable environment for the occurrence of cold surges toward the EA region. In addition, weakening of the SH and a northeastward shift of the AL core are linked to the weakening of the EAWM. In AFT1985, an enhanced southwesterly in the SH region and north of the EA region, which is related to the positive phase of the AO, is dominant. Moreover, anomalous southeasterlies over the Yellow Sea and East China Sea due to an NPO-like SLP pattern lead to the anomalous warm advection over the EA region and consequently provide a more favorable condition for weakening of the EAWM. Wang et al (2007) showed that the NPO has had a close relationship with circulation over East Asia in recent decades. Temperature advection results of this study indicate that the advection of mean temperature by anomalous wind and the advection of anomalous temperature by mean wind mainly contribute to the anomalous warm advection in AFT1985.
In present study, we used surface air temperature to show the change and variability of the EAWM. Since the measurement of EAWM using circulation variables may be a meaningful pursuit to better understand EAWM dynamics, an investigation of interannual and interdecadal variabilities of other variables are necessary. To describe the interannual variability of the EAWM and to quantify the strength of the EAWM, many EAWMIs have so far been defined by various components, such as low-level wind (e.g. Ji et al 1997, Yang et al 2002), upper-tropospheric zonal wind shear (Jhun and Lee 2004), east–west pressure contrast (e.g. Wu and Wang 2002, Chan and Li 2004), and EA trough (e.g. Wang et al 2009a). However, as aforementioned, existing EAWMIs show different transition times (Wang and Chen 2010). Therefore, an evaluation of existing EAWMIs for describing interdecadal variability of the EAWM should be performed in more detail in a future study.
Acknowledgments
This work was supported by GRL grant of the National Research Foundation (NRF) funded by the Korean Government (MEST 2011-0021927). This study was also financially supported by the National Research Foundation of Korea (NRF) grant funded by the Korea government (MEST) (No. 2012R1A2A2A01 008501).