

Abstract
Relatively little is known about the effects of regional warming on the carbon cycle of subtropical evergreen forest ecosystems, which are characterized by year-round growing season and cold winters. We investigated the carbon balance in three typical East Asia subtropical evergreen forests, using eddy flux, soil respiration and leaf-level measurements. Subtropical evergreen forests maintain continuous, high rates of photosynthetic activity, even during winter cold periods. Warm summers enhance photosynthetic rates in a limited way, because overall ecosystem productivity is primarily restrained by radiation levels during the warm period. Conversely, warm climates significantly enhance the respiratory carbon efflux. The finding of lower sensitivity of photosynthesis relative to that of respiration suggests that increased temperature will weaken the carbon-sink strength of East Asia subtropical evergreen forests.
Export citation and abstract BibTeX RIS

Content from this work may be used under the terms of the Creative Commons Attribution-NonCommercial-ShareAlike 3.0 licence. Any further distribution of this work must maintain attribution to the author(s) and the title of the work, journal citation and DOI.
1. Introduction
Predictions of global warming present an important question of how such climatic changes will affect ecosystem carbon balance. The Earth's average temperature has increased 0.74 °C in the past century (1906–2005) and is predicted to increase at an even faster rate (IPCC 2007). Forests store most of the carbon within the terrestrial ecosystem (∼1146 PgC based on inventory account (Dixon et al 1994)) and play an important role in global biogeochemical cycles, and will face an unprecedented warm climate. If warming induces additional release of carbon stored in forest ecosystems into the atmosphere, global warming will be accelerated (Cox et al 2000, Bond-Lamberty and Thomson 2010).
Although much work has been done to address this question, the results and potential outcomes are inconclusive. In contrast to grassland or tundra with lower canopy, it is very difficult to carry out whole-ecosystem-warming experiments in tall-canopy forests, whether using infrared heaters, buried heating cables or open-top chambers (Johnson et al 2000, Luo 2007). Most previous warming experiments in tall-canopy forest only examined warming of the soil rather than the whole ecosystem (Melillo et al 2002, Knorr et al 2005, Davidson and Jassens 2006). Whole-ecosystem-warming experiments, however, cannot be substituted by soil-warming experiments because there are interactions between soil and trees. For example, enhanced nitrogen availability, which benefits litterfall production and tree growth, was observed in a long-term soil-warming experiment (Melillo et al 2011).
Forest carbon balance response to warming scenarios will vary in different forest regions, elevations, and forest types. Global warming is predicted to increase tree growth of high-elevation forests but those at low elevations would show reduced growth (Latta et al 2010). Boreal and temperate tree growth was suggested to increase with increased temperature, in contrast to tropical forests (Way and Oren 2010). In practice, tree growth cannot represent ecosystem net carbon budget or even net primary production. Ecosystem net carbon budget accounting should include not only photosynthesis and autotrophic respiration of trees but also heterotrophic respiration of soil (Schulze 2006).
It is difficult to predict how ecosystem sink/source strength (termed net ecosystem production (NEP); Woodwell et al 1978) will respond to climate warming. As NEP is the small difference between gross primary production (GPP) and total ecosystem respiratory carbon loss (ER), a slight variation in GPP or ER could result in a significant effect on NEP. That is to say, it is more difficult to obtain a precise estimate for NEP than for GPP or ER. In reality, the response of NEP to climate warming is determined by the trade-off between the sensitivities of GPP and ER to increased temperature. If GPP is more sensitive than ER to warming, ecosystem NEP will increase, and vice versa.
Subtropical evergreen forests, known as 'oases on the Tropic of Cancer' are widespread in East Asia (Kira 1991). They represent the transition between temperate and tropical forests, with a year-around growing season and cold winter. The existence of subtropical forests completes a continuous spectrum of biomes (boreal, temperate, subtropical and tropical) within the terrestrial ecosystem. More than 200 million people in East Asia live in areas where subtropical evergreen forests exist or have existed in the past, and this ecosystem is the basis for the most active economy in the region. However, these forests are facing strong pressures related to human disturbance and global climate change; unfortunately, little is known about the dynamics of these processes. The response of subtropical evergreen forests to elevated temperatures is especially poorly constrained, despite the ecological and human importance of this ecosystem. Warming will not affect subtropical evergreen forests in the same way that it affects temperate and boreal forests, because of the milder conditions and the year-round growing season (Piao et al 2008, Richardson et al 2010). It is also not known whether warming in subtropical evergreen forest ecosystems will have a negative impact on carbon uptake, as has been predicted for tropical forests (Way and Oren 2010), because subtropical evergreen forests occur in areas with pronounced cold winters, which is not the case in tropical regions.
This study incorporates eddy covariance flux observations, soil respiration, and leaf-level measurements to determine whether GPP or ER is more sensitive to climate warming in three typical subtropical evergreen forests in East Asia. We also examined why GPP or ER is more sensitive at these locations.
2. Materials and methods
2.1. Site descriptions
Three subtropical evergreen forests were chosen to investigate carbon balance response to regional warming at the ecosystem scale: Chilanshan in Taiwan (CLS); Dinghushan in Guangdong (DHS) and Ailaoshan in Yunnan (ALS) (table 1; figure 1). These three forests cover two monsoon types (East Asia Monsoon and Indian Monsoon), three stand ages (50, 100 and old growth more than 300 yr), three forest types (coniferous, broadleaf, and mixed) and three geographic locations (inland, far from sea; inland, near sea; and island). Details of the climate, vegetation, canopy and soil of these three forests were reported in previous studies (Chu 2008, Tan et al 2011, Wang et al 2006) and are not repeated here.

Figure 1. Geographic location of the study sites. The triangle, star and circle symbols indicate Ailaoshan (ALS), Dinghushan (DHS) and Chilanshan (CLS), respectively.
Download figure:
Standard imageTable 1. Site descriptions.
| Site | CLS | DHS | ALS |
|---|---|---|---|
| Location | 24°35'28''N | 23°10'24''N | 24°32'17''N |
| 121°25'56''E | 112°32'10''E | 101°01'44''E | |
| Elevation of site (m) | 1650 | 240 | 2502 |
| MAT (°C) | 14.7 | 21 | 11 |
| PPT (mm) | 4500 | 1956 | 1931 |
| Sr (w m−2) | 160 | 140 | 115 |
| Predominate species | Chamaecyparis obtusa var. formosana, Illicium anisatum, Dendropanax dentiger | Schima superba, Castanopsis chinensis, Pinus massoniana | Lithocarpus chintungensis, Rhododendron leptothrium, Vaccinium ducluoxii |
| Canopy height (m) | 12 | 17 | 26 |
| Biomass (t ha−1) | 162a | 261 | 499 |
| Forest type | Evergreen coniferous forest | Evergreen coniferous and broadleaved mixed forest | Evergreen broadleaved forest |
| Soil type | loamy Lithic Leptosol | loamy Lateritic Oxisol | loamy Alfisol |
| Zr (m) | 24 | 27 | 34 |
| Monsoon type | East Asia monsoon | East Asia monsoon | Indian monsoon |
aBiomass for this site represents data obtained for Chamaecyparis obtusa var. formosana, as this species comprises greater than 80% of the stand basal area (see Chang et al 2008). Zr is the mounting height of the eddy covariance system. MAT is the mean annual temperature. PPT is the annual precipitation. Sr is mean solar radiation.
2.2. Eddy covariance observations
Two different research networks coordinate work on energy fluxes in the three study regions: the CLS site is maintained by TaiwanFLUX; DHS and ALS are parts of ChinaFLUX; both networks applied the same instruments for eddy flux observations. The open-path eddy covariance system comprised a CSAT-3 three-dimensional sonic anemometer (Campbell Scientific Inc., Logan, UT, USA) and a Li-7500 infrared gas analyzer (Li-Cor Inc., Lincoln, NE, USA). Data was collected at 10 Hz. Instrument height was related to mean canopy height (table 1). The dataset used in this study was collected during 2009. Flux data for DHS and ALS were processed using a procedure developed by ChinaFLUX, whereas CLS flux data were processed using the EdiRe micrometeorological software (University of Edinburgh). As the study assessed integration and comparison, we applied an identical data processing scheme for all three sites.
It is a convention, within the eddy flux community, to follow certain quality assurance and control (QA/QC) processes with eddy flux data before measurements are reported. For the present dataset, quality assurance steps, such as power spectral or co-spectra analysis with fast Fourier transform (FFT), flux-variance relationship test, energy balance closure calculation and footprint estimation, were carried out by previous studies (Chu 2008, Tan et al 2011, Wang et al 2006). In this study, we carried out the following QA/QC steps before obtaining the seasonal and annual average fluxes.
First, the averaging period covariance calculation is 30 min for all three sites.
Second, coordinate rotation (Tanner and Thurtell 1969) and WPL correction (Webb et al 1980) were applied to the flux dataset.
Third, the storage flux is included in estimating net ecosystem exchange, which derives from single-layer CO2 data measured by Li-7500 (Hollinger et al 1994).
Fourth, any values exceeding 5.5 times standard deviation within a moving window of 10 values, or carbon fluxes outside the range (−3, 3) (mg CO2 m−2 s−1), were regarded as spikes and were excluded from the analysis.
Fifth, u*-filtering, gap-filling, and flux-partitioning were carried out using an online program maintained by the Max Planck Institute (www.bgc-jena.mpg.de/~MDIwork/eddyproc/index.php).
The nighttime flux data were previously criticized for low reliability due to calm air (Goulden et al 1996). Thus, the daytime data (defined as the period when photosynthetic active radiation (PAR) >10 μmol m−2 s−1) were used to represent light response at the leaf level (Goulden et al 1997). In this study, midday net ecosystem exchange (when PAR >200) was also extracted (Goulden et al 2006) and was used to indicate temporal trend of photosynthesis capacity at the ecosystem level.
2.3. Soil efflux monitoring
Soil efflux measurement was conducted at the ALS site during October 2010 and September 2011. Twenty chambers were installed for four treatments (five replicates each): control, root cut, litterfall exclusion and warming. The control treatment data were used in this study. Soil efflux was monitored by a multichannel automated measurement system developed by Liang at the Japan National Institute for Environmental Studies (figure s1 available at stacks.iop.org/ERL/7/044017/mmedia). The system measured soil efflux in a flow-through and no-steady-state manner, and comprised 20 automatic chambers and a control box. The chambers (90 cm × 90 cm × 50 cm) are made from clear PVC. The system incorporates several design features to prevent gas outlet (Liang et al 2003). Two lids at the top of the chamber can be raised or closed, and are operated by compressed air (MAX-E-12, Techno Fronto) regulated by a four-way valve (BK120, Techno Fronto) (Liang et al 2003). Two fans (KMFH-12B, Kyoei, Tokyo, Japan) mounted in each chamber ensure sufficient mixing of air during measurement.
The main components of the control box are an infrared gas analyzer (IRGA, Li-840, Li-Cor Inc.) and a datalogger (CR10X, Campbell Scientific Inc.). During measurement, the air in the closed chamber is circulated through the IRGA by a micro-diaphragm pump (CM-50, Enomoto Ltd, Tokyo, Japan). The 20 chambers are closed sequentially by a home-made relay board controlled by the datalogger. The datalogger acquired outputs signals from the IRGA every 1 s and recorded average values every 10 s; the total sampling period for each chamber was 180 s. For each chamber, 1 efflux value was obtained per hour. The efflux was calculated from 18 records, as shown in equation (1):

where V is the volume of the chamber (m3); S, the base area of the chamber (m2); R, the gas constant (8.314 Pa m3 K−1); T, the air temperature in the chamber (K); P, air pressure (Pa); W, the water vapor mole fraction; and ∂C/∂t, the rate of increase of CO2 mole fraction (μmol mol−1 s−1) in the chamber, calculated by the least-square method.
Soil temperature at 5 cm depth, and air temperature inside each chamber were measured with self-made thermocouples. Soil moisture at 10 cm was monitored with time-domain reflectometers (TDR) (CS616, Campbell Scientific Inc.). Air pressure at 30 cm height in the center of the plot was measured by a pressure transducer (PX2760, Omega Engineering, Inc., Stamford, CT, USA).
2.4. Leaf-level measurements
The 10 most ecological important evergreen broadleaf tree species from the ALS site (table 2) were selected for measurement of gas exchange and leaf sensitivity to low temperatures. The light-saturated net CO2 assimilation rate per unit leaf area of the 10 evergreen broadleaf tree species was monitored using a portable photosynthetic system (LI-6400XT, Li-Cor Inc., Lincoln, NE, USA), during five different months (August, October, December, January and April). Six sun-exposed mature leaves from different individuals of a species were measured at a photosynthetic photon flux density of 1500 mol m−2 s−1, at ambient temperatures and CO2 concentrations. The measurements were conducted on sunny days between 08:30 and 10:30 h solar time, except for some August measurements conducted on cloudy days because of limited sun during the rainy season.
Table 2. Ten most important evergreen broadleaf tree species selected for leaf-level measurements.
| Species | Family |
|---|---|
| Lithocarpus jingdongensis Y C Hsu et H J Qian | Fagaceae |
| Symplocos sumuntia D Don | Symplocaceae |
| Vaccinium delavayi Franch | Vacciniaceae |
| Schima noronhae Reinw ex Blume | Theaceae |
| Manglietia insignis Blume | Magnoliaceae |
| Ternstroemia gymnanthera Sprague | Theaceae |
| Lithocarpus hypoviridis Y C Hsu, B S Sun et H J Qian | Fagaceae |
| Lyonia ovalifolia var. lanceolata Hand-Mazz | Ericaceae |
| Hartia sinensis Dunn | Theaceae |
| Illicium macranthum A C Smith | Illiciaceae |
Leaf sensitivity to low temperatures was determined in the middle of the winter season (January 2010), when the trees were acclimated to winter temperatures, using the chlorophyll fluorescence method (Boorse et al 1998). Sun-exposed mature leaves from different individuals were collected in the late afternoon. The leaves were equilibrated to dark conditions by placing them in black plastic bags with wet paper towels for 12 h. Leaf samples were then exposed to a range of temperatures in a freezer: 4, 0, −2, −5, −7.5, −10, −12, −15, −17.5, −20 and −23 °C for 30 min, followed by thawing in a dark room at 15 °C for 24 h. The quantum efficiency of photosystem II (PS II) was then determined with a dual PAM-100-modulated chlorophyll fluorescence measurement system (Walz, Germany). Relative quantum efficiency was calculated as the percentage of maximum PS II quantum efficiency, which was measured at predawn under ambient conditions. The relationship between relative quantum efficiency and treatment temperature was described by a sigmoid function, which was used to determine the temperature corresponding to a 50% loss of maximum PS II quantum efficiency; this was defined as the leaf-lethal temperature of the species (LT50). The p values of all regressions were <0.001.
2.5. Effects of measurement done in different years
Eddy covariance observations (2009), leaf-level measurements (2010) and soil respiration (2010–1) were done in different years in the study. Nevertheless, it will not affect the analyses and conclusions. Eddy covariance data which used for inter-sites comparisons were collected from the same year of 2009. Leaf temperature sensitivity is a more genetic- than environmental-determined property. Eddy covariance observations could be confirmed by independent leaf-level measurements in different years.
3. Results
3.1. Leaf-level measurements
There was an obvious seasonal trend in leaf maximum CO2 assimilation (Amax−area) except H. sinensis (figure 2). Amax−area declined with time and approached its lowest value in late winter (January) except in L. ovalifolia and I. macranthum, which showed further decline in April. None of the Amax−area values were less than 5 μmol m−2 s−1, even during cold winter periods, indicating year-round photosynthetic capacity. The mean seasonal range of all species was 4.03 μmol m−2 s−1.
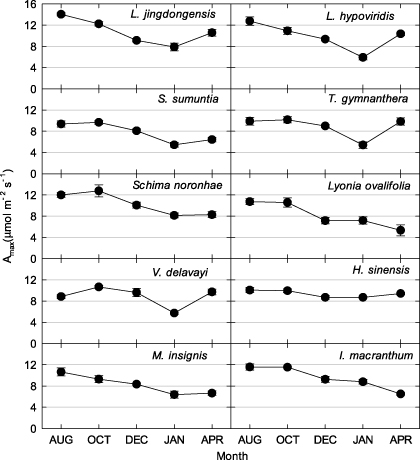
Figure 2. Seasonal dynamics of leaf maximum CO2 assimilation (Amax−area) for 10 evergreen broadleaf species from the ALS site.
Download figure:
Standard imageThe recorded temperature was never lower than the leaf-lethal temperature corresponding to 50% membrane damage (figure 3). LT50% for most of the species is around −12 °C. The highest Amax−area and lowest LT50% in L. jingdongensis may account for this species having greater importance in the community.
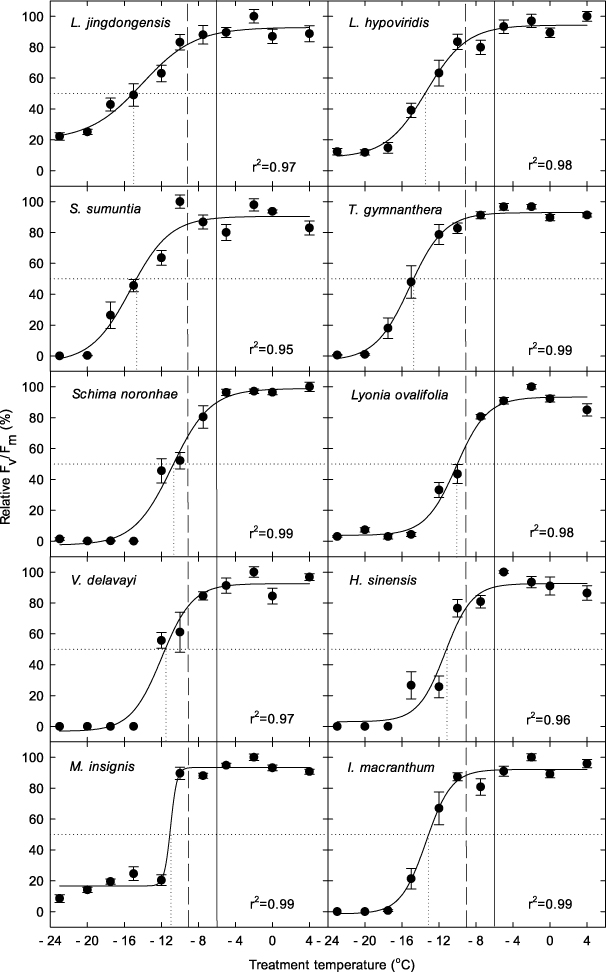
Figure 3. Relative quantum efficiency of photosystem II (PS II) as a percentage of maximum quantum efficiency of PS II (indicating percentage cell membrane or photosystem damage) for tree leaves from various species as a function of treatment temperature. Dashed lines indicate historical minimum air temperatures; dotted lines indicate leaf-lethal temperature corresponding to 50% membrane damage (LT50%); solid lines indicate minimum air temperatures in the 2009–10 winter season. Trends in the data were described by sigmoid functions; p values of all regressions were <0.001.
Download figure:
Standard image3.2. Soil carbon efflux
Strong seasonal pattern was observed in soil respiration (figure 4(a)). Winter soil respiration was strongly inhibited, with a mean value of ∼1.5 μmol m−2 s−1. Respiration increased rapidly during spring and peaked in summer. The dependence of soil carbon efflux on temperature can be well described by an exponential equation (figure 4(b)), from which a temperature sensitivity index (Q10 value) of 2.81 is derived.
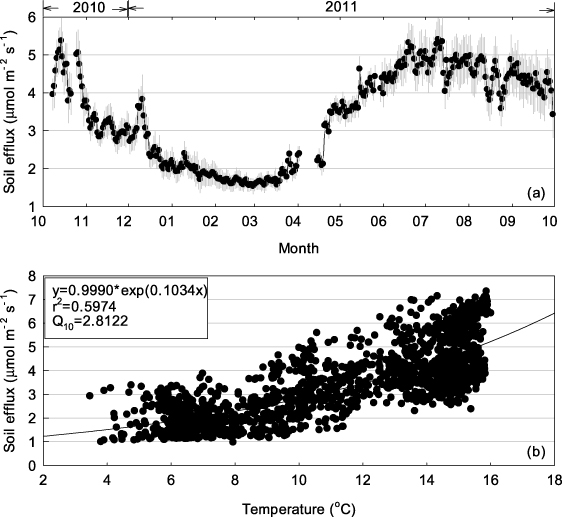
Figure 4. Daily mean soil efflux during October 2010 and September 2011 (a). Error bars are standard deviations. The dependency of respiration on soil temperature at 5 cm was fitted by a two-parameter exponential equation (b). The hourly raw data was used in regression. Q10 is calculated as exp(10*0.1034). p < 0.001 and the regression is significant.
Download figure:
Standard image3.3. Eddy fluxes
These three forest sites act as continuous, year-round carbon sinks, represented by negative values of the net ecosystem exchange (NEE) of carbon, even during winter (figure 5). At the CLS and DHS sites, the NEE is greater during cold winter months than during warm summer months, showing the opposite seasonal trend to that observed at ALS; ALS environments are more temperature sensitive than those of CLS or DHS. Both ecosystem respiration (ER) and gross ecosystem exchange (GEE) are greater during summer than winter at all three sites. There was no obvious seasonal trend in midday mean NEE of the DHS and CLS sites (figure 6). Midday mean NEE at ALS was around 12 μmol m−2 s−1 and 8 μmol m−2 s−1 in summer and winter, respectively. The light response of daytime NEE can be well fitted by Michaelis–Menten equations both in summer and winter for all three sites (figure 7). The maximum ecosystem photosynthesis rate (Pmax) of coniferous (CLS) and mixed forest (DHS) was higher during winter than summer, whereas capacities during the winter in broadleaf forest (ALS) were lower than those in the other forest types, although still relatively high compared with rates in summer (table 3). The highest Pmax and dark respiration (Rd) were observed at CLS, both in winter and summer (table 3). The ALS site showed greatest utilization of light under low light conditions (α) during winter. Multi-site comparisons show that ecosystem carbon-sink strength correlates inversely with mean annual temperature (figure 8): higher mean annual temperatures correlate with lower carbon-sink strengths.
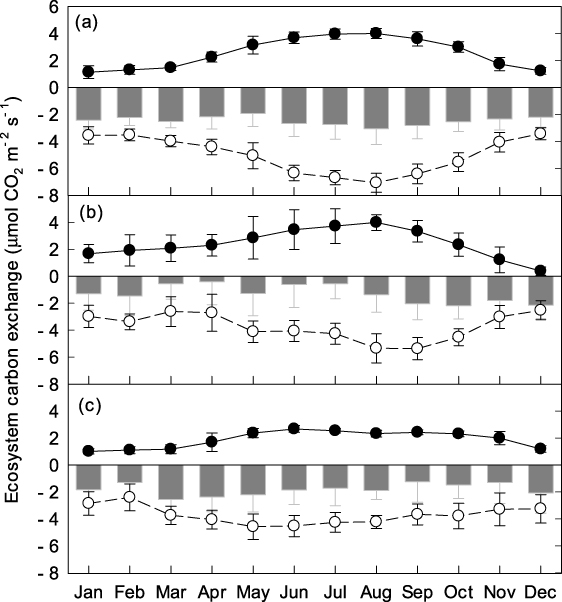
Figure 5. Monthly mean ecosystem respiration (ER, solid circles connected with solid line), gross ecosystem exchange (GEE, open circles connected with dashed line), and net ecosystem exchange (gray bars) in ALS (a), DHS (b) and CLS (c) during 2009. Error bars represent standard error of the values in each month.
Download figure:
Standard image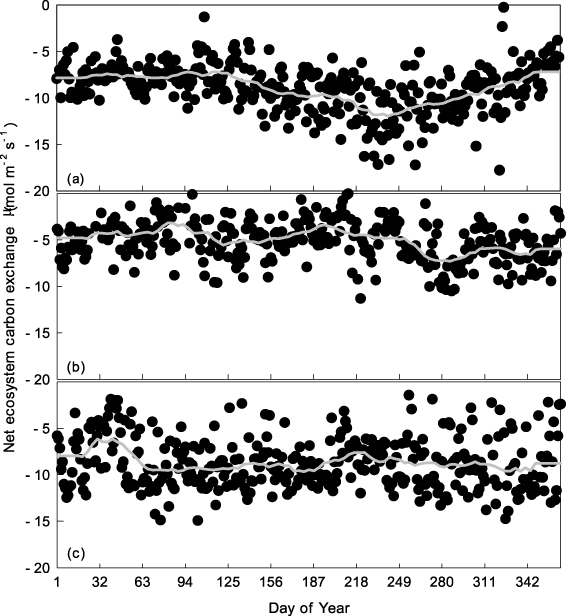
Figure 6. Temporal variation of midday mean NEE (corresponding PAR > 200 μmol m−2 s−1) in ALS (a), DHS (b) and CLS (c). The dark gray solid line is the moving average of the dataset.
Download figure:
Standard image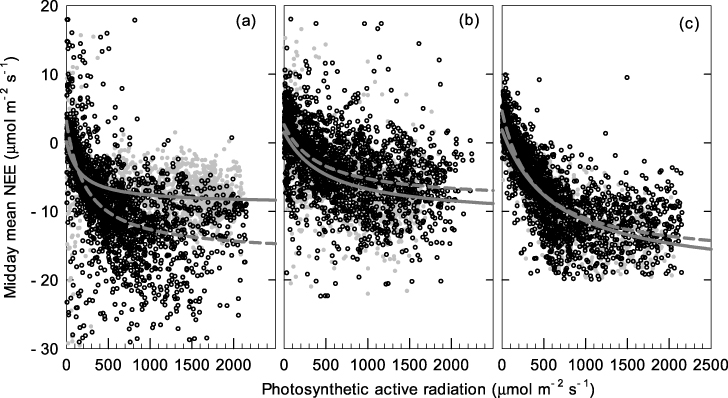
Figure 7. Light response of daytime net ecosystem carbon exchange at ALS (a), DHS (b) and CLS (c) during winter (gray circles+solid lines) and summer (open circles+dashed lines). The Michaelis–Menten equation was used to fit the light-response curves.
Download figure:
Standard image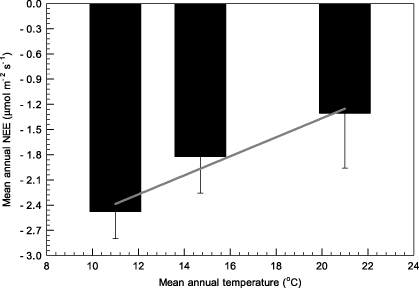
Figure 8. Mean annual NEE (net ecosystem exchange) related to mean annual temperature at the three sites. The solid line indicates a linear regression. Error bars are standard error of 365-day values.
Download figure:
Standard imageTable 3.
NEE light-response curve fitted parameters. The Michaelis–Menten equation ( ) was used for curve fitting. Here, Pmax is maximum ecosystem photosynthesis or ecosystem photosynthesis capacity, Rd is ecosystem dark respiration, α is apparent quantum yield to indicate the efficiency of ecosystem light utilization under low light condition. r2 and p are determinant coefficient and regression significance, respectively.
| ALS-Winter | ALS-Summer | DHS-Winter | DHS-Summer | CLS-Winter | CLS-Summer | |
|---|---|---|---|---|---|---|
| Pmax | 9.0671 | 19.557 | 12.5785 | 11.2534 | 21.9381 | 21.8871 |
| Rd | 0.1388 | 3.1334 | 1.567 | 2.6294 | 1.8868 | 4.6112 |
| α | 0.0541 | 0.0816 | 0.0244 | 0.0261 | 0.0336 | 0.0544 |
| r2 | 0.3211 | 0.4259 | 0.4079 | 0.3935 | 0.7952 | 0.7242 |
| p | <0.001 | <0.001 | <0.001 | <0.001 | <0.001 | <0.001 |
4. Discussion
4.1. Continuous photosynthesis during winter
Evergreen species are not necessarily continuously photosynthetically active throughout winter; for example, although boreal forests are evergreen, their photosynthesis is often dramatically inhibited or even halted during cold winter periods (Ottander et al 1995). Winter temperatures are mild in Asian subtropical areas, and subfreezing temperatures are uncommon (figure s2 available at stacks.iop.org/ERL/7/044017/mmedia). The results show that, under this climate, trees not only avoided injury during low winter temperatures, but also maintained continuous photosynthesis (figure 2). Leaf-level experimental data at the ALS site show that the historic minimum temperature was never lower than the leaf-lethal temperature corresponding to 50% membrane damage (figure 3). Although the maximum leaf CO2 assimilation rates of the top-10 species (importance value) were lowest in the coldest month (except Lyonia ovalifolia and I. macranthum; figure 2), leaves maintained an assimilation rate of around 50% of peak values during this period, and never fell below 4 μmol m−2 s−1. This finding differs from that reported for Sitka spruce (Picea sitchensis), which showed a very low photosynthetic rate, approaching zero, during cold periods (Neilson et al 1972). These are considerably high values for carbon sequestration, as respiration losses declined strongly for low temperature (figure 4). Similar to leaf-level measurements, maximum ecosystem photosynthesis (Pmax) at the ALS site during winter was around 50% of that during summer (figure 7; table 3). For the DHS and CLS sites, Pmax in winter was slightly higher than in summer (table 3). Greater Pmax in winter observed in DHS and CLS could be caused by enhanced radiation (reduced cloudy cover) and their more low-temperature resistance needle leaf type. The annual cycle of midday mean net ecosystem exchange confirmed considerable and continuous levels of photosynthesis during winter at all three forests.
4.2. Warm summer has limited photosynthetic benefit
Gross ecosystem exchanges (GEE) of all three forests were higher in summer than in winter (figure 5). Photosynthetic rate showed limited increase at higher temperature. Mean GEE for ALS, DHS and CLS was −3.69 μmol m−2 s−1, −2.84 μmol m−2 s−1, −3.12 μmol m−2 s−1 in winter and −6.03 μmol m−2 s−1, −4.14 μmol m−2 s−1, −4.45 μmol m−2 s−1 in summer, respectively. The highest summer-time GEE at these three sites was lower than that of the temperate deciduous forest at Harvard (∼ − 10 μmol m−2 s−1) (Urbanski et al 2007) or the boreal aspen forest in Saskatchewan (∼ − 12 μmol m−2 s−1) (Barr et al 2007), and were similar to that reported for the boreal black spruce forest in Manitoba, which is at the northern limit of the continuous boreal forest (∼ − 6 μmol m−2 s−1) (Dunn et al 2007). The low summer-time GEE at the three study sites may be attributable to their evergreen phenotype, as deciduous species will enhance photosynthesis capacity under favorable conditions (Givnish 2002). The question remains of why trees do not shed their leaves during winter and then produce new leaves with higher photosynthetic capacity in order enter the summer season with improved water availability, warm climate and nutrient-rich soil contributed by litterfall; the radiation environment may account for this point. The Sun–Earth relationship would predict increased radiation during summer for locations ∼24°N. However, cloud formation reduced sunshine hours and, subsequently, solar radiation during summer (figure s3 available at stacks.iop.org/ERL/7/044017/mmedia). This means there is no competitive advantage for deciduous species to increase photosynthetic capacity when light is limited. As a result, GEE is higher during summer for higher temperature and abundant water conditions, but is limited in response to reduced solar radiation related to increased cloud formation.
4.3. Exponential increase of respiration with temperature
The dependence of respiration processes on temperature is well documented (Mahacha et al 2010, Bond-Lamberty and Thomson 2010). Soil respiration observed during warm autumns (∼5 μmol m−2 s−1) is three or four times the levels observed during winter (∼1.5 μmol m−2 s−1) (figure 4(a)). Soil respiration rates increase exponentially with temperature, as evidenced by the temperature sensitivity index (Q10) value of 2.81 (figure 4(b)). The two other main determinants of soil respiration are water condition and substrate (Davidson et al 1998, Tang et al 2005). The three study forests are classed as cloud forest, with high annual rainfall and humidity (figure s3 available at stacks.iop.org/ERL/7/044017/mmedia). The annual rainfall in ALS and DHS is approximately 2000 mm, which is similar to that of a typical rainforest (Da Rocha et al 2009). In comparison, annual rainfall at CLS is far greater, at >4000 mm (table 1). The annual rainfall data suggest that respiration in these forests will not be limited by insufficient water availability, even during a dry year. On the other hand, high soil carbon storage indicates that the substrate will play a minor role in limiting respiration (figure s4 available at stacks.iop.org/ERL/7/044017/mmedia). The large amounts of carbon stored in soil organic matter, forest-floor litter and coarse woody debris will provide a continuous substrate supply for respiration carbon losses; respiration will increase strongly with temperature and will not be limited by availability of water or substrate supply.
4.4. Annual temperature and carbon sequestration levels
It is very difficult to determine the major factor in the inter-sites differences observed in NEE because the three forests differ in stand age, forest type, climate, soil type and stand history (table 1). Stand age is an important factor affecting carbon balance. According to Odum (1969) succession scheme, the old-growth forest at the ALS site should be at equilibrium state or a slight carbon sink, and the 50 year-old CLS forest should show peak carbon sequestration. However, the observations were inconsistent with such predictions. Previous studies have also reported findings that differed from those expected from the succession scheme. Observations by Kira and Shidei (1967) in temperate forests, and by Amiro et al (2010) and Goulden et al (2011) in boreal forests all indicate that NEE peaked before 40 years (mostly 20-year-old stands) and subsequently showed either steady state or decline. Those results suggest that the stand-age effect will be diminished in the present comparison, as the youngest stand in the study was more than 50 years old.
In terms of the explaining the species structure at a given location, Kerner von Marilaun (1898) concluded that, 'the reason for plants living together lies in the nature of the habitat'. The three naturally established forests in the present study have interacted with their environments more than 50 years. Their current structure is nature's answer to a given environmental matrix (Körner 2003). In terms of assessing which environmental variable in the matrix plays a leading role in controlling the NEE pattern in these forests, the observation data show that neither rainfall level nor solar radiation, but rather temperature can explain the inter-site differences in NEE (figure 8; table 1). As discussed above, local rainfall is sufficient to support the ecosystems. If radiation was the dominant environmental variable, NEE at the DHS rather than the CLS site should rank second (table 1). The lowest dark respiration (Rd) was observed in the DHS forest, which had highest mean annual temperature (Ta) in addition to the lowest maximum ecosystem photosynthesis rate (Pmax) and apparent quantum yield (α) (table 3). The ratio of Pmax to Rd at DHS is lowest in respect to smallest NEE and highest Ta. The highest Pmax-to-Rd ratio was found in the ALS forest, as expected. Although both Pmax and Rd were highest in the CLS forest, the Pmax-to-Rd ratio was moderate. Thus, temperature is key factor in the inter-sites differences in NEE.
4.5. A simple prediction
A simple prediction was made, on the assumption that both photosynthesis and respiration will increase exponentially with temperature (figure 9). As seen from figure 9, the ecosystem carbon sink (dashed area) will weaken or even convert to become a carbon source. This prediction was supported by observations. In addition, it should point out that only short-term data was collected to derive the temperature sensitivity of respiration and photosynthesis in this simple prediction. In sophistic models, the factor that longer-term temperature acclimation tends to reduce the temperature sensitivity (indicated by Q10) should be considered.
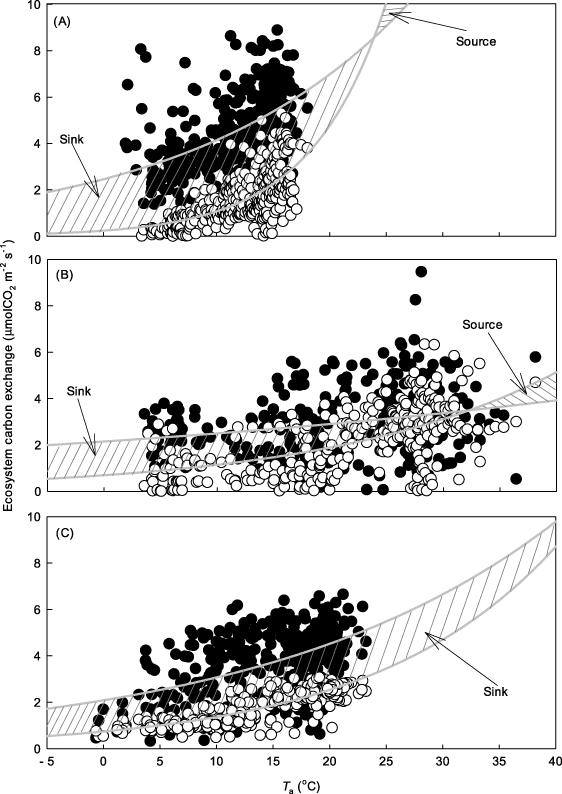
Figure 9. Assumption that temperature change produces exponential change in ecosystem respiration (open circles) and photosynthesis (solid circles); the resulting net ecosystem production (the dashed area) will be weaker with the increase of temperature. For ALS (a) and DHS (b), the ecosystem will become a carbon source above a certain temperature. For CLS (c) the sink will be weaker.
Download figure:
Standard imageWarming in East Asian subtropical evergreen forest ecosystems contributes little to photosynthesis, yet significantly increases ecosystem respiration. Consequently, warming would reduce NEE and weaken the existing carbon-sink function.
Nevertheless, temperature is only one of the factors related to regional and global climate change. Multiple other factors, including changing land-use patterns, elevated CO2 concentrations and nitrogen deposition all function interdependently to affect ecosystem carbon balances. We have not considered elevated CO2 in our experiments and inclusion of elevated CO2 in our experiment could have dramatically altered the findings. Ecosystem-level manipulation experiments are necessary to track the multi-factor interactions between processes that affect ecosystem response to global or regional climate change.
Acknowledgments
Thanks to two anonymous reviewers and one Board Member for giving us their insightful and constructive comments and sharing their knowledge in the field with us. We thank our students for their assistance in collecting field data at the ALS, DHS and CLS forest sites, and for maintaining the eddy flux equipment. We are grateful to You Guangyong, Zhang Pengchao, Li Linhui and Yu Lei for their assistance at the ALS site. This research was supported by the National Science Foundation of China (31200347, 40571163, 41071071, 41001063, 40801035), the Development Program in Basic Science of China (2010CB833501) and the Knowledge Innovation Program of the Chinese Academy of Sciences (KJCX2-YW-432-1, KZCX2-YW-Q1-05-04, KZCX1-SW-01-01A). We acknowledge ChinaFLUX and TaiwanFLUX for granting permission to publish the results of this study. The authors declare there are no conflicts of interest related to this study.