
Abstract
Sustainable mobility policy for long-distance transportation services should consider emerging automobiles and aircraft as well as infrastructure and supply chain life-cycle effects in the assessment of new high-speed rail systems. Using the California corridor, future automobiles, high-speed rail and aircraft long-distance travel are evaluated, considering emerging fuel-efficient vehicles, new train designs and the possibility that the region will meet renewable electricity goals. An attributional per passenger-kilometer-traveled life-cycle inventory is first developed including vehicle, infrastructure and energy production components. A consequential life-cycle impact assessment is then established to evaluate existing infrastructure expansion against the construction of a new high-speed rail system. The results show that when using the life-cycle assessment framework, greenhouse gas footprints increase significantly and human health and environmental damage potentials may be dominated by indirect and supply chain components. The environmental payback is most sensitive to the number of automobile trips shifted to high-speed rail, and for greenhouse gases is likely to occur in 20–30 years. A high-speed rail system that is deployed with state-of-the-art trains, electricity that has met renewable goals, and in a configuration that endorses high ridership will provide significant environmental benefits over existing modes. Opportunities exist for reducing the long-distance transportation footprint by incentivizing large automobile trip shifts, meeting clean electricity goals and reducing material production effects.
Export citation and abstract BibTeX RIS
1. Background
Deployment of new and more fuel-efficient transportation modes is expected in the coming decades. Next generation automobiles and aircraft are already entering the market. Despite major political and economic roadblocks in the United States, federal, state, and regional transportation and land-use planners are discussing high-speed rail (HSR) as a potentially better investment for future mobility. The discussion of new transportation options is often coupled with the identification of strategies to help reduce congestion and travel times. With increasing populations and long-distance transportation demand forecasts, HSR was made a centerpiece of the American Recovery and Reinvestment Act as a modal diversification strategy. While several corridors are under study, California in 2008 authorized $9.95 billion in bonds for their 1200 km system and the state legislature recently approved funding to start construction. Engineering and planning work are already underway, with possible groundbreaking in 2013 (CAHSRA 2012). While many technical, legal, economic, community and political battles loom, the California HSR (CAHSR) Authority has made significant progress towards deploying the system, which will connect Sacramento, San Francisco, Los Angeles and San Diego. In addition to direct mobility benefits, CAHSR has the potential to reduce long-distance transportation energy consumption and air emissions, provided measures are taken to encourage high ridership, minimize construction effects, and establish clean electricity contracts (Chester and Horvath 2010).
To understand the comprehensive energy and air emissions effects of deployment and adoption of CAHSR, a life-cycle assessment (LCA) framework should be used to assess future modes in the California corridor. The energy and environmental tradeoffs of CAHSR have been examined with then-planned vehicles and fuels (Chester and Horvath 2010) by constructing a life-cycle inventory using information from CAHSRA (2005), the then-current design data and with groundbreaking expected around 2010. However, many new corridor plans and design considerations have been made warranting new outlooks for the system. Forecasts for a future long-distance transportation system should include emerging and expected automobile, aircraft and HSR improvements. In this study, an environmental assessment of future long-distance travel is developed using the California corridor as a case study. We start by developing a per passenger-kilometer-traveled (PKT) attributional assessment of future transportation systems that expands the results of Chester and Horvath (2010) by evaluating (i) emerging automobiles and aircraft, (ii) new train designs, and (iii) low-carbon electricity scenarios. We then develop a consequential assessment for the corridor to determine the net effects of the decision to build a new HSR system. Following our past work, we identify the critical system design parameters that lead to transportation systems having larger or smaller human and environmental footprints than their competitors. Our goal is to identify the potential design, construction and operation pitfalls early so that transportation planners and operators can reduce future impacts at potentially lower cost.
The goal of this research is to develop a framework for assessing the environmental effects of long-distance transportation in the California corridor to provide more comprehensive measures of the greenhouse gas, human health and other environmental damage potentials of future systems. We anticipate that this framework will (i) aid policy and decision makers in the assessment of long-distance transportation options, (ii) provide HSR designers, engineers and operators with information on how to best reduce environmental damage potentials, and (iii) provide a standard methodology by which other US and international transportation systems can be evaluated.
2. Methodology
An environmental assessment is developed for automobiles, aircraft and HSR operating in the California corridor between 2030 and 2050. When performing an LCA a year of analysis is generally defined. We choose to evaluate modes in a two-decade range to acknowledge the uncertainty in adoption of HSR and the challenges of estimating future life-cycle process improvements in a single year.
LCA is the preeminent framework for evaluating the energy and environmental effects of complex systems and can be used to understand the tradeoffs of transportation decisions. Life-cycle inventorying (LCI) is one stage of LCA, the quantification of environmental flows. Impact assessment must be performed to connect physical flows to the human health, ecosystem quality, climate change and resource effects of ultimate interest (ISO 2006, Jolliet et al 2003). End-use energy and air emissions are first inventoried. Air emissions include greenhouse gases (GHG) and conventional air pollutants (SOx, CO, NOx, VOCs, PM10 and PM2.5). GHGs are reported as CO2 equivalence (CO2eq) using radiative forcing multipliers of 25 for CH4 and 298 for N2O for a 100 yr horizon. The US Clean Air Act established a regulatory framework for criteria air pollutants to reduce direct human and environmental impacts. SO2, CO, NOx, PM and ozone are regulated through National Ambient Air Quality Standards. We evaluate NOx and VOCs because they are ozone precursors.
The LCI results are joined with human and environmental impact characterization factors from the Tool for the Reduction and Assessment of Chemical and Other Environmental Impacts (TRACI, v2.03) in the development of a life-cycle impact assessment (LCIA) (Bare et al 2002). Impact characterization factors are used to show the maximum potential effects of pollutant releases. In addition to global warming (CO2eq), human health respiratory, acidification, tropospheric ozone (smog) and eutrophication impact potentials are determined. We stress that impact potentials are the maximum effects that can occur and actual effects may be lower, or potentials may never turn into damages. However, given the challenge of combining air transport and chemistry modeling with concentration-response functions, endpoint damages have not been determined for this study. Bare et al (2002) provide background for TRACI and how air emissions are used to determine impact potentials.
2.1. Efficient and electric automobiles
Improved gasoline efficiency and plug-in hybrid electric vehicles (PHEV) are expected to have significant market penetration by 2030 (EPRI 2011). The 2007 US Energy Independence and Security Act established fleet-wide fuel economy standards at 35 mpg (15 km l−1) by 2020. Furthermore, the US EPA and the National Highway Traffic Safety Administration have proposed a 102 g km−1 CO2 standard for 2025, which is equivalent to a fuel economy of 54.5 mpg (23 km l−1) (EPA 2011). Given these policies and trends, it is reasonable to expect future long-distance automobile travel to occur in a vehicle that has improved fuel economy from the 21 mpg (9.6 km l−1) average today (ORNL 2011). While a fuel economy standard does not translate to actual onroad performance, the range of economies modeled is intended to illustrate future potential performance of improved vehicles. Congestion effects are not modeled and it is acknowledged that this would increase the automobile footprint. Second-generation biofuels are likely to be a widespread transportation fuel in the future (Scown et al 2012), but we focus on reformulated-gasoline and electric vehicles.
Vehicle manufacturing, battery manufacturing (including replacement) and operation are evaluated with the GREET 1 (fuel-cycle) and 2.7 (vehicle-cycle) models (ANL 2011). A 35 mpg, 1500 kg sedan and a 55 mpg, 900 kg (before batteries) PHEV (ANL 2011) are modeled to meet future fuel economy standards. Large battery pack plug-in and battery electric vehicles are expected to have market penetration gains in the next decades, and we evaluate a PHEV60 (60 mi, 97 km all electric range) assuming that the first 97 km of a 480 km California long-distance trip are in charge-depleting mode and the vehicle is configured as a parallel hybrid drivetrain. GREET models vehicle emissions with a drive cycle that is 43% city and 57% highway. Using drive cycle characterizations from Karabasoglu and Michalek (2012), vehicle emissions are adjusted assuming that the beginning and ending 24 km of the trip occur in cities with the remainder occurring on highways. We believe that our PHEV60 assessment is conservative as future vehicles may have improved battery energy densities and intelligent operational controls that more effectively utilize a blended mode. The PHEV60 is modeled with one lithium-ion battery replacement and specifications are consistent with those modeled by Michalek et al (2011). All automobiles are evaluated with a 260 000 km lifetime. Brake wear, tire wear and evaporative losses are included. General maintenance and tire replacement are evaluated using EIO-LCA (GDI 2011). Lead-acid and lithium-ion battery replacement are evaluated with GREET. The energy and environmental effects associated with insurance industry operation (e.g., electricity consumption, waste management) are captured using EIO-LCA (GDI 2011).
The energy inputs and air emission outputs generated by the construction and maintenance of the California highway (interstate and major arterial) system serve as the infrastructure basis for future long-distance statewide travel. There are currently 12 100 km of California highways facilitating 250 billion annual vehicle-kilometers-traveled (VKT) (FHWA 2009). Across all California roadways there are 380 billion annual VKT and this is forecast to increase to 480 billion VKT by 2040 absent a HSR system (CAHSRA 2012). The 74% of asphalt surfaces are specified with a 15 yr life and concrete surfaces at 25 yr (both surface sub-bases are assumed to last 100 yr). Material production, transport, equipment process, and direct emissions from construction and maintenance activities are modeled with PaLATE (2004). Roadway construction effects are allocated to vehicles based on VKT splits and maintenance to heavy duty vehicles since damage follows a fourth-power relationship to axle load (Huang 2004). Roadway design specifications, herbicide use and overhead lighting are included (Chester 2008).
Gasoline vehicle and PHEV60 energy production are evaluated with GREET and are specified with parameters commensurate with Michalek et al (2011). California reformulated gasoline is used, and GREET estimates that 18% of crude oil feedstock will be extracted from oil sands by 2020. For the PHEV60 and CAHSR, future regional electricity is used (this is detailed in later sections). Gasoline and electricity production include raw fuel feedstock inputs, transportation, processing (or generation) and distribution.
2.2. High-speed rail
HSR effects are determined following the approach of Chester and Horvath (2010) but updated to acknowledge that a future CAHSR system will likely see improved train performance and an opportunity for increased renewable electricity usage. The assessment by Chester and Horvath (2010) was designed to evaluate the high-speed rail system specified by CAHSRA (2005) under a life-cycle lens. CAHSRA (2005) performs an energy assessment based on large 1200 seat trains consuming an exaggerated 170 kWh of electricity per VKT. Despite acknowledging this over-estimate, Chester and Horvath (2010) chose not to redesign the CAHSRA (2005) system or challenge the publicized parameters. Given the uncertainty in the CAHSRA (2005) propulsion electricity estimate, primary data collection exercises were undertaken to develop improved electricity consumption estimates for a future CAHSR train. In this study, we evaluate three train sizes (400, 670 and 1200 seats) and use actual electricity consumption outcomes from Deutsche Bahn, instead of relying on literature. A range of HSR propulsion electricity exists in the literature and a survey and comparison are performed in the supplementary information (SI, available at stacks.iop.org/ERL/7/034012/mmedia). Actual electricity consumption factors for ICE trains (preliminarily chosen by CAHSRA 2005) were gathered from Deutsche Bahn (2011) and correspond to those reported by IFEU (2011) resulting in 13, 20 and 36 kWh/V KT for the respective train sizes. Regenerative braking effects are included. It is possible that the trains deployed in California will be several generations newer and will consume less electricity, but without data on future technologies we choose not to make projections, and instead assume current state-of-the-art technology for CAHSR.
A study has been performed for the CAHSR Authority to evaluate the feasibility of deploying wind and solar electricity to meet system-wide electricity demands (Navigant 2008) and strategies have been developed to power the stations and trains with 100% renewable energy (NREL 2011). While funding for a renewable electricity infrastructure remains uncertain, this future configuration is considered using existing PV and solar study LCIs (Pehnt 2006) with an 80% wind and 20% solar mix.
Vehicle (manufacturing, maintenance and insurance), infrastructure (construction, operation, maintenance and parking), and non-renewable electricity generation scenarios follow the methodology used in Chester and Horvath (2010, 2011) and are adjusted for future electricity inputs. The infrastructure assessment matches the results of Chang and Kendall (2011) when a commensurate system boundary is used. Whenever possible, we apply the Western Electricity Coordinating Council (WECC) electricity mix generation emission factors to scenario life-cycle components. Without a contract to purchase electricity from a particular supplier, electricity consumption by CAHSR should be evaluated in the WECC reliability network (Marriott and Matthews 2005), capturing flows across nearby states, including imports to California. Vehicle and infrastructure effects from WECC electricity use are based on a mix that has reached 2020 Renewable Portfolio Standards (WECC-RPS) (WECC 2011). Furthermore, a projected 2040 mix that has reduced coal inputs resulting in 60% carbon emissions intensity of today is also included (WECC-2040).
2.3. Next generation aircraft
Midsize aircraft (130–160 seats) were responsible for 79% of domestic US air travel PKT in 2009 (BTS 2011) and current and future planes are evaluated to capture significant improvements in engine fuel use and emissions. A Boeing 737–800 is used to evaluate currently operating state-of-the-art aircraft. The 737–800 seats 160 and uses CFM56-7B26/2 engines. The Bombardier CS300-ER is an emerging aircraft that offers 20% fuel savings (and commensurate GHG savings) and additional emissions reductions over in-service planes. The CS300-ER will use Pratt and Whitney (PW) 1524G PurePower engines offering propulsive efficiency gains while carrying up to 130 passengers. For both aircraft, maintenance and insurance costs are based on 737–800 airframe materials, engine materials, insurance and hourly costs of employee benefits, reported by BTS (2011). To provide perspective on energy and environmental gains in air travel, the 737–800 and CS300-ER are compared against the legacy Boeing 737 series ( < 800) which has been a workhorse of the mid-haul market (Chester and Horvath 2010).
Fuel and emission indices are used to determine landing–takeoff (LTO) and cruise phase effects for a San Francisco to Los Angeles flight. In previous studies, LTO effects were determined with FAA (2010) and cruise phase with EEA (2006) data. These software and data do not offer the flexibility or transparency to evaluate future engine improvements. FAA (2010) reports fuel and emission indices which are combined with time-in-mode and rated thrust estimates to determine total flight effects for the 737s. The CFM56-7526/2 engines on the 737–800 achieve 25% reductions in CO, 27% in HC, 31% in NOx, and 97% in smoke emissions relative to CAEP6 engine emission standards (ICAO 2010). ICAO (2010) does not yet report PW1524G engine testing results, however, Hoke (2011) reports 64% reductions in CO, 96% in HC, 58% in NOx, and 50% in smoke emissions relative to CAEP6 standards, which were used to determine the CS300-ER flight emissions. Flight LTO and cruise fuel consumption and emissions were validated by PW engineers (Pratt and Whitney 2011). Aircraft energy and environmental effects are determined with fuel and emission indices and rated thrust estimates by flight phase (see the SI for details, available at stacks.iop.org/ERL/7/034012/mmedia). The potential for respiratory, acidification and eutrophication impacts from non-LTO emissions are included (Barrett et al 2010, Tarrasón et al 2002).
3. Modal attributional footprinting
The assessment and allocation of direct and ancillary processes to each transportation mode reveal the life-cycle activities that should be targeted for the greatest environmental improvements. Consistent with existing transportation LCA studies, results are normalized to a per-PKT functional unit to evaluate the effectiveness of providing passenger mobility. For automobiles and CAHSR, a dearth of data exists to provide a rigorous assessment of expected occupancy rates. For aircraft, detailed reporting provides strong indicators for future utilization (BTS 2011). To avoid universally characterizing modal performance by normalizing to an average occupancy, reasonable and expected high and low occupancies are assessed to capture the potential of modes. For all modes, the high occupancy is the number of seats. Low occupancies are designed to consider off-peak ridership. While it is possible for CAHSR and aircraft to operate with a single passenger, this outlying case is not informative and therefore not shown. Low occupancy for CAHSR is approximately one-quarter of seats, and for aircraft is the lower occupancy quartile in 2009, determined from BTS (2011). Figure 1 shows global warming and human health respiratory life-cycle results for each mode for high and low occupancy.
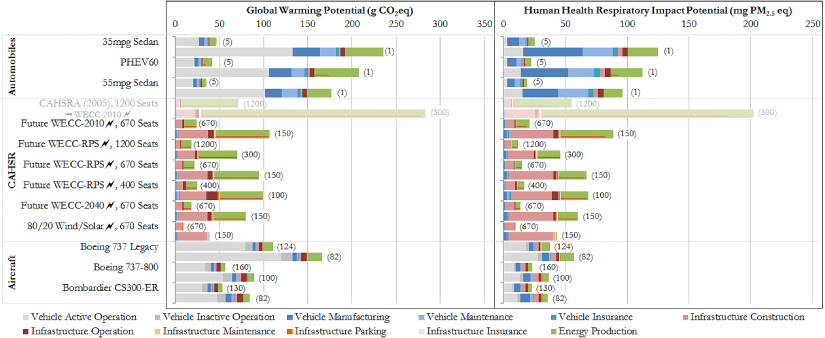
Figure 1. Global warming and human health respiratory impact potential results per PKT. For each mode, results at long-run average high and low occupancy (shown in parenthesis) are displayed as juxtaposing bars. Previous research by the authors reported electricity generation effects for electric vehicle propulsion in the Vehicle Operation life-cycle groupings. In an effort to improve the spatial characterization of effects, electricity generation for CAHSR propulsion is reported in Energy Production and differentiated from upstream effects (e.g., emissions from fuel extraction and transport) by a red line. The CAHSRA (2005) train is shaded gray to emphasize that it is an unlikely outcome, but reported for comparative purposes.
Download figure:
Standard imageGHG emissions are dominated by vehicle propulsion (energy production for CAHSR and vehicle operation for automobiles and aircraft) but show increases of 38–54% for automobiles, 77–116% for future CAHSR and 13–34% for aircraft when all life-cycle components are included. Results for future long-distance modes are consistent with those identified in past transportation LCA studies (Chester and Horvath 2010, 2009) even when new data and modeling are included (ANL 2011). Automobile vehicle manufacturing is dominated by steel and plastic use (ANL 2011), and maintenance effects are largely the result of supply chain electricity (GDI 2011). CAHSR infrastructure construction effects are dominated by concrete use. Approximately 67% of CAHSR infrastructure emissions are the result of cement production for concrete use and 9% are related to steel production. Automobile infrastructure effects are small compared to past studies because only highways are included to isolate long-distance infrastructure. The inclusion of trip-specific infrastructure provides a clearer comparison of corridor travel by focusing only on roads, tracks and airports needed for each trip. Non-propulsion fuel-cycle effects are primarily the result of refineries, oil and gas extraction activities, and supply chain electricity use (ANL 2011, GDI 2011). With distributed hard infrastructure and its long-distance nature, the life-cycle effects of air travel are diminished when results are normalized per PKT. WECC-2040 electricity reduces HSR GHG propulsion emissions by 26% but infrastructure construction effects continue to add heavy burdens to life-cycle results showing the need for low-CO2 materials.
Across modes and life-cycle groupings, PM10 emissions are often generated by mining activities for raw materials, and PM2.5 emissions by supply chain combustion processes including electricity generation, the latter contributing to human health respiratory impact potentials. While PHEV60s produce fewer PM2.5 emissions during propulsion, battery manufacturing and associated electricity requirements have the potential to contribute significant PM2.5 and SOx emissions and increase respiratory impacts beyond the 35 mpg sedan. This implies that strategies should be developed that minimize human and environmental exposure as the battery industry expands, and that meeting or exceeding RPS standards will reduce impacts across automobiles and CAHSR. For CAHSR, concrete and steel production including upstream mining activities are larger than propulsion effects. The dominating share of environmental impact potentials are often in non-propulsion components and are shown in figure 2.

Figure 2. Environmental impact potentials per PKT.
Download figure:
Standard imageSeveral common processes dominate the environmental impact potentials. Vehicle manufacturing and maintenance are affected by assembly activities, but are dominated by the use of metals (i.e., steel, aluminum and copper) and its associated electricity demands for processing. Supply chain truck transport for these processes also contributes heavily to CO, NOx and VOC emissions. Asphalt and concrete use dominate infrastructure construction and the use of these materials is affected primarily by direct emissions at hot-mix asphalt and cement kilns, and their associated electricity demands. Airport ground support equipment use contributes heavily to aircraft life-cycle results. For automobiles and aircraft, fuel production effects are largely the result of refinery electricity demands and extraction activities, and for HSR are dominated by primary fuel extraction, processing and transport. Air pollutant emission reductions may achieve the largest benefit-to-cost ratio by targeting infrastructure and supply chain effects.
Assuming that options exist, the decision by a traveler to take a mode produces marginal effects in the short-run, a subset of those reported in figures 1 and 2. For example, the decision to walk instead of driving immediately avoids fuel consumption and emissions from vehicle operation. Including mid-run life-cycle components avoids vehicle manufacturing, vehicle maintenance, vehicle insurance, infrastructure maintenance, and associated supply chain effects including fuel refining. Ultimately, a critical mass of travelers choosing to walk instead of drive would have long-run effects including reductions in roadway capacity needs avoiding future infrastructure construction. Marginal effects are critical for understanding the change in energy or environmental outcomes from a policy or decision. Long-run average effects are reported to provide a comprehensive set of indicators for analysts, however, future analyses with these results should consider marginal effects at specified timescales. Long-, mid- and short-run average and marginal comparisons are presented in the SI (available at stacks.iop.org/ERL/7/034012/mmedia).
Considering the potential of a mode to environmentally outperform another is critical to developing strategies that acknowledge different long-term operating characteristics. Modal potential considers the occupancy range in which transportation systems operate instead of averages which can mask peak and off-peak, position along lines and day-of-week characteristics, to name a few. Future CAHSR ridership forecasts have been developed and scrutinized (Brownstone et al 2010). Designs that do not access airports and city centers, hub existing transit at HSR stations and encourage urban infill are inimical to high ridership, and risk disincentivizing trip takers switching from autos. Technical, political, community and economic roadblocks exist for many high ridership configuration options that could ultimately lead to lower than optimal adoption outcomes. Furthermore, even with high ridership configurations, the system will at times (whether during off-peak or end-of-lines) exhibit fluctuations and these instances should be considered in policies that target marginal operation. Given the large uncertainty in a future HSR system's ridership, figure 3 shows the CAHSR life-cycle and vehicle propulsion effects at varying occupancy levels against a current mean occupancy automobile and midsize aircraft (represented as a 2.2 passenger 35 mpg sedan and 116 passenger 737–800).

Figure 3. CAHSR global warming and acidification potential sensitivity to vehicle occupancy. Life-cycle results are shown as solid colored lines and vehicle propulsion as dotted. Breakeven points are shown as red and green shapes on the figure and corresponding ridership levels are shown on the right side. While average occupancies are shown for the 35 mpg sedan and 737–800, their potential ranges are shown as vertical lines on the right side.
Download figure:
Standard imageThe sensitivity to vehicle occupancy is used to illustrate breakeven points, or the ridership levels where one mode is equivalent to another in the long-run. Occupancy levels of between 80 and 280 passengers produce HSR GHG-equivalency to future automobiles or aircraft (depending on train size). However, for acidification potential, this equivalency increases to between 160 and 420 passengers, or roughly 35–40% average occupancy for trains. This assumes that the WECC has met the RPS. The acidification breakeven points capture the dynamic of mode switching from low-sulfur liquid fuels to high-sulfur electricity and reaffirm the findings of Chester and Horvath (2010) that deployment of HSR should occur with mandates for cleaner propulsion electricity sources to avoid increased human and environmental impact potentials. The breakeven point assessment highlights the importance of future ridership scenario considerations in the determination of potential corridor effects.
4. Regional consequential effects
To evaluate the net effects of the decision to implement a new system in the corridor, a consequential assessment is developed. A consequential assessment should compare a without HSR future where additional automobile and aircraft capacities are needed to meet growing demands to a with HSR future where the new rail system reduces the need to fully build this capacity. Estimates of this capacity expansion have been produced by the Authority (PB 2011) and the LCA methods can be used to evaluate the change in effects in the corridor. The per-PKT results reported in figures 1 and 2 are valuable for understanding the footprint of each transportation system in the long-run but do not allow for direct assessment of the changes in corridor impacts when a new system is implemented. For example, an infrastructure will be constructed to facilitate an expected level of service for CAHSR. This infrastructure may be flexible to accommodate more passengers if demand is greater than anticipated. Yet if the per-PKT GHG results in figure 1 are applied to the different PKT demand forecasts, different net infrastructure construction effects would be falsely determined (i.e., the infrastructure construction effects remain the same with different ridership outcomes). While the attributional assessment can inform questions like: what are the major energy and environmental processes in the life-cycle of a transportation system, and how can they most effectively be reduced? A consequential assessment is needed to answer questions such as: how can California deploy a future multi-modal transportation system with the lowest human and environment impacts?
The energy and environmental costs of a new HSR system should be compared against the avoided costs of automobile and air infrastructure expansion, assuming there is long-distance travel demand growth. PB (2011) estimated that 3600 freeway lane km and 13 000 m of runways, and 115 additional airport gates are needed to meet growing corridor demand in the coming decades. This is the only assessment of future infrastructure expansion needs to date and it is possible that this is an aggressive estimate. PB (2011) estimates are based on full corridor future capacity (117 million auto and air trips) and the most recent forecasts estimate 33 million HSR trips at high ridership. Therefore, 28% of infrastructure expansion effects are considered (i.e., 1000 lane km, 3600 m of runways and 32 additional airport gates) to account for only the avoided effects of HSR travelers and may be an aggressive allocation because of induced demand. Using roadway design guidelines (AASHTO 2001), construction and maintenance energy and emissions were calculated with PaLATE (2004) following Chester and Horvath (2009). The runway expansion would come with an estimated 670 000 m2 of taxiways and tarmacs. Construction and maintenance of concrete runways and asphalt taxiways and tarmacs are also evaluated with PaLATE (2004) using dimensions reported by Chester (2008). For all surfaces, it is assumed that the wearing courses will last 20 yr and subbases 50 yr. It is also assumed that infrastructure expansion will start 10 yr after it has been decided not to build HSR, and will occur over 30 yr. Airport gate and corresponding concourse expansion construction follow the methodology of Chester (2008). Detailed construction and maintenance schedules for the infrastructure expansion are provided in the SI (available at stacks.iop.org/ERL/7/034012/mmedia).
Consequential effects are highly sensitive to modal shifts and forecasting of HSR energy and environmental effects should occur with uncertainty assessment. Forecasts for CAHSR adoption have only been reported by the Authority making rigorous uncertainty assessment challenging. Adoption discussions by the Authority have been presented through without HSR and with HSR forecasts. The consequential assessment considers the difference between these two, essentially, what environmental changes have occurred in California as a result of implementing HSR. The current forecasts report that by 2040 CAHSR Phase 1 (San Francisco to Los Angeles) will perform between 27 and 41 million annual VKT (PB 2012a). The Authority's medium with HSR forecast (34 million HSR VKT) displaces 5.8 billion auto VKT and 5.1 million air trips annually, generating between 20 and 33 million trips on the new mode (PB 2012a, 2012b). Using these forecasts, the Authority's medium (middle) projection is first evaluated to determine the consequential effects at full adoption in 2040. The WECC-RPS 670 seat HSR train is compared against displaced travel in a 35 mpg sedan and 737–800 aircraft (assumed to be reasonable representative vehicles for 2040). In the without HSR scenario, it is estimated that auto travel will increase from 380 billion VKT today to 480 billion VKT, and air travel will increase to 33 million trips (PB 2012b).
The deployment of CAHSR will create induced demand as a subset of trip takers who would not travel by auto or air now find the generalized cost for the journey lower than existing options (Outwater et al 2010). Additionally, access to and from HSR stations by autos and other modes may induce new system-wide demand. The CAHSRA (2012) with HSR forecast includes estimates of new trips and these are bundled in the aforementioned VKT. We model induced demand implicitly through the change in travel reported by CAHSRA (2012). A summary of the with HSR and without HSR consequential analysis critical parameters is provided in the SI (available at stacks.iop.org/ERL/7/034012/mmedia).
The consequential assessment evaluates the difference between a future where CAHSR has or has not been constructed. Figure 4 shows the GHG and acidification potential for operation/propulsion and other life-cycle (including the avoided expansion of auto and air infrastructure) effects aggregated per decade for Phase 1 of the system (San Francisco to Los Angeles). The cumulative effect curve shows the time until payback. Given the uncertainty in the forecasts (Brownstone et al 2010), a payback sensitivity analysis is performed on the high adoption scenario as reported by the Authority (41 million VKT). The sensitivity analysis evaluates how long it takes CAHSR to achieve payback given certain adoption levels (for perspective, the Authority's low adoption scenario is 66% of ridership in the high adoption scenario) and considers the high (H), medium (M) and low (L) scenarios followed by decreases of 5 million (m) annual riders.
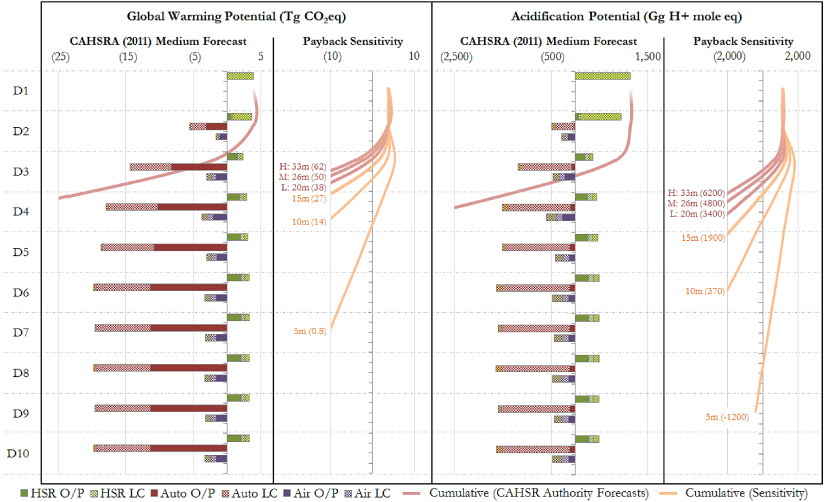
Figure 4. Decadal (D) consequential global warming and acidification potentials including payback for phase 1. O/P =operation and propulsion components (impacts from energy consumed to move vehicles). LC = life-cycle (excludes operation and propulsion components). Life-cycle effects are separated by infrastructure expansion (yellow background) and non-infrastructure (e.g., vehicle manufacturing and maintenance). After each ridership forecast (shown in millions (m) of annual trips in 2040), the 50 yr savings are shown in parentheses. These savings are the GHG or acidification benefit (negatives are costs) after 50 yr from groundbreaking.
Download figure:
Standard imageThe payback sensitivity reveals several important considerations for transportation planners and air quality policy makers. The cumulative plum-colored lines for the high, medium and low forecast figures show that the GHG payback will likely occur between 20 and 30 yr (D3) after groundbreaking and acidification potential after 20–40 yr. However, payback is highly sensitive to reduced automobile travel. The 5.8 billion auto VKT displaced dominate emissions changes in the corridor and the effects from reduced air travel and CAHSR are small. The reduced auto impacts are significantly affected or dominated by life-cycle components, in particular, avoided vehicle manufacturing, vehicle maintenance and gasoline production. For GHGs the sooner the system is implemented the more opportunity it will have to help meet GHG reduction policies aiming for 80% of 1990 statewide emissions by 2050. Larger trains or more carbon-intensive electricity generation will delay the payback further. Acidification, the release of SOx and NOx emissions which are of concern for respiratory and cardiovascular (through secondary particle formation) effects, agricultural impacts and increased built environment maintenance costs, are dominated by life-cycle processes. For infrastructure life-cycle processes acidification is dominated by the combustion of sulfur-bearing compounds in clinker manufacturing for cement used in concrete freeways, and for non-infrastructure life-cycle processes supply chain electricity use. Ultimately, impacts should account for the time-based radiative forcing of GHGs, high-altitude CO2 emissions effects, and the shifting of human and environmental effects from vehicle tailpipes to powerplants, to name a few additional factors. We reserve these analyses for future studies. The results of the consequential assessment are highly sensitive to automobile trips avoided and efforts should be made to validate the travel demand model used by the Authority.
5. Strategies for reducing environmental impacts
Given the dominating HSR life-cycle effects from electricity generation and infrastructure construction, strategies can be identified to reduce the system's footprint, prior to its construction and use. First, by meeting the RPS, GHG and NOx emissions will be reduced by 12% and 22%. Next, emission control strategies are identified for reducing the infrastructure footprint. For GHGs, the use of supplementary cementitious materials (SCMs) such as fly ash or ground granulated blast furnace slag can reduce concrete's footprint by 14–22% depending on the mixture (Flower and Sanjayan 2007). It is expected that the portion of the infrastructure that impacts roadways will be required to use fly ash to meet California Department of Transportation requirements. Furthermore, if the Authority requires concrete producers to utilize cement kilns with selective catalytic and non-catalytic reduction (SR) advanced NOx controls, material production emissions can be decreased between 35 and 95%, reducing the potential for acidification, respiratory, smog and eutrophication potential impacts (EPA 2007). Lastly, the use of 100% renewables lowers electricity generation impacts (to only power generation facility construction effects) and combined with the infrastructure control strategies produces the greatest reductions. The effects of these strategies are shown in figure 5.

Figure 5. Energy and emission control strategies for reducing environmental impacts per VKT.
Download figure:
Standard imageThe impact reduction strategies can decrease GHGs between 12 and 69% and NOx emissions between 22 and 61%. The costs of implementing these strategies should be compared against other opportunities, particularly those identified by GHG and air quality policies. The 80/20 Wind/Solar train, outside of the infrastructure material footprint, has a payback within the first few years of operation and is equivalent to the GHG assessment developed by the Authority, based on NREL (2011), following California Environmental Quality Act requirements.
The transportation emissions reduction from CAHSR, if operating within a cap-and-trade system, should be evaluated. Cap-and-trade programs have been successfully implemented in the US for NOx and SOx, and California continues to discuss a GHG initiative. Cap-and-trade programs remove the potential of any single initiative to reduce aggregate emissions as offsets will be met by increases elsewhere in the economy (Millard-Ball 2009). This is because the cap is designed to equalize the marginal abatement cost and does not encourage each economic sector to undertake reductions. Furthermore, if road and rail emissions are part of the cap but aircraft emissions are not, then the only major GHG change resulting from HSR implementation will be the displaced airplane operational emissions. To meet GHG reduction goals, policy makers should consider where CAHSR potential reductions will be counted, whether that is in a cap-and-trade program or direct transportation mandates.
6. Planning for a sustainable mobility future
HSR has the potential to reduce passenger transportation impacts to people and the environment, but must be deployed with process and material environmental reduction measures and in a configuration that will ensure high adoption. We have highlighted the life-cycle hotspots that dominate modal success: (i) train size (affecting electricity consumption, frequency of service and ridership); (ii) infrastructure construction; and (iii) the fossil fuel intensity of the electricity mix. By identifying low and high adoption outcomes, the potential benefits can be discussed, instead of speculating on a normative long-distance transportation future, especially in light of large uncertainty that surrounds many critical factors of the system. Ultimately, this research aims to inform planners and decision makers about providing sustainable mobility options. Planners and policy makers should be asking how a future sustainable transportation infrastructure can be deployed to meet increasing travel demands with the lowest total cost, including externalities. The environmental benefits of HSR should be joined with other considerations when making decisions about the system. Ultimately, decision assessment should include changes in travel time, productivity, congestion, safety, transportation infrastructure resilience, freight synergies, urban development opportunities and employment, in addition to GHG, human health and environmental damages.
Acknowledgments
The authors would like to thank several organizations and individuals for their intellectual support of this research. Elizabeth Mitchell and Domingo Sepulveda of Pratt and Whitney, and Professor Alan Epstein of MIT and Pratt and Whitney were instrumental in helping us determine future aircraft fuel consumption and emissions. Constantin Vogt of Deutsche Bahn provided valuable information and data on the operations of an established HSR system. Jeremy Michalek, Orkun Karabasoglu (Carnegie Mellon University) and Constantine Samaras (RAND) provided invaluable guidance for the PHEV assessment. Finally, the authors would like to express profound gratitude to Lee Schipper, who passed away during the development of this study, and provided continuous support and encouragement.