
Abstract
Unknowns in future global warming are usually assumed to arise from uncertainties either in the amount of anthropogenic greenhouse gas emissions or in the sensitivity of the climate to changes in greenhouse gas concentrations. Characterizing the additional uncertainty in relating CO2 emissions to atmospheric concentrations has relied on either a small number of complex models with diversity in process representations, or simple models. To date, these models indicate that the relevant carbon cycle uncertainties are smaller than the uncertainties in physical climate feedbacks and emissions. Here, for a single emissions scenario, we use a full coupled climate–carbon cycle model and a systematic method to explore uncertainties in the land carbon cycle feedback. We find a plausible range of climate–carbon cycle feedbacks significantly larger than previously estimated. Indeed the range of CO2 concentrations arising from our single emissions scenario is greater than that previously estimated across the full range of IPCC SRES emissions scenarios with carbon cycle uncertainties ignored. The sensitivity of photosynthetic metabolism to temperature emerges as the most important uncertainty. This highlights an aspect of current land carbon modelling where there are open questions about the potential role of plant acclimation to increasing temperatures. There is an urgent need for better understanding of plant photosynthetic responses to high temperature, as these responses are shown here to be key contributors to the magnitude of future change.
Export citation and abstract BibTeX RIS
Carbon cycle processes control the relative partitioning of emitted carbon dioxide between the atmosphere, land surface and the ocean [1, 2]. The recent explicit modelling of these processes in Atmosphere Ocean General Circulation Models (AOGCMs) coupled with carbon cycle models, predicts a range of future atmospheric CO2 concentrations, and hence global warming, for a given emissions scenario [3, 4]. Land processes, that currently serve to provide a net sink from the atmosphere of CO2 emissions, have the potential to become dramatically less efficient under future climate conditions [5], with major implications for international agreements to mitigate warming. Yet estimates of the magnitude of the reduction disagree [3, 5].
Within the climate research community there is increasing emphasis on understanding and quantifying uncertainty in future projections of climate change. So far this has mainly focused on physical climate feedbacks [6–9] through variables such as the climate sensitivity (CS) [10] or the transient climate response (TCR) [6, 11] or considered emergent constraints arising from limiting total emissions of CO2 within simpler modelling frameworks [12–14].
Important steps forward have also been made looking at the relative contribution of uncertainty arising from carbon cycle processes. The C4MIP ensemble (Coupled Climate Carbon Cycle Model Intercomparison Project [5]) demonstrated a significant range of uncertainty in predicted temperature and atmospheric CO2. Although C4MIP contains a range of land carbon processes, distinguishing carbon cycle and physical processes requires either a simplified metric [5] or simplified carbon cycle models [15]. Results from [15] suggest that within C4MIP simulations, carbon cycle (land and ocean) processes represent only 40% of the contribution from physical process uncertainty.
Here we make a targeted re-evaluation of contribution to the overall uncertainty in future climate (physical and carbon cycle), arising specifically from the land component of the carbon cycle. We use a parameter perturbation approach as previously used to quantify the impact of atmospheric process uncertainty on CS [10] and atmospheric and ocean process uncertainty on TCR [11, 16]. We apply this methodology to the land carbon cycle component of a fully coupled climate–carbon cycle AOGCM (supplementary information available at stacks.iop.org/ERL/7/024002/mmedia), whilst keeping all other components (ocean carbon cycle and physical processes) invariant across the ensemble. The land surface configuration utilized for this study, models the exchange of energy, water and carbon fluxes, representing how plants and soils respond to changes in temperature, moisture and CO2. This model framework explicitly represents dynamical changes in vegetation cover in response changes in climate conditions. This enables vegetation changes to move beyond projections of equilibrium responses, that the previous generation of land carbon models relied on, to explore transient vegetation changes to rapidly evolving climate conditions [17, 18]. The other advance of dynamical vegetation models, compared to previous equilibrium classifications, is inclusion of CO2 fertilization effects which act to mitigate plant temperature and water stress [18].
We vary parameters relating to the sensitivities of plant photosynthesis and soil respiration to temperature; stomatal conductance; soil water availability and surface evaporation; and plant competition The six parameters and their ranges are as follows: the optimal temperature values for photosynthesis [19], Topt(K) was varied ±5° around the standard value of each plant functional type, similar to the range used in [20]; top leaf nitrogen concentration (as a fraction of carbon content) [19], NLO (kg N/kg C), was varied within a range (for each PFT) determined by available plant trait information [21] and simulated historical forest distributions; the maximum ratio of the internal to external CO2 concentration, which affects the maximum stomatal conductance [19], f0, was varied based on ranges estimated from calibration of land surface models against simultaneous fluxes of energy, water and carbon from a number of sites; the minimum leaf area index (LAI) that a plant functional type (PFT) needs to achieve before it begins to compete for space [22] minLAI, not being directly observable its range was determined by its ability to reproduce observed forest distributions; the critical level of the volumetric soil moisture concentration, below which soil moisture limits both plant photosynthesis [19] and surface evaporation, θcrit (m3 water/m3 soil), exploring a broad range from moisture limitations between the wilting and the saturation points and finally the 'Q10' temperature dependence of soil respiration [19] Q10 explored a range based on previous published estimates. 17 individual historical and future (using the A1B SRES scenario [23]) simulations were performed using a coupled carbon cycle climate model (HadCM3C), each exploring a different space in the parameter uncertainty ranges. The parameter values selected for each simulation and the over all ranges are detailed in table 1. The parameters, land surface equations and ranges are further documented in the supplementary information (available at stacks.iop.org/ERL/7/024002/mmedia) and [24].
Table 1. The parameter values for each ensemble member and the standard configuration are given in this table for the six effective parameters. Broadleaf and Needleleaf are the two tree plant functional types (PFTs). Parameters are covaried across PFTs for each parameter change. The maximum and minimum values are highlighted in bold for each parameter. * θcrit is defined here for the parameter perturbations in terms of a fraction of the difference between θwilt and θsat values (so values nearer unity means a critical water content nearer to the saturation level). In the standard run there was no single value for this fraction (as there is a small dependence on the soil type for this fraction, which is not accounted for here) but the spatial/soil type differences between values in the standard model are substantially smaller than the perturbation made in the ensemble. The mean of the standard value fraction in the unperturbed run is close to 0.37 across soil types.
| Table of perturbed land surface/terrestrial carbon cycle parameters | |||||||||||||||||
|---|---|---|---|---|---|---|---|---|---|---|---|---|---|---|---|---|---|
| Standard | A | B | C | D | E | F | G | H | I | J | K | L | M | N | O | P | |
| Top leaf nitrogen NLO (kgN/kgC) | |||||||||||||||||
| Broadleaf | 0.03 | 0.018 | 0.029 | 0.062 | 0.073 | 0.084 | 0.056 | 0.067 | 0.089 | 0.078 | 0.095 | 0.034 | 0.023 | 0.100 | 0.051 | 0.045 | 0.040 |
| Needleleaf | 0.03 | 0.024 | 0.029 | 0.045 | 0.055 | 0.066 | 0.041 | 0.050 | 0.071 | 0.061 | 0.077 | 0.031 | 0.026 | 0.082 | 0.039 | 0.036 | 0.034 |
| C3 grass | 0.06 | 0.028 | 0.045 | 0.094 | 0.111 | 0.127 | 0.086 | 0.102 | 0.135 | 0.119 | 0.144 | 0.053 | 0.036 | 0.152 | 0.078 | 0.069 | 0.061 |
| C4 grass | 0.03 | 0.018 | 0.041 | 0.108 | 0.131 | 0.154 | 0.097 | 0.120 | 0.165 | 0.142 | 0.176 | 0.052 | 0.029 | 0.188 | 0.086 | 0.075 | 0.063 |
| Shrub | 0.03 | 0.018 | 0.028 | 0.060 | 0.070 | 0.080 | 0.054 | 0.065 | 0.086 | 0.075 | 0.091 | 0.034 | 0.023 | 0.096 | 0.049 | 0.044 | 0.039 |
| Stomatal resistance f0 | |||||||||||||||||
| Broadleaf | 0.875 | 0.930 | 0.920 | 0.770 | 0.95 | 0.940 | 0.723 | 0.747 | 0.863 | 0.700 | 0.900 | 0.910 | 0.840 | 0.817 | 0.880 | 0.890 | 0.793 |
| Needleleaf | 0.875 | 0.930 | 0.920 | 0.770 | 0.95 | 0.940 | 0.723 | 0.747 | 0.863 | 0.700 | 0.900 | 0.910 | 0.840 | 0.817 | 0.880 | 0.890 | 0.793 |
| C3 grass | 0.9 | 0.930 | 0.920 | 0.770 | 0.95 | 0.940 | 0.723 | 0.747 | 0.863 | 0.700 | 0.900 | 0.910 | 0.840 | 0.817 | 0.880 | 0.890 | 0.793 |
| C4 grass | 0.8 | 0.780 | 0.770 | 0.680 | 0.80 | 0.790 | 0.660 | 0.670 | 0.720 | 0.650 | 0.750 | 0.760 | 0.710 | 0.700 | 0.730 | 0.740 | 0.690 |
| Shrub | 0.9 | 0.930 | 0.920 | 0.770 | 0.95 | 0.940 | 0.723 | 0.747 | 0.863 | 0.700 | 0.900 | 0.910 | 0.840 | 0.817 | 0.880 | 0.890 | 0.793 |
| Minimum LAI | |||||||||||||||||
| Broadleaf | 3.0 | 1.8 | 1.2 | 1.6 | 1.0 | 3.4 | 3.2 | 2.6 | 3.8 | 1.4 | 2.4 | 3.6 | 4.0 | 2.0 | 2.8 | 2.2 | 3.0 |
| Needleleaf | 3.0 | 1.8 | 1.2 | 1.6 | 1.0 | 3.4 | 3.2 | 2.6 | 3.8 | 1.4 | 2.4 | 3.6 | 4.0 | 2.0 | 2.8 | 2.2 | 3.0 |
| Soil respiration (Q10) | |||||||||||||||||
| 2.0 | 2.50 | 3.30 | 1.57 | 1.83 | 1.63 | 1.77 | 2.10 | 2.70 | 3.10 | 1.50 | 2.90 | 3.50 | 1.97 | 2.30 | 1.70 | 1.90 | |
| Volumetric soil moisture (Θcrit) | |||||||||||||||||
| * | 0.141 | 0.925 | 0.337 | 0.206 | 0.402 | 0.467 | 0.533 | 0.271 | 0.859 | 0.794 | 0.663 | 0.010 | 0.729 | 0.598 | 0.075 | 0.990 | |
| Topt (K) | |||||||||||||||||
| Broadleaf | 32 | 31.00 | 33.67 | 36.33 | 35.67 | 27.67 | 31.67 | 27.0 | 29.00 | 29.67 | 33.00 | 32.33 | 37.0 | 34.33 | 28.33 | 30.33 | 35.00 |
| Needleleaf | 27 | 26.00 | 28.67 | 31.33 | 30.67 | 22.67 | 26.67 | 22.0 | 24.00 | 24.67 | 28.00 | 27.33 | 32.0 | 29.33 | 23.33 | 25.33 | 30.00 |
| C3 grass | 32 | 31.00 | 33.67 | 36.33 | 35.67 | 27.67 | 31.67 | 27.0 | 29.00 | 29.67 | 33.00 | 32.33 | 37.0 | 34.33 | 28.33 | 30.33 | 35.00 |
| C4 grass | 41 | 40.00 | 42.67 | 45.33 | 44.67 | 36.67 | 40.67 | 36.0 | 38.00 | 38.67 | 42.00 | 41.33 | 46.0 | 43.33 | 37.33 | 39.33 | 44.00 |
| Shrub | 32 | 31.00 | 33.67 | 36.33 | 35.67 | 27.67 | 31.67 | 27.0 | 29.00 | 29.67 | 33.00 | 32.33 | 37.0 | 34.33 | 28.33 | 30.33 | 35.00 |
Our predictions of CO2 concentrations simulated across the ensemble from 1850 to 2100 are shown in figure 1. While there are some differences in the simulations of historical global atmospheric CO2, the models show marked divergence as the 21st century progresses, as evidenced by a significant spread between models of 461 ppm (669–1130 ppm) by year 2100. Putting this range into context: the C4MIP ensemble produced a range of atmospheric CO2 in 2099 of only 282 ppm (727–1009 ppm for an alternative future emission scenario SRES A2 [23]; see vertical bar on figure 1). Figure 1 also compares our uncertainty using a full AOGCM, with the conventional uncertainty estimates from two simpler Earth system Models of Intermediate Complexity (EMIC) [1], namely ISAM and Bern-CC. The greater future spread within the AOGCM cannot solely be attributed to greater freedom across this ensemble to diverge from observed trends during the historical period. The two simulations with the two lowest CO2 concentrations in 2000, have the lowest and highest concentrations in the future respectively. This was despite the C4MIP ensemble and the EMIC estimates also including ocean carbon cycle and physical climate uncertainties, in addition to the land carbon cycle processes illustrated here. The spread of CO2 concentrations arising from land carbon cycle uncertainties (461 ppm) is greater than full spread of future SRES concentration scenarios [23] (418 ppm) when carbon cycle uncertainties are neglected (which range from 540 ppm (B1) to 958 ppm (A1FI) in 2100, see figure 1). Moreover, the upper end of CO2 concentrations in 2100 for our ensemble from a single mid-range emission scenario (A1B) is as much as 18% greater than the highest SRES concentration scenario (when carbon cycle uncertainty is neglected).
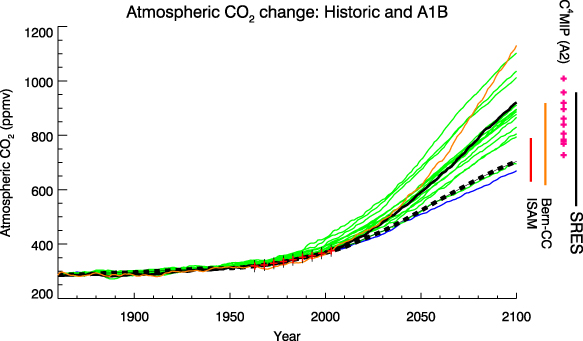
Figure 1. Modelled atmospheric CO2 concentrations for both the historical and future (to year 2100), the latter corresponding to the A1B SRES future emission scenario. The land carbon ensemble members are all continuous green curves except for the standard parameters (black) and the models with the greatest (orange) and least (blue) CO2 in 2100 highlighted. Two additional time series are shown; the reference historical/A1B CO2 time series (dashed, black) from Bern-CC which is used to drive most non-carbon cycle GCM simulations. CO2 observational estimates, subselected to be displayed every 5 yr, are shown from the Mauna Loa record (red crosses). In addition two vertical bars show two existing 2100 CO2 uncertainty ranges from the Bern-CC and ISAM modelling groups (orange and red respectively (3)) and the also the C4MIP models (for an alternative though similar scenario: A2) indicated by the purple crosses. The spread of CO2 concentrations in 2100 from the SRES 'emission' scenarios are indicated by the black vertical bar.
Download figure:
Standard imageThe findings presented in figure 1 demonstrate the need to factor in uncertainty between prescribed CO2 emissions and atmospheric concentrations when understanding the full global warming implications of different emissions socio-economic 'storylines'. Inverting, this work demonstrates that given this relationship is currently subject to quite considerable uncertainty, then any prescription of future CO2 concentration thresholds might be achievable across a range of diverse emissions scenarios. Thus, as well as choice of socio-economic storyline, land surface parameterizations are critical factors in determining the fidelity of our predictions of the future evolution of atmospheric CO2 concentrations. This has important implications for policy and decision relevant climate risk assessments as well as integrated assessment tools (such as [25] and [26]).
In figure 2 we compare each of the simulations against observed estimates of the amount of emitted carbon, between 1980 and 1999, taken up by the land and ocean. This enables us to incorporate information arising from uncertainties in the historical land use contribution to CO2 emissions [2] (which would not be accounted for by comparing atmospheric concentrations (figure 1) with historical measurements [27]). This figure shows the comparison between simulated (black) and our observed estimate (green) (including C4MIP in blue). Looking at the future projections (red), all models show a reduction in the land surface's ability to draw down CO2, with a corresponding increase in ocean and (more significantly from a global warming perspective) atmosphere fractions. It is the degree to which this happens which varies between simulations. A large proportion of the simulations suggest that the land surface will represent a net source of CO2, in addition to anthropogenic emissions, by the end of the century. There is no relationship, however, between the future airborne and land fractions and the simulated magnitude during the historical period, suggesting that the observed carbon budgets do not reduce the range of future projections. Indeed, we see this manifested in figure 1, where the two ensemble members with the lowest atmospheric CO2 in 2000 have the lowest and highest in 2100 (figure 1).
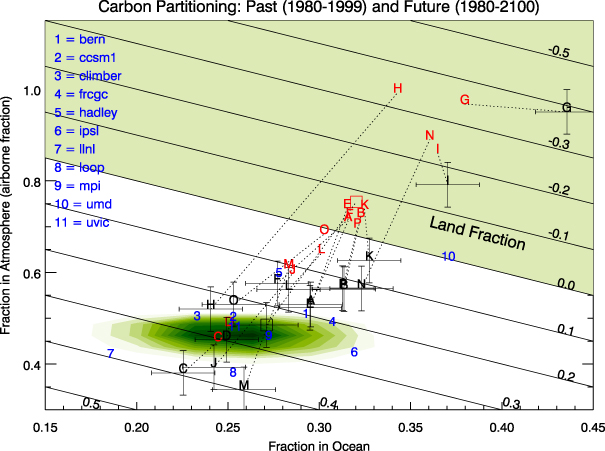
Figure 2. The fraction of integrated carbon emissions which reside in each of the three components of the carbon cycle: the atmosphere (y-axis, and also called the airborne fraction), the ocean (x-axis) and the land surface (diagonal lines). The shaded grey area in the upper and right side of the figure corresponds to a negative land carbon fraction. This region donates a net flux of carbon from the land surface (a possibility when climate change driven plant and soil carbon loss outweighs any gains in uptake through plant CO2 fertilization). The carbon fractions corresponding to emissions during period 1980–99 are shown for the perturbed land carbon ensemble (black letters which refer to table 1, and black square for standard parameters). The land carbon ensemble is marked with the corresponding uncertainties taken as two standard deviations of the natural variability in differences between 20 yr periods of the airborne and ocean fractions in the control climate. The shaded region represents the observational uncertainty on the carbon fractions during this period. Also plotted are the C4MIP ensemble (blue numbers) for present day (1980–99). The relative fractions of the total anthropogenic emissions from the full 1860–2100 period are shown for the perturbed land carbon ensemble (red letters and square) and the historical and future values for each member are connected by a dotted line.
Download figure:
Standard imageThere are other ways with which these simulations point back to our observations of the real world. In figure 3 we explore relationships between the parameter uncertainty, in land surface processes, and the magnitude of the modelled response. Specifically figure 3 illustrates the relationship between the year 1860-to-2100 atmospheric CO2 change and each of the six land carbon cycle parameters varied across our 17 ensemble members. This shows that the impact of uncertainty in the high temperature optima for photosynthesis dominates the in future land surface responses, with weaker correlations arising from the other parameters, consistent with the earlier findings of [19] within a similar model framework. It is the broadleaf trees that represent large tropical carbon stocks—where temperatures are most likely to exceed Topt values in a warming climate. For broad-leafed trees, reported optimum temperatures cover a broad range [28]. Optimal temperatures for electron transport capacity is likely to be the dominant, under high light conditions and future increases in CO2, of the three temperature dependent pathways which determine the temperature dependence of photosynthesis. For broadleaf trees, these values range between 19° and 39°, with over 90% within the 28°–38° range sampled by this study [28]. In general we expect ecosystems to be optimized to the long-term climate state, in which case Topt values which are close to the mean growing season temperature would be more likely. The implication of uncertainty in Topt are likely to extend beyond this study, across current carbon cycle GCMs, as current state of the art terrestrial biosphere models share similar formulation for temperature controls on photosynthesis [29].
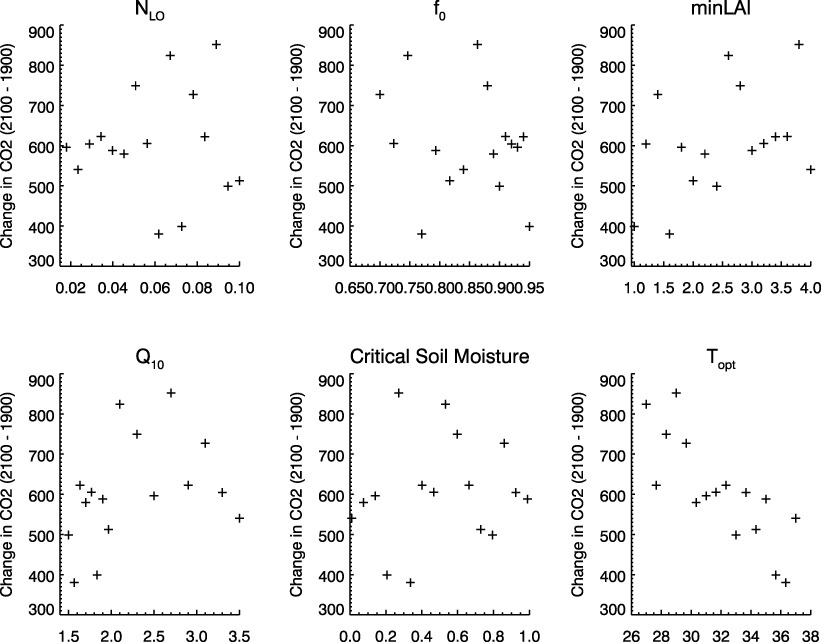
Figure 3. The relationships between each of the land surface parameter changes and the change in atmospheric CO2 between 2100 and 1900 (which is used as a metric of the magnitude of the carbon cycle feedback). In each panel, the x-axis represents the value of each of the six carbon cycle perturbed parameter, representing leaf nitrogen; parameter controlling stomatal opening; minimum leaf area index; temperature dependence of soil respiration; critical volumetric soil moisture concentration and the optimal temperature of photosynthesis respectively. Where parameter perturbations have specific values for each plant functional type, the values plotted are for the broadleaf PFT.
Download figure:
Standard imageThe dominance of uncertainty in optimal temperatures for photosynthesis is interesting (figure 3), as it highlights a potential epistemic uncertainty in current formulation in land surface models. The region where in a warming world ambient temperatures have the potential to persistently exceed optimal photosynthetic temperatures is in the tropics. However there remains considerable controversy and debate on the likely vulnerability of many tropical rain forest species to a future warming [30–32], although [30] suggest damage to photosynthetic machinery could occur in the near future at current rates of warming. To understand future responses of ecosystems to climate change, consideration of the extent to which plants can acclimate both photosynthesis and respiration to increasing temperatures is critical [31]. In the circumstances of strong ability to acclimate, then parameter Topt would become a function of warming extent and thus time. Nevertheless, there are very few studies of temperature acclimation responses for tropical trees [33, 34]. In the absence of sufficient data to constrain the high temperature plant responses, particularly in tropical ecosystems [30–34], the under-constrained response of terrestrial carbon cycling will remain a leading order uncertainty for future projections of atmospheric CO2 concentrations.
In figure 4, we present the impact of our parameter uncertainty on the effect that the associated predicted trajectories of atmospheric CO2 have on global warming (figure 4, green plume). This corresponds to a large temperature range of 3.3–5.7 °C (standard deviation 0.61 °C) by year 2099 with respect to the 1980–99 mean. As for the CO2 responses presented in figure 1, this variation is due to uncertainty in modelled land carbon cycle processes. To place this range in context, we can compare this variation directly with that from another ensemble using a version of the Hadley Centre GCM (figure 4, blue plume), but in that instance designed to explore uncertainties in the atmospheric feedback mechanisms such as cloud and convection processes [11, 35]. By the end of the century, such modelled perturbations to the atmospheric physics give rise to a comparable uncertainty range of 2.4–5.0 °C (standard deviation 0.69 °C) for the A1B scenario. The range of responses can also be compared atmospheric responses within the multimodel archive (WCRP CMIP3) which suggests a range of 2.0–4.4 (standard deviation 0.59 °C) at the same point. This comparison confirms the expected previously unrecognized importance of land carbon cycle uncertainties for predictions of future temperatures which are directly comparable in magnitude to those explored through ensembles sampling uncertainties in atmospheric physics.

Figure 4. Relative uncertainties in the perturbed carbon cycle (PCC, green plume) and perturbed atmospheric processes (PAP, blue) on global mean anomalies of temperature (all plotted with respect to the 1980–99 period). The green/blue hatching illustrates where these two ensembles overlap. The standard simulations from the two ensembles, HadCM3 (black solid) and HadCM3C (black dashed) are also shown. Four bars are shown on the right illustrating the 2100 temperature anomalies associated with the CMIP3/AR4 ensemble (black) the PAP ensemble (blue) the land carbon cycle (PCC) and the weighted land carbon ensemble wPCC (both green). The range (thin line), 10th–90th (medium line) and 25th–75th (thick line) and 50th percentiles (central bar) are all shown.
Download figure:
Standard imageFigure 4 also shows not only that explicit modelling of uncertainty in land carbon cycle processes produces both more spread but also that it tends to increase the average magnitude of the climate response. This is related to the spread of CO2 (figure 1) explored across the models, which extends the upper bound of the range of 2100 CO2 concentrations expected from emission driven C4MIP simulations for this scenario (supplementary information available at stacks.iop.org/ERL/7/024002/mmedia). Indeed, the reference atmospheric CO2 time series (based on the stand configuration of Bern-CC), which is used in most current state of the art AOGCMs (including the atmospheric physics ensemble, blue plume figure 4), lies in the lower end of the land carbon ensemble range (figure 1). This suggests that the inclusion of carbon cycle uncertainties into conventional climate model projections is likely to extend the upper temperature bound of the warming we did expect for a given future scenario.
The analysis presented here demonstrates that the plausible range of land carbon cycle feedbacks on climate change is possibly greater than previously estimated and with this directly translating to particularly large uncertainty in future levels of global warming. At present, land carbon feedbacks are not well constrained by observations highlighting the need to identify robust measurements which are capable of constraining the land carbon cycle's response to global warming and physiological response to raised CO2 concentrations. The exact nature of the temperature dependences of photosynthetic metabolism represents the most important uncertainty identified.
Acknowledgments
Ben B B Booth, Chris D Jones, Mat Collins, Ian J Totterdell, Richard Betts and Glen Harris were supported by the Joint DECC and Defra Integrated Climate Programme—DECC/Defra (GA01101). The authors are grateful to David Sexton for discussions about experimental design.
© Crown Copyright 2012, the Met Office, UK