
Abstract
The relationship between summer temperature, total cloud cover and precipitation over Eurasia was investigated using observation-based products of temperature and precipitation, and satellite-derived cloud cover and radiation products. We used a partial least squares regression approach to separate the local influences of cloud cover and precipitation on temperature variations. Our results suggest that the variance of summer temperature is partly explained by changes in summer cloudiness. The summer temperature dependence on cloud cover is strong at the high latitudes and in the middle latitude semi-humid area, while the dependence on precipitation is strong in the Central Asia arid area and the southern Asia humid area. During the period 1982–2009, the damped warming in extended West Siberia was accompanied with increases in cloud cover, and the pronounced warming in Europe and Mongolia was associated with a decrease in cloud cover and precipitation. Our results suggest that cloud cover may be the important local factor influencing the summer temperature variation in Eurasia while precipitation plays an important role at the middle latitudes.
Export citation and abstract BibTeX RIS
1. Introduction
The surface air temperature has increased worldwide in the last century, especially over the Northern Hemisphere land areas (IPCC 2007). The warming generally increases with increasing latitude in the Northern Hemisphere except in summer when the warming is damped (Manabe et al 2011). In the Eurasian continent, the summer warming shows large spatial variation with a maximum in Europe and eastern Asia and a damped increase over a large area of Eurasia for the last several decades (IPCC 2007, Hansen et al 2010). The summer temperature largely controls vegetation growth at high latitudes (Vygodskaya et al 2007, Raynolds et al 2008) and is relevant to the occurrence of heat waves at the middle latitudes of Eurasia (Schär et al 2004, Büntgen et al 2006). The geographic pattern of summer warming is thus intriguing because this pattern can potentially reflect the impacts of climatic change on ecosystems and human health.
Although the spatiotemporal variability in Northern Hemisphere summer temperature is related to teleconnections associated with hemispheric-scale circulation features such as the El Niño–Southern Oscillation and the Arctic Oscillation to different extents (Buermann et al 2003), the teleconnection patterns are generally weak in summer and the local teleconnection patterns appear to be disconnected (Frey and Smith 2003, Ogi et al 2003, Ding and Wang 2005). The atmospheric circulations alone cannot explain the immediate causes of the surface temperature anomalies. Understanding the changes in temperature and the immediate influencing factors, i.e. cloud cover and precipitation, are critical for determining the characteristics of surface temperature responses to the circulation anomalies. One may expect the local hydrological cycle to influence the summer temperature variation (Dai et al 1999, Seneviratne et al 2006, Liu et al 2009, Ye and Fetzer 2010). Clouds can cool the daytime surface temperature by sharply decreasing the surface solar radiation, while precipitation increases the surface wetness and reduces the surface temperature by increasing the daytime surface evaporative cooling. The local impacts of clouds on temperature are especially large in summer daytime when solar heating is large (Sun et al 2000). It was found that there was a negative correlation between surface air temperature and precipitation (Trenberth and Shea 2005) and between temperature and total cloud cover (Groisman et al 2000, Sun et al 2000) over land in the warm season. The relationship between summer mean daily maximum temperature and one variable of cloud cover or precipitation, however, varies with different geographical locations and climate regimes. The geographical distribution of the relationships is little understood because there is a strong correlation between precipitation and cloud cover, and a single variable is thought to have represented a large portion of the variance of the other (Dai et al 1997, Portmann et al 2009).
We performed a multiple correlation analysis on summer temperature, precipitation and satellite-derived cloud cover over Eurasia for the period 1982–2009. The geographic patterns of summer temperature variation associated with precipitation and cloud cover change were compared. Our objective was to identify the areas where summer temperature is mainly influenced by precipitation or cloud cover and to investigate whether the interactions are strong enough to influence the decadal temperature change trends observed in the last several decades.
2. Data and methods
2.1. Data sets
The monthly precipitation, mean daily maximum temperature, and mean and minimum temperature data were obtained from the CRU TS3.1 climate dataset (Mitchell and Jones 2005). This observational gridded data set is available with a spatial resolution of 0.5° × 0.5°. The CRU surface air temperature data may differ to some degree from other available surface air temperature data sets such as the Global Historical Climate Network (GHCN) data (Smith et al 2008) and the GISS Surface Temperature Analysis (GISTEMP) data (Hansen et al 2006), but the differences are quite small when we compare the year-to-year variation and decadal change trend. The Global Precipitation Climatology Centre (GPCC) precipitation data (Schneider et al 2010) were also used. The overall change pattern of GPCC precipitation is similar to that of CRU precipitation and the use of different precipitation data sets should make a minimal difference to our analysis results (Fekete et al 2004). The daytime cloud cover data were taken from PATMOS-x, a next-generation version (Pavolonis et al 2005) of the Advanced Very High Resolution Radiometer Pathfinder Atmosphere (PATMOS) data set with improved algorithms (Jacobowitz et al 2003). The PATMOS-x data were obtained from the Cooperative Institute for Meteorological Satellite Studies (CIMSS). We used the updated version of the PATMOS-x record (Version 5) which includes a new Bayesian cloud masking algorithm (Heidinger et al 2011) and has better agreement for cloud cover climatology with other cloud products (Heidinger et al 2011) than previous versions (Thomas et al 2004). However, some artifacts like orbital drift (Jacobowitz et al 2003, Ignatov et al 2004) still exist in these data. Because of the chance of missing part of the natural variability, we did not implement any correction procedure to the dataset. The PATMOS-x dataset provides afternoon total cloud cover with a spatial resolution of 1° × 1°. The PATMOS-x data cover the period 1982–2009 with missing cloud cover for the summer of 1995. The shortwave radiation data were obtained from the Surface Radiation Budget (SRB) Release 3.0 data set (Stackhouse et al 2004) in which cloud data from the International Satellite Cloud Climatology Project (Rossow and Schiffer 1999) were used. The SRB data are available for the period from July 1983 to December 2007. The SRB data perform the best out of six widely used radiation products compared to station observations in northern Eurasia (Troy and Wood 2009). The SRB data are generated on a nested grid with a resolution of 1° latitude globally and varying longitudinal resolution. Because the CRU data have the finest spatial resolution among the gridded datasets, the cloud and radiation values of the nearest CRU grid cell were used in the data analysis. We calculated the summer (June, July and August) means of temperature, cloud cover and radiation, and summer totals of precipitation.
2.2. Methods
According to the data availability, we restricted the study period to 1982–2009 and calculated the change trends of summer mean surface air temperature, precipitation and cloud cover for the periods 1982–2009, 1982–95 and 1996–2009. The statistical significance of the trends was calculated according to the two-tailed Student's t-test. We performed a multiple linear regression of summer mean surface air temperature time series onto cloud cover and precipitation in the period 1982–2009 (excluding 1995 when the cloud cover data are unavailable). In order to illustrate the separated contributions of cloud cover and precipitation to summer temperature variation, partial least squares regression coefficients were calculated (Geladi and Kowalski 1986). The residuals of regressing temperature against remaining variable (e.g. precipitation) but omitting target variable (e.g. cloud cover) were first computed. The temperature variance that can be explained by the remaining variable (i.e. precipitation) has thus been removed in the residual temperature time series. Then, the residuals of regressing the target variable against the remaining variable were computed. The residual time series of the target variable has excluded the effect of the remaining variable. Finally, the linear regression of the residual time series of temperature and the target variable were calculated. The linear regression has factored out the effect of the remaining variable. The sensitivity of temperature variation to the target variable was computed as the slope of the partial regression. We calculated the area-averaged temperature, precipitation and cloud cover for the regions and performed the same multiple linear regression for each region. The anomaly of the residual time series of temperature or the target variable was normalized by the standard deviation of the residual time series in the study period. The statistical significance of the regressions was calculated according to the two-tailed Student's t-test.
3. Results
Figure 1 shows the spatial distribution of summer mean daily maximum surface air temperature change daytime total cloud cover change and precipitation change during different periods in Eurasia. Part of the arid area (mostly in West and Central Asia) has been masked out because the CRU precipitation gives a constant value (no interannual variability) in these grid cells and the uncertainty of precipitation data in these areas is large (Fekete et al 2004). The masked areas are the grid cells with a precipitation amount less than an arbitrary value of 30 mm or a precipitation standard deviation less than an arbitrary value of 10 mm. The warming in the 1982–2009 period was strongest over Europe and an area around Mongolia, and weak cooling or damped warming was found over extended West Siberia. The trends in summer daily mean and minimum temperatures have similar spatial patterns to the trend in daytime maximum temperature (supplementary figure S1 available at stacks.iop.org/ERL/7/014004/mmedia). The correlation between daytime cloud cover and mean temperature or minimum temperature is generally smaller than that between cloud cover and maximum temperature (not shown; see also Dai et al 1999). This suggests that the summer temperature variations generally follow the mean daytime maximum temperature change in Eurasia. The summer warming pattern is consistent with the findings in the Fourth Assessment Report of the Intergovernmental Panel on Climate Change (IPCC 2007). The satellite-derived daytime cloud cover decreased where warming was pronounced, and increased where weak cooling or damped warming was experienced (figure 1(b)). An increase of daytime total cloud fraction in Russia was also reported by an assessment from ground observations (Chernokulsky et al 2011). Decreasing cloud cover in China was reported before 1996 (Qian et al 2006), which is consistent with the satellite-derived cloud cover change (figure 1(e)). It should be noted there are some artifacts in the satellite data that prohibit confident estimation of trends in global cloud cover (Jacobowitz et al 2003, Wielicki et al 2009). However, regional and seasonal trends over land areas can be detected with more confidence (Stackhouse et al 2004). Nonetheless, our results show that the spatial patterns of cloud cover change match well with those of temperature change in northern Eurasia during the different periods. In the period 1982–95, warming was strong in southern Europe and eastern Siberia where cloud cover decreased, and cooling was found in central Siberia and Kazakhstan where cloud cover increased (figures 1(d) and (e)). In the period 1996–2009, southern Europe and the Gulf of Ob experienced temperature increase and cloud cover decease, while European Russia and the Lena River basin experienced temperature decrease, and cloud cover increase (figures 1(g) and (h)). These further illustrate the coherent spatial distribution of increase in cloud cover and damped warming, although the limitations of regression analysis on short samples must be noted. The connection between temperature and cloud cover seems weak over China. Weak cooling was found in southern China in the period 1982–95 and in central China in the period 1996–2009 (figures 1(d) and (g)), while the cloud cover trend was small in the corresponding geographic location and period (figures 1(e) and (h)). Actually, the patterns of temperature change do not generally agree with those of cloud cover change in China. One possible explanation is that changes in cloud cover make a small contribution to the solar radiation trend over China (Qian et al 2007, Norris and Wild 2009, Xia 2010). Intriguingly, the spatial patterns of precipitation change (figures 1(f) and (i)) are generally consistent with those of summer temperature change in China during the different periods (see also supplementary figures S4(b) and S4(d) available at stacks.iop.org/ERL/7/014004/mmedia). This suggests that precipitation may play an important role in influencing temperature through evaporative cooling in China.
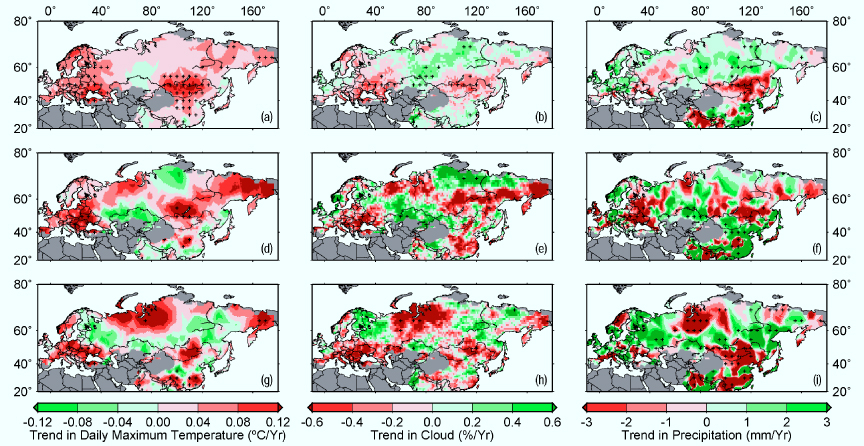
Figure 1. Spatial distribution of changes in summer mean daily maximum temperature, daytime cloud cover and precipitation over Eurasia. Panels (a)–(c) show the trends in temperature, cloud cover and precipitation during the period 1982–2009. Panels (d)–(f) show the trends in temperature, cloud cover and precipitation during the period 1982–95. Panels (g)–(i) show the trends in temperature, cloud cover and precipitation during the period 1996–2009. The cloud cover in the summer of 1995 is not used in panels (b) and (e) because PATMOS-x data are unavailable. The cross symbols indicate the areas where the reported trends are significant at the 90% confidence level or higher. We emphasize the limitations of regression analysis on short-term samples.
Download figure:
Standard imageFigures 2(a) and (b) show the sensitivities of temperature to cloud cover and precipitation change over Eurasia. The temperature sensitivity to cloud cover change is high (more than 0.9 °C cooling per 10% cloud cover increase) over most areas of northern Eurasia. The sensitivity to cloud cover change is generally insignificant and small at the middle latitudes except for the Tibetan plateau (supplementary figure S2(a) available at stacks.iop.org/ERL/7/014004/mmedia). In contrast, the temperature sensitivity to precipitation is high at the middle latitudes. High temperature sensitivity to precipitation (more than 0.3 °C cooling per 10 mm precipitation increase) is found in the Central Asia arid area. It should be noted that the sensitivity to precipitation change is small but significant over eastern and southern Asia (supplementary figure S2(b) available at stacks.iop.org/ERL/7/014004/mmedia). The precipitation amount and variability are much larger in eastern and southern Asia than those in arid Central Asia. Figure 2(c) shows the spatial distribution of the multiple correlation coefficients over Eurasia. The correlation is strong and significant over most areas of the middle and high latitudes. Overall, cloud cover and precipitation can explain more than 35% of summer temperature variance over about 50% of the continent (excluding the masked out area). Figure 2(d) shows the areas where the summer temperature is significantly correlated with cloud cover or precipitation, or both variables. Cloud cover is the important local factor influencing the summer temperature change in northern Eurasia. Precipitation plays an important role at the middle latitudes. Significant negative soil moisture feedbacks on summer surface air temperature over East Asia were also reported in the model studies (Zhang and Dong 2010). The model studies found that the soil moisture feedbacks were less significant in Northeast Asia but lacked sufficient justifying reasons. Our results imply that cloudiness rather than soil moisture feedback is the important contributing factor for summer temperature variation in Northeast Asia. Cloud cover is a better indicator of summer temperature variation over the Tibetan plateau, unlike other middle latitude areas. The correlation between daytime cloud cover and temperature over the Tibetan plateau was examined in a ground observation analysis (Duan and Wu 2006). That analysis showed that surface radiation increase coincided with reduced daytime cloud cover and further suggested that cloud cover change contributed to Tibetan plateau warming.

Figure 2. Sensitivities of summer mean daily maximum temperature change to cloud cover and precipitation, and multiple correlation of temperature with the two climatic variables (precipitation and cloud cover). (a) Temperature sensitivity to daytime cloud cover. (b) Temperature sensitivity to precipitation. (c) Multiple correlation coefficient. (d) The areas where temperature is partially correlated with the climatic variables at 90% confidence level. The cross symbols in panels (a)–(c) indicate the areas where the reported correlations are significant at the 90% confidence level or higher.
Download figure:
Standard imageFigure 3 shows the variations of anomalies of daytime maximum temperature with daytime cloud cover and precipitation over five regions of Eurasia. The effects of precipitation and cloud cover have been factored out in figures 3(a) and (b) respectively (see section 2.2). Northern Asia refers to Russian Siberia, the Central Asia Arid Area is the area with summer precipitation less than 100 mm in central Asia, the Semi-Humid Area is the area with summer precipitation of over 100 mm but less than 200 mm in China, and the South Humid Area refers to the areas with summer precipitation of more than 200 mm in the south (supplementary figure S3 available at stacks.iop.org/ERL/7/014004/mmedia). The areas with similar amounts of precipitation are assembled into one region at the middle latitudes because the arid area will be unrepresented in the regional averages over the entire region with large spatial variation in precipitation. Northern Asia is generally in a continental climate zone and Europe is mainly in a moderate climate zone. The continental divide is used to separate the regions of Europe and Northern Asia at high latitudes. The negative correlation between temperature and cloud cover is statistically significant in Northern Eurasia and the semi-humid area of China. This may indicate that cloud cover is an important local factor influencing the summer temperature variation at high latitudes. Statistically significant negative correlation between temperature and precipitation is found in the Central Asia Arid Area and the South Humid Area. The surface wetness exerts more influence on summer temperature variation than the cloud cover in the south and in the arid area. The dependence of temperature on precipitation is also strong in Northern Asia. However, the correlation is positive and therefore surface wetness increase would not be conducive to an increase of temperature through the effects on the surface energy budget. The positive correlation may be partly related to large-scale Arctic atmospheric variability (Frey and Smith 2003) and changes in cloud type frequency in Siberia (Sun and Groisman 2000, Sun et al 2001). From a surface energy balance perspective, a decrease in total cloud cover may contribute to the summer warming through the effects of increase in surface shortwave radiation (Wild et al 2004). It is found that the spatial patterns of the satellite-derived change in surface shortwave radiation are generally coherent with those of the summer temperature change and cloud cover change in northern Eurasia during the different periods (supplementary figure S4 available at stacks.iop.org/ERL/7/014004/mmedia). In the period 1982–95, southern Europe and eastern Siberia experienced an increase in surface shortwave radiation, a decrease in cloud cover, and surface warming. In the period 1996–2009, European Russia and the Lena River basin experienced a decrease in surface shortwave radiation, an increase in cloud cover, and a decrease in temperature. Although the satellite-derived trend slope of radiation may have large uncertainties in Asia (Wielicki et al 2009, Tang et al 2011), the trends of the satellite retrievals are spatially consistent with the trends in temperature. This spatial coherence suggests that the summer temperature variation in Northern Eurasia could be partly explained by changes in cloud cover.
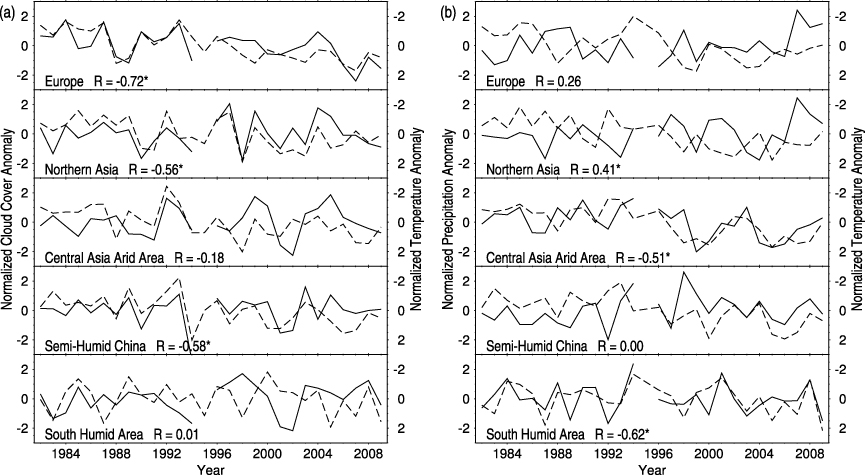
Figure 3. Variations of anomalies of summer mean daily maximum surface air temperature (dashed lines) with summer (a) daytime cloud cover and (b) precipitation (solid lines) in the five regions of Eurasia during the period 1982–2009. Note that the scale for temperature anomalies on the right side decreases upwards. The correlation coefficient R between the curves is given. An asterisk indicates that the correlation is significant at the 90% confidence level or higher.
Download figure:
Standard image4. Conclusion and discussion
This research represents an analysis of the relationship between summer temperature, cloud cover and precipitation over Eurasia, using the observational data in 1982–2009. We revealed the spatial distribution of the important local factor that influences summer temperature variation in the continent. Our results suggest that the dependence of summer temperature on cloud cover is strong at the high latitudes and in the middle latitude semi-humid areas of Eurasia, while the dependence on precipitation is strong in the central Asia arid area and southern Asia humid area. During the period of 1982–2009, the damped warming in extended Siberia was accompanied with increases in cloud cover, and the pronounced warming in Europe and Mongolia was associated with a decrease in cloud cover and precipitation. A significant negative relationship between summer temperature and cloud cover was found in most areas of Eurasia, and a significant negative relationship between summer temperature and precipitation was found at the middle latitudes but not at the high latitudes. Our results suggest that cloud cover may be the important local factor influencing the summer temperature variation in Eurasia, while precipitation plays an important role in the interaction at the middle latitudes. We emphasize that our analysis shows the correlation rather than the causality. It is unclear how cloud cover changes in relation to atmospheric circulation change. We used the total cloud cover which cannot account for the different radiative characteristics of different types of clouds. More studies are needed to investigate the change in cloud types (Dai et al 1997). Nonetheless, the spatial distribution of the important local factor influencing summer temperature can be used to evaluate climate modeling and to further improve the ability of climate modeling in reproducing recent summer warming over Eurasia.
While our analyses complement earlier studies that used cloud observations from weather stations to estimate the statistical relationships between temperature and cloudiness and precipitation (Dai et al 1999, Groisman et al 2000, Sun et al 2000), our results from the analyses of satellite-derived cloud cover data provide new evidence of strong damping effects of daytime cloud cover on summer temperature. Our results also suggest that the interaction between daytime cloud cover and surface air temperature may be strong enough to influence decadal temperature change trends in summer at the high latitudes of Eurasia.
Acknowledgments
Funding for this research is provided by the National Natural Science Foundation of China (No. 41171031), the National Basic Research Program of China (Nos 2012CB955403 and 2010CB950100), the Strategic Priority Research Program (No. XDA05080101) and Hundred Talents Program of the Chinese Academy of Sciences. We thank Pavel Ya Groisman for helpful discussions. We thank two anonymous reviewers for thoughtful comments and recommendations. The authors acknowledge NASA Langley Research Center for providing access to the NASA/GEWEX Surface Radiation Budget (SRB) data sets, the Cooperative Institute for Meteorological Satellite Studies (CIMSS) of the University of Wisconsin, Madison for providing access to the PATMOS-x data, the British Atmospheric Data Center for access to the CRU data, and the Global Precipitation Climatology Centre (GPCC) for access to the GPCC data.