

Abstract
Sharp rises in the atmospheric abundance of ethane (C2H6) have been detected from 2009 onwards in the Northern Hemisphere as a result of the unprecedented growth in the exploitation of shale gas and tight oil reservoirs in North America. Using time series of C2H6 total columns derived from ground-based Fourier transform infrared (FTIR) observations made at five selected Network for the Detection of Atmospheric Composition Change sites, we characterize the recent C2H6 evolution and determine growth rates of ∼5% yr−1 at mid-latitudes and of ∼3% yr−1 at remote sites. Results from CAM-chem simulations with the Hemispheric Transport of Air Pollutants, Phase II bottom-up inventory for anthropogenic emissions are found to greatly underestimate the current C2H6 abundances. Doubling global emissions is required to reconcile the simulations and the observations prior to 2009. We further estimate that North American anthropogenic C2H6 emissions have increased from 1.6 Tg yr−1 in 2008 to 2.8 Tg yr−1 in 2014, i.e. by 75% over these six years. We also completed a second simulation with new top-down emissions of C2H6 from North American oil and gas activities, biofuel consumption and biomass burning, inferred from space-borne observations of methane (CH4) from Greenhouse Gases Observing SATellite. In this simulation, GEOS-Chem is able to reproduce FTIR measurements at the mid-latitudinal sites, underscoring the impact of the North American oil and gas development on the current C2H6 abundance. Finally we estimate that the North American oil and gas emissions of CH4, a major greenhouse gas, grew from 20 to 35 Tg yr−1 over the period 2008–2014, in association with the recent C2H6 rise.
Export citation and abstract BibTeX RIS

Original content from this work may be used under the terms of the Creative Commons Attribution 3.0 licence. Any further distribution of this work must maintain attribution to the author(s) and the title of the work, journal citation and DOI.
1. Introduction
Ethane (C2H6) is a ubiquitous constituent of the Earth's atmosphere, with surface concentrations typically ranging from 500 to 2200 ppt over the Northern Hemisphere (Simpson et al 2012). As a result of its relatively short lifetime against oxidation by the main tropospheric oxidant, the hydroxyl radical (OH; Rudolph 1995), C2H6 presents a significant seasonal modulation, characterized by a winter maximum and a summer minimum. The main C2H6 sources are of anthropogenic origin (62% from leakage during production and transport of natural gas (NG), 20% from biofuel combustion and 18% from biomass burning; e.g., Xiao et al 2008), and this produces a strong latitudinal and interhemispheric gradient (Simpson et al 2012).
Ethane plays a number of roles in atmospheric chemistry. As the most abundant non-methane volatile organic compound, its oxidation in the presence of nitrogen oxides (NOx) can enhance tropospheric ozone (O3) production, especially in polluted air masses, and it is a significant source of peroxyacetyl nitrate, the main tropospheric reservoir species for NOx (Fischer et al 2014). Ethane directly impacts the oxidizing capacity of the troposphere by serving as an important sink for OH. It also shares important and concurrent anthropogenic emission sources with methane (CH4), a major greenhouse gas released to the atmosphere by numerous natural processes and human-related activities. A complete understanding of the atmospheric distribution of C2H6 and any trends in the abundance of this species can be used to better constrain the sources of CH4, in particular from oil and gas activities.
Until very recently, the abundance of C2H6 in the atmosphere has been declining, and this has been mainly attributed to the reduction of fugitive emissions from its fossil fuel sources (Simpson et al 2012) as a result of successful implementation of measures aimed at the reduction of atmospheric pollution. Simpson et al (2012) showed that global emissions dropped from 14.3 to 11.3 Tg yr−1 over the period 1984–2010. Several studies have characterized the atmospheric decrease of C2H6 over the last two decades, and found consistent relative trends in the −1 to −2.7% yr−1 range, depending on the site and time period (Franco et al 2015, and references therein).
There are multiple lines of evidence that the multi-decade decline in C2H6 has ended. Using surface measurements of the Photochemical Assessment Monitoring Stations network , Vinciguerra et al (2015) showed that C2H6 mixing ratios increased after 2010 at locations downwind of active wells in North America. Almost simultaneously, Franco et al (2015) reported a 5% yr−1 increase in the total C2H6 column series after 2009 over the remote high-altitude site of the Jungfraujoch in the Swiss Alps, suggesting that emissions associated with hydraulic fracturing and shale gas operations in North America are affecting Europe.
NG production over the US increased by 40% from 1989 to 2013 (Energy Information Administration, http://eia.gov/dnav/ng/hist/n9010us2a.htm). The rate of change of NG production increased in 2006, resulting in an annual production of 835 000 million cubic meters by the year 2013 (figure 1(a)). Gas producing wells are located in many regions of the US, the largest number being located in the northeast and the south central portion of the US (figure 1(b); Energy Information Administration, https://eia.gov/dnav/ng/ng_sum_lsum_a_EPG0_xdg_count_a.htm).
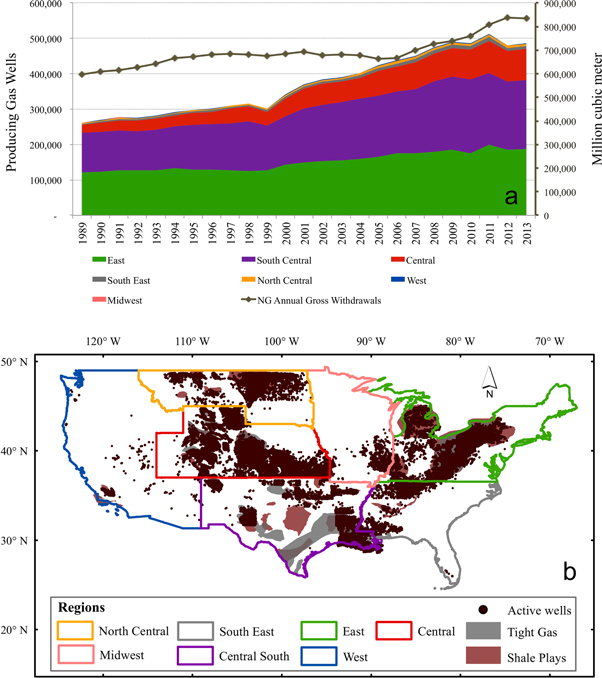
Figure 1. (a) Natural gas (NG) production (black symbols; right scale) and number of producing gas wells (left scale, see color key for the identification of the regions) from 1989 to 2013 (Data from Energy Information Administration, accessed 7 February 2016, released date: 29 January 2016, http://eia.gov/dnav/ng/hist/n9010us2a.htm). (b) Regional distribution of active wells and tight and shale gas plays (Gas plays data from Energy Information Administration, accessed December 2014, https://eia.gov/dnav/ng/ng_sum_lsum_a_EPG0_xdg_count_a.htm). The color shading of (a) corresponds to the regions shown in (b). Note that no information about well locations for Maryland, North Carolina and Texas is available.
Download figure:
Standard image High-resolution imageHere we use remote-sensing observations from five ground-based Fourier transform infrared (FTIR) instruments over the 2003–2014 time period to characterize the recent C2H6 abundance increases over North America that we attribute to the intense development of oil and gas extraction in this region. We show that a significant adjustment of the anthropogenic C2H6 emissions (dominated by the oil and gas sector) available from the most current bottom-up emission inventory is needed to allow a correct reproduction of the C2H6 atmospheric levels and recent rise by the CAM-chem model (the Community Atmosphere Model with Chemistry). These findings are confirmed by an independent simulation performed with the chemical transport model GEOS-Chem, implementing spatially resolved top-down emissions of C2H6 (Turner et al 2015).
2. Methods
2.1. FTIR and portable atmospheric research interferometric spectrometer for the infrared (PARIS-IR)
High-resolution infrared solar absorption spectra encompassing C2H6 absorption features near 3.5 μm are regularly recorded under clear-sky conditions at globally distributed ground-based sites within the Network for the Detection of Atmospheric Composition Change (NDACC; see http://ndacc.org and www2.acom.ucar.edu/irwg). The present study focuses on observations obtained as part of this monitoring effort in North America, namely at Eureka, Thule and Toronto, and at Mauna Loa. Spectra recorded at Boulder, in operation since 2009 and not affiliated yet to NDACC, have also been included to increase the latitudinal coverage. Table 1 provides information on these sites. To check the ability of lower-resolution, compact and portable instruments to provide meaningful column measurements of C2H6, we further considered observations performed by the portable atmospheric research interferometric spectrometer for the infrared (PARIS-IR; Fu et al 2007), an instrument based on the design of the atmospheric chemistry experiment-Fourier transform spectrometer (ACE-FTS) in orbit on-board the SCISAT satellite since August 2003 (Bernath et al 2005). PARIS-IR has been operated from Eureka each spring since 2006 and from Toronto in 2009 and 2011, side-by-side with the corresponding affiliated NDACC-FTIR spectrometers.
Table 1. Information on the FTIR sites with C2H6 measurements presented in this study.
| FTIR site | Location | Reference |
|---|---|---|
| Eureka | Canada, NU, 80.05° N, 86.42° W, 610 m a.s.l. | Batchelor et al (2009) |
| Thule | Greenland, 76.52° N, 68.77° W, 225 m a.s.l. | Hannigan et al (2009) |
| Jungfraujoch | Swiss Alps, 46.55° N, 7.98° E, 3580 m a.s.l. | Zander et al (2008) |
| Toronto | Canada, ON, 43.66° N, 79.40° W, 174 m a.s.l. | Wiacek et al (2007) |
| Boulder | United States, CO, 40.40° N, 102.50° W, 1612m a.s.l. | |
| Mauna Loa | United States, HI, 19.54° N, 155.57° W, 3396 m a.s.l. | Hannigan et al (2009) |
The C2H6 retrieval strategies used here are consistent with those described in Franco et al (2015). In brief, two spectral windows encompassing the pQ3 and pQ1 sub-branches near 2976 and 2983 cm−1 were simultaneously fitted, accounting for interferences by water vapor (H2O), O3, methyl chloride (CH3Cl) and CH4. The third optional window near 2986 cm−1, sometimes affected by water vapor, was used at all sites. The adopted spectroscopic parameters correspond to a combination of HITRAN 2008 for most species (Rothman et al 2009), with HITRAN 2012 for CH3Cl (Rothman et al 2013), improved parameters for the O3 lines near 2976.97 cm−1 and a pseudo-linelist for C2H6 derived from laboratory cross section spectra recorded by Harrison et al (2010). Model simulations with the CHemical Atmospheric General Circulation Model for study of atmospheric environment and radiative forcing (CHASER; Sudo et al 2002) were used to build the a priori covariance matrix and to determine on a site-by-site basis, a scale factor applied to the v6 climatological a priori vertical profiles employed in the NDACC Infrared Working Group that were derived from the Whole Atmosphere Community Climate Model (WACCM; Garcia et al 2007, Eyring et al 2013). The objective characterization of the information content indicated that mean degrees of freedom for signal (DOFS) are in the range of 1.5–1.7 at all sites, providing sensitivity in an altitude range from the ground up to ∼18 km. The retrieval algorithm and approach adopted for the PARIS-IR low-resolution (0.02 cm−1) observations are consistent with those used for the high-resolution spectra and provide a mean DOFS of approximately 1.0 between the ground and ∼18 km.
Uncertainties associated with the retrieval of C2H6 have been evaluated in numerous previous studies (see Franco et al 2015 and references therein), for many different sites with a broad range of atmospheric conditions. All concur in estimating a total systematic error on the total columns close to 6%, dominated by the uncertainty affecting the C2H6 line parameters. Reported random errors are in the 2%–4% range for studies making simultaneous use of several windows, with main contribution by the measurement noise.
2.2. CAM-chem
For this study, a simplified version of CAM-chem (Lamarque et al 2012), a component of the Community Earth System Model, was used to simulate multi-year distributions of C2H6 along with tracers of source region contributions. CAM version 4 (CAM4) with bulk aerosols was used at a 1.9° latitude × 2.5° longitude resolution, with the global OH distribution specified using output from a previous full chemistry simulation for year 2000 (Tilmes et al 2015). The meteorology is specified using Modern-Era Retrospective Analysis for Research and Applications meteorological fields corresponding to each year of simulation. The reaction of C2H6 with OH was the only chemical loss included. Since this version of the model does not include complete chemistry, it will be called CAM-C2H6 throughout this paper.
The initial anthropogenic C2H6 emissions inventory used with CAM-C2H6 was developed for the Hemispheric Transport of Air Pollutants, Phase II (HTAP2), and is a composite of regional inventories harmonized to represent 2008 and 2010 (Janssens-Maenhout et al 2015). Additional C2H6 emissions included in these simulations are biogenic emissions from the online Model of Emissions of Gases and Aerosols from Nature (MEGAN2.1) biogenic emissions model (Guenther et al 2012), and fire emissions from the Fire INventory from NCAR (FINNv1.5; Wiedinmyer et al 2011).
Daily mean C2H6 mixing ratio profiles at the closest pixel to each measurement site were used from the CAM-C2H6 output. To ensure a reliable comparison with the ground-based measurements, we imposed the vertical resolution and sensitivity of the FTIR retrievals to the model outputs before computing the total columns: the individual mixing ratio profiles were re-gridded onto the vertical FTIR layer schemes and convolved by the averaging kernels (AVKs) according to the formalism of Rodgers and Connor (2003). The re-gridding method is a mass-conservative interpolation, preserving the total C2H6 mass above the station altitude and ignoring the mass underneath. Seasonally-averaged AVKs were employed for the smoothing.
2.3. GEOS-Chem
GEOS-Chem is a chemical transport model driven by assimilated meteorological fields from the Goddard Earth Observing System of the National Aeronautics and Space Administration (NASA) Global Modelling and Assimilation Office (Bey et al 2001). Our analysis was based on a 2° × 2.5° resolution simulation for 2010, with an 18 month spin-up. We used v10-01 with GEOS-5 meteorological fields and the full chemistry (NOx–Ox–HC–Aer–Br) mechanism. Ethane emission fluxes over the US and Canada were based on CH4 fluxes derived from the Greenhouse Gases Observing SATellite (GOSAT) at a 50 km × 50 km spatial resolution (Turner et al 2015). The CH4 inversions were calculated using a state vector optimally defined with radial basis functions to enable analytical inversion with full error characterization while minimizing aggregation error. A full description of the uncertainty and error characterization of this method for calculating CH4 emissions is presented in Turner and Jacob (2015).
In order to attribute nationwide percentages of anthropogenic CH4 emissions, Turner et al (2015) used prior information on source locations. As a result, they estimated CH4 fluxes for 12 anthropogenic categories. In this study, we only considered the categories and thus locations relevant to C2H6, and these include: (1) oil and NG, (2) biofuel, and (3) biomass burning. For these categories, we estimated C2H6 emissions using C2H6/CH4 emission ratios from the literature and implemented them into the model using the Harvard-NASA Emissions Component v1.1.005 (Keller et al 2014). To estimate oil and gas C2H6 emission fluxes, we used a single C2H6/CH4 emission ratio based on Katzenstein et al (2003). To derive biomass burning and biofuel C2H6 emissions, we considered biofuel consumption as residential biomass burning; and we used the C2H6/CH4 emission ratios for temperate forests from Akagi et al (2011). The use of relatively few emission ratios is a large source of uncertainty in this analysis on top of errors associated with the GOSAT based CH4 fluxes. However, there are relatively few emission ratios available in the published literature, and our approach offers a simple and reproducible implementation in the model. Consistent with the CAM-C2H6 outputs, we used the GEOS-Chem mixing ratio profiles accounting for the FTIR vertical resolution and sensitivity.
3. Results
3.1. Observed ethane increase
We investigated C2H6 time series derived from the ground-based observations to determine the current abundances of C2H6 as well as its recent evolution over the North American FTIR sites. The FTIR daily mean total columns from January 2003 through December 2014 are shown as gray circles in figure 2, while the light blue triangles correspond to the daily-averaged PARIS-IR measurements at Eureka and Toronto. On each frame, the right y-axis scale converts the total columns into approximate surface mole fractions. The scale conversion was determined for each site according to the linear regression between the total column abundance and the C2H6 mole fraction in the lowermost layer of the FTIR retrieval scheme. These regressions are characterized by a coefficient of determination (R2) of at least 0.8.
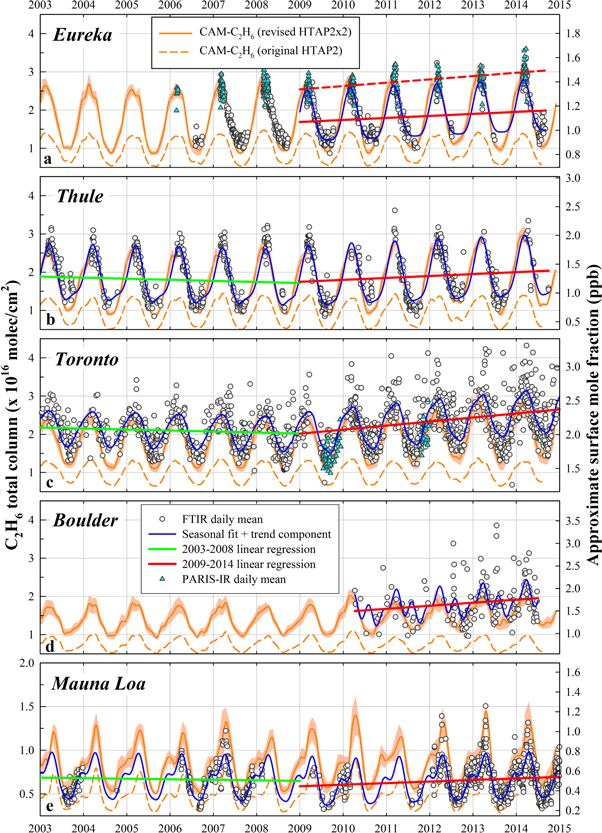
Figure 2. Daily mean C2H6 total columns derived from the FTIR (gray circles) and PARIS-IR (light blue triangles) observations performed between January 2003 and December 2014. The right y-axis scale converts the total columns into approximate surface mole fraction (see text for details). The blue curve visualizes the function (including seasonal modulation and trend component) fitted to all daily FTIR means over the periods 2003–2008 and 2009–2014, using a bootstrap tool (Gardiner et al 2008). The green and red lines are the associated linear regressions (as solid line for FTIR and dashed line for PARIS-IR). The dashed and solid orange curves are the monthly mean C2H6 total columns simulated by CAM-C2H6, implementing the original HTAP2 and revised HTAP2x2 (with increasing North American emissions) inventories, respectively. The shaded area corresponds to the 1σ standard deviation.
Download figure:
Standard image High-resolution imageDifferences in C2H6 abundance present in figure 2 are largely a function of site latitude (Simpson et al 2012) and altitude (Gardiner et al 2008, Angelbratt et al 2011); the bulk of the C2H6 molecules are found in the lowermost tropospheric layers. The mean column for each site (±1σ) is as follows: 1.7 ± 0.5 (Eureka; 610 m a.s.l.), 1.8 ± 0.6 (Thule; 225 m a.s.l.), 2.1 ± 0.4 (Toronto; 174 m a.s.l.), 1.6 ± 0.5 (Boulder; 1612 m a.s.l.) and 0.6 ± 0.2 molec cm−2 (Mauna Loa; 3396 m a.s.l.). There are also seasonal and interannual differences in the C2H6 burden between the sites. Mainly driven by the rate of reaction with OH, the typical seasonal peak-to-peak amplitude for C2H6 is on the order of 50% at Boulder and Toronto, and it increases to ∼80% at the remote sites. It is worth noting the good agreement between the PARIS-IR and FTIR total columns above both Eureka and Toronto (figures 2(a) and (c)).
We characterize the recent atmospheric evolution of C2H6, considering the daily means, with a statistical bootstrap resampling tool that combines a linear function and a Fourier series accounting for the intra-annual variability of the data sets (Gardiner et al 2008). A third-order Fourier series is used to adjust the seasonal variations, except at the Arctic sites, Eureka and Thule, where a second-order fit is appropriate to capture the seasonality over the spring to fall time period (no observations during the polar night). As in Franco et al (2015), we consider separately the daily mean subsets before 1 January 2009 (when enough observations are available), and after 1 January 2009. The fitted seasonality is drawn as a blue curve in each frame of figure 2, while the green and red solid lines designate the corresponding linear regressions. At Eureka (figure 2(a)), a linear regression (red dashed line) is calculated solely on the basis of the 2009–2014 PARIS-IR campaign measurements. Figure 3 shows the relative annual C2H6 rates of change, using either the January 2003 or January 2009 computed total columns as reference. The available annual rates of C2H6 over both the 2003–2008 and 2009–2014 time periods, along with the 2σ confidence level, for the five FTIR sites are plotted in blue. The equivalent annual rates derived from the Jungfraujoch (table 1) time series investigated in Franco et al (2015) are added for comparison.
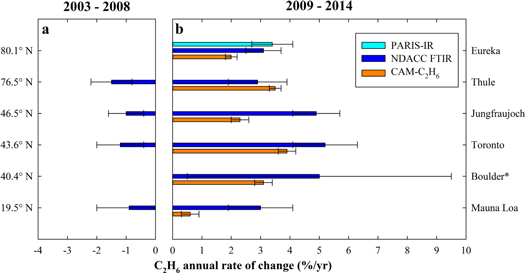
Figure 3. The annual rates of change of C2H6 total column over the 2003–2008 (a) and 2009–2014 (b) time periods, derived from the PARIS-IR (light blue) and NDACC-FTIR (dark blue) observational data sets, and from the CAM-C2H6 simulation implementing the revised HTAP2x2 inventory (orange). The error bars correspond to the 2σ level of uncertainty. (*) over the 2010–2014 time period, not yet NDACC affiliated.
Download figure:
Standard image High-resolution imageFrom 2003 to 2008, we observe a slow decline of the C2H6 total columns between −1.0 and −1.5% yr−1, with consistent rates within the different latitudes (figure 3(a)). The Mauna Loa rate of change is not significant at the 2σ confidence level (0.9 ± 1.1% yr−1). However, when using the dataset from inception, we compute a decrease of −1.0 ± 0.3% yr−1 over 1995–2008. These results agree with the global decline of the atmospheric C2H6 burden from the mid-1980s up to the end of the 2000s, which was widely reported in the scientific literature (e.g., Gardiner et al 2008, Angelbratt et al 2011, Franco et al 2015, and references therein). It was attributed to reduced fugitive fossil fuel emissions that were thought to also contribute significantly to the slowing growth rate of atmospheric CH4 since the mid-1980s (Aydin et al 2011, Simpson et al 2012).
However, as at Jungfraujoch (Franco et al 2015), the FTIR measurements over the North American sites show a reversal of the long term decline in C2H6 around 2009, followed by a sharp and significant (at the 2σ confidence level) increase at all FTIR sites (figure 3(b)). The observed rates of change are very consistent and vary between ∼3% yr−1 at the remote stations and ∼5% yr−1 at mid-latitudes. The increase in C2H6 deduced from the PARIS-IR and FTIR observations at Eureka are very consistent as well. We hypothesize that this recent increase is the result of the recent massive growth in the exploitation of shale gas and tight oil reservoirs in North America, where the drilling productivity began to grow rapidly after 2009 (Schneising et al 2014, Warneke et al 2014, Vinciguerra et al 2015). Of the observation sites presented here, Boulder is located closest to a highly productive oil and gas basin, the Denver-Julesberg Basin. We suggest that is why the Boulder data show a large variability in the C2H6 columns (5.0 ± 4.5% yr−1), influenced by local air mass circulation. Similar elevated mixing ratios of C2H6 have been observed at the Boulder Atmospheric Observatory by Gilman et al (2013).
3.2. Results from HTAP2 emissions inventory
We compared C2H6 simulations produced with CAM-C2H6 for the period 2003–2014, using the bottom-up anthropogenic inventory HTAP2, with the remote-sensing measurements. The C2H6 total columns derived from this simulation, represented by the dashed curve in figure 2, greatly underestimate the FTIR observations at all sites in terms of C2H6 abundance and seasonal amplitude, with a low bias that is far larger than the typical systematic uncertainty of 6% affecting the total columns. Furthermore, the model does not reproduce the recent C2H6 increase.
Based on comparisons between the model results and the FTIR measurements, we estimate that the global HTAP2 anthropogenic C2H6 emissions must be doubled to simulate the observed C2H6 abundance prior to 2009. We refer to this quantity of C2H6 emissions as HTAP2x2. An additional increase in C2H6 emissions beyond HTAP2x2 is required to simulate the recent rise from 2009 to 2014. Given that C2H6 emissions related to the oil and gas sector represent up to 80% of the total anthropogenic C2H6 emissions over North America, and if we assume that the missing emissions during this period resulted from the recent increase in oil and gas extraction in North America, we can use the model to estimate the increase in C2H6 emissions needed to match the observations. To match the 2014 observations at the continental sites, the North American annual contribution has to almost double over the period 2009–2014. This corresponds to a 1.2 Tg increase of the North American annual C2H6 emissions in 2014 over the 2008 emission rates. An overview of the total C2H6 emission rates used for the CAM-C2H6 simulations is provided in table 2.
Table 2. Total annual emissions of C2H6 (in Tg yr−1) used for the CAM-C2H6 (with the original HTAP2 and revised HTAP2x2 inventories) and GEOS-Chem v10-01 simulations, according to regional/sector sources. The original HTAP2 anthropogenic emissions for 2008 are used for all years, while in the revised HTAP2x2 the global anthropogenic emissions for 2008 were doubled for all years prior to 2009, with increasing North American emissions after 2009.
| Region—sector | CAM-C2H6 (original HTAP2) | CAM-C2H6 (revised HTAP2x2) | GEOS-Chem | ||
|---|---|---|---|---|---|
| 2008–2014 | 2008 | 2010 | 2014 | 2010 | |
| Globe—all sectors | 9.7–10.2 | 17.3 | 17.9 | 18.7 | 13.2 |
| Globe—anthropogenic | 7.5 | 15.0 | 15.3 | 16.2 | 10.5 |
| Globe—biomass burning | 1.8–2.3 | 1.9 | 2.2 | 2.2 | 2.7 |
| Globe—biogenic | 0.4 | 0.4 | 0.4 | 0.4 | Not included |
| North America—anthropogenic | 0.8 | 1.6 | 1.9 | 2.8 | 1.8 |
The solid orange line in figure 2 signifies the C2H6 total columns simulated by CAM-C2H6 with the revised HTAP2x2 inventory and North American emission increases from 2009 onwards. Similar to the FTIR time series, the annual rates of change relative to January 2009 derived from this new CAM-C2H6 simulation are calculated and reported in figure 3. The results show a better agreement with the remote-sensing time series for both the abundance of C2H6 and its seasonal amplitude, especially at the northern sites. The mean daily biases of the model to the FTIR fitted seasonality over the period 2009–2014 are as follows: −4 ± 16% (Eureka), −4 ± 14% (Thule), −18 ± 13% (Toronto), −15 ± 15% (Boulder) and +37 ± 18% (Mauna Loa). Globally, the revised HTAP2x2 inventory allows the model to simulate significant C2H6 increases between ∼2.5 and ∼4% yr−1 from 2009 onwards, although the model still slightly underestimates the rates of change observed at mid-latitudes. Similar findings are deduced from the comparison between CAM-C2H6 and FTIR at Jungfraujoch. These results support the hypothesis that the enhanced North American oil and gas extraction largely contributes to the recent C2H6 increase detected, as assumed previously by Franco et al (2015). For the remote non-continental Mauna Loa site, the CAM-C2H6 results overestimate the FTIR data (figure 2(e)), suggesting that the emissions in Asia (more directly upwind of Mauna Loa) should not be increased as much as 2 times the original HTAP2 inventory.
3.3. Results from GOSAT-based inventory
In this section, we compare the results of GEOS-Chem simulations performed with a new top-down inventory of anthropogenic C2H6 emissions, based on CH4 measurements from GOSAT, to the FTIR observations. Since this new inventory is only for 2010, we compare the simulated C2H6 columns to the FTIR measurements for this year only (figure 4). In order to provide more robust statistics for the representation of the C2H6 seasonal cycle at each site, the available daily mean columns from the 2003–2014 FTIR time series are de-trended and scaled to the year 2010 according to the annual rates of change reported in figure 3. In figure 4, the FTIR monthly means are represented as blue circles along with 1σ standard deviation as error bars, while the blue curve and the shaded area correspond to the running average of the daily mean total columns (with a 2 month wide integration and a 15 day time step) and the associated 1σ standard deviation, respectively. Similarly, the red curve and shaded area designate the GEOS-Chem results. The total C2H6 emissions provided from the top-down inventory for the year 2010 are reported in table 2.

Figure 4. Monthly-averaged C2H6 total columns (in blue circles) and associated 1σ standard deviation (as error bars) displayed on a 1 year time base, from the individual NDACC-FTIR measurements made over the 2003–2014 time period. Using the annual rates of change reported in figure 3, the FTIR total columns have been de-trended and scaled onto the year 2010. The blue curve and shaded area correspond to the running average and 1σ standard deviation, respectively, of the daily mean FTIR measurements, calculated with a 2 month wide integration and a 15 day time step. The red curve and shaded area are the similar results, but deduced from the GEOS-Chem simulation over 2010.
Download figure:
Standard image High-resolution image
GEOS-Chem properly simulates the late winter maximum abundance of C2H6 (figure 4) and reproduces the FTIR total columns found at the two mid-latitude sites, Toronto and Boulder (figures 4(c) and (d)). Both stations are located in the vicinity of intense oil and NG basins: several studies have shown a volatile organic compound source signature associated with the oil and gas industry near Boulder (Pétron et al 2012, Gilman et al 2013, Swarthout et al 2013, Thompson et al 2014), while Toronto is located north of one of the most active basins in the US, the Marcellus shale gas play. Due to its relatively coarse horizontal resolution, the model dilutes local enhancements in C2H6 and hence does not simulate the secondary maximum observed at Boulder during summertime (which is likely due to local air mass circulations).
GEOS-Chem shows a high-bias for the summertime C2H6 total columns at most sites, especially the remote sites (Eureka, Thule and Mauna Loa). The levels of OH, the main tropospheric sink of C2H6, are globally lower by ∼10%–15% in GEOS-Chem v10-01 with respect to previous model versions. This leads to less C2H6 oxidation at the time of OH maximum and to an underestimation of the seasonal cycle. This is particularly relevant for the polar sites, where the lower insolation dampens further the photochemical oxidation, causing C2H6 to accumulate in summer. We cannot rule out a contribution from transport; however, direct transport of pollutants into the arctic is less frequent during summer (Klonecki et al 2003).
The assumptions with regard to the C2H6/CH4 ratios could also induce uncertainties in the inferred C2H6 emissions and could contribute to the biases observed between GEOS-Chem and some FTIR results. Indeed, such ratios largely vary in space and time, e.g., according to the types of facilities and the composition of the NG (Mitchel et al 2015, Subramanian et al 2015).
4. Discussion and conclusions
We used NDACC-FTIR and PARIS-IR time series from five sites to characterize the recent changes in the abundance of C2H6 over North America, and we determined significant annual growth rates of 3–5% yr−1 over 2009–2014, depending on the latitude. These results corroborate the increase observed in the European remote atmosphere and attributed to the development of oil and NG extraction in North America (Franco et al 2015). Using customized simulations of CAM-chem, we evaluated the magnitude of the anthropogenic C2H6 emissions required to simulate the observed abundance of C2H6 prior to 2009 and its subsequent rise. First the simulations indicate that a doubling of the global HTAP2 anthropogenic emissions is necessary to match the C2H6 measurements prior to 2009. Furthermore, an additional increase of the North American anthropogenic C2H6 emissions-dominated by up to 80% by emissions from the oil and gas sector-from 1.6 Tg yr−1 in 2008 to 2.8 Tg yr−1 in 2014, i.e. by 75%, is needed to capture the recent C2H6 atmospheric rise. In an upcoming analysis, it is our aim to refine the source attribution and identification of the geographical origin of the missing emissions with the help of C2H6-tagged simulations and more than twenty NDACC-FTIR time series from various locations around the globe.
Simulations of GEOS-Chem v10-01 were run using C2H6 emissions over North America derived from space-borne CH4 observations from GOSAT (Turner et al 2015). By using a single C2H6/CH4 emission ratio for each source category, we estimated C2H6 emissions from oil and gas activities, biofuel consumption and biomass burning. Results from GEOS-Chem implementing this new top-down inventory agreed well with the FTIR measurements at the mid-latitudinal sites, close to regions with high drilling productivity, but overestimated the summertime minimum at remote sites. These independent results contribute to underscoring the impact of large emissions associated with hydraulic fracturing and shale gas operations in North America on the enhanced C2H6 abundance in the atmosphere. It is worth noting the good agreement between the emission rates derived for the year 2010 from the CAM-C2H6 and GEOS-Chem model investigations (table 2), with the top-down approach offering the opportunity to allocate the C2H6 emissions on the basis of measurements, for a more accurate representation of recent changes in the atmospheric composition.
Ethane shares important anthropogenic sources with CH4, the second most important anthropogenic greenhouse gas, of which the growth rate in the atmosphere has gone on the rise again since the mid-2000s (e.g., Kirschke et al 2013, Nisbet et al 2014). Using C2H6 as a proxy can help to constrain the budget of CH4 for the emissions originating from the recent massive growth in the North American oil and gas industries. If we apply the C2H6/CH4 ratios used to derive the C2H6 emissions from the GOSAT measurements, we estimate that the CH4 emissions from oil and gas activities in North America have increased from 20 Tg yr−1 in 2008 to 35 Tg yr−1 in 2014, in association with the recent rise of the annual C2H6 emissions.
Pursuing atmospheric monitoring activities is of primary importance for evaluating the impacts of the exploitation of shale gas and tight oil reservoirs on greenhouse gas emissions and air quality degradation, especially now that many countries worldwide, e.g., in Europe, are investigating the possibility of starting shale gas exploitation within their own territory in the near future.
Acknowledgments
The University of Liège contribution has been supported by the ACROSAT and AGACC-II projects, funded by the Belgian Science Policy Office, BELSPO, Brussels, within the framework of the PRODEX and Science for Sustainable Development (SSD) research programmes, respectively. The Liège team acknowledges additional support by MeteoSwiss (Global Atmospheric Watch, GAW-CH). Emmanuel Mahieu is Research Associate with F.R.S—FNRS. Funding for Zitely Tzompa-Sosa was provided by Consejo Nacional de Ciencia y Tecnología (CONACYT) under fellowship No. 216028 and the Colorado State University Department of Atmospheric Science Assisting Students, Cultivating Excellence, Nurturing Talent (ASCENT) fund. Support for Emily V Fischer was provided by the US National Oceanographic and Atmospheric Administration under Award number NA14OAR4310148. The National Center for Atmospheric Research is sponsored by the National Science Foundation. The NCAR FTS observation programs at Thule, GR and Mauna Loa, HI are supported under contract by the National Aeronautics and Space Administration (NASA). The Thule work is also supported by the NSF Office of Polar Programs (OPP). We wish to thank the Danish Meteorological Institute for support at the Thule site and NOAA for support of the MLO site. The Polar Environment Atmospheric Research Laboratory (PEARL) in Eureka, Nunavut, Canada is operated by the CAnadian Network for the Detection of Atmospheric Change (CANDAC), led by James R Drummond, and funded by Aboriginal Affairs and Northern Development Canada (AANDC), the Arctic Research Infrastructure Fund (ARIF), the Atlantic Innovation Fund (AIF)/Nova Scotia Research and Innovation Trust (NSRIT), the Canadian Foundation for Climate and Atmospheric Sciences (CFCAS), the Canada Foundation for Innovation (CFI), the Canadian Space Agency (CSA), Environment Canada (EC), the Government Of Canada (GOC)-International Polar Year (IPY), NSERC, the Ontario Innovation Trust (OIT), the Ontario Research Fund (ORF), and the Polar Continental Shelf Program (PCSP). Logistical and operational support at Eureka is supported by PEARL Site Manager Pierre Fogal, CANDAC operators, and the EC Weather Station. Operations of PARIS-IR in Eureka were funded primarily by CSA with additional funding from EC, NSERC and the Northern Scientific Training Program (NSTP) as part of the ACE/OSIRIS Arctic Validation Campaigns. We acknowledge those who contributed to making the PARIS-IR measurements during the campaigns in Eureka and Toronto: Pierre Fogal, Dejian Fu, Ashley Harrett, Alexei Khmel, Jenny Kliever, Paul Loewen, Oleg Mikhailov, Matt Okraszewski, Felicia Kolonjari, Lin Dan, Emily McCullough, Joseph Mendonca, Dan Weaver, and Cynthia Whaley. The Toronto measurements were made at the University of Toronto Atmospheric Observatory (TAO), which has been supported by CFCAS, ABB Bomem, CFI, CSA, EC, NSERC, ORDCF, PREA, and the University of Toronto. Analysis of the Eureka and Toronto NDACC data was supported by the CAFTON project, funded by the Canadian Space Agency's FAST Program. This research was partly supported by the Global Environment Research Fund (S-7/12) by the Ministry of the Environment (MOE), Japan, and the Research Program on Climate Change Adaptation (RECCA) by the Ministry of Education, Culture, Sports, Science and Technology (MEXT), Japan.