

Abstract
Floating persistent debris, primarily made from plastic, disperses long distances from source areas and accumulates in oceanic gyres. However, biofouling can increase the density of debris items to the point where they sink. Buoyancy is related to item volume, whereas fouling is related to surface area, so small items (which have high surface area to volume ratios) should start to sink sooner than large items. Empirical observations off South Africa support this prediction: moving offshore from coastal source areas there is an increase in the size of floating debris, an increase in the proportion of highly buoyant items (e.g. sealed bottles, floats and foamed plastics), and a decrease in the proportion of thin items such as plastic bags and flexible packaging which have high surface area to volume ratios. Size-specific sedimentation rates may be one reason for the apparent paucity of small plastic items floating in the world's oceans.
Export citation and abstract BibTeX RIS

Content from this work may be used under the terms of the Creative Commons Attribution 3.0 licence. Any further distribution of this work must maintain attribution to the author(s) and the title of the work, journal citation and DOI.
1. Introduction
The accumulation of floating debris at sea, particularly plastic litter, has attracted considerable attention over the last few decades (e.g. Thompson et al 2009, Ryan 2015). Small plastic items are particularly problematic because they might act as a vector for persistent, bioaccumulative, and toxic substances to enter marine foodwebs, potentially impacting human health (Teuten et al 2009, Engler 2012, Galloway 2015). Floating marine debris accumulates in mid-ocean sub-tropical gyres, forming so-called 'garbage patches' (e.g. Moore et al 2001, Law et al 2010). The locations of these accumulation zones have been predicted using models based on surface drift data (Lebreton et al 2012, Maximenko et al 2012, van Sebille et al 2012), and generally correspond well with empirical data on the distribution of litter at sea (e.g. Cózar et al 2014, Eriksen et al 2014, Law et al 2014). The models assume that persistent marine debris floats for protracted periods (10–1000 years). However, drifting debris becomes fouled by a variety of marine organisms, including a biofilm of algae and other microscopic organisms as well as macroscopic epibiota (e.g. barnacles, bryozoa, polychaetes and seaweeds) (Ye and Andrady 1991, Railkin 2004, Artham et al 2009, Lobelle and Cunliffe 2011). Depending on the buoyancy of the litter item, this fouling can increase the average density to the point where the item sinks, sedimenting out of surface waters (Holmström 1975, Ye and Andrady 1991, Andrady 2011).
In the absence of vertical mixing, litter items float at sea if their average density is less than that of seawater (approximately 1.03 g cm−3). This requires items made from materials such as glass, metal, rubber and dense plastic polymers (e.g. PET 1.06 g cm−3, polyamide 1.1–1.2 g cm−3 and polystyrene 1.37 g cm−3) to contain trapped air (e.g. sealed bottles, cans, floats and foamed plastics such as expanded polystyrene; Andrady 2015). However, some plastic polymers—including those most often used in single-use applications such as packaging—are positively buoyant in seawater (e.g. polypropylene 0.86 g cm−3 and polyethylene 0.92–0.98 g cm−3). Their low densities, coupled with their long lifespans, result in plastic items dominating marine debris distant from source areas, because together these characteristics facilitate long-distance dispersal (Ryan et al 2009). Low-density plastics comprise almost all floating microlitter (items <5 mm across), because few small litter items contain trapped air pockets (Andrady 2015).
Recent global surveys of floating marine litter have highlighted the apparent paucity of small plastic items (<5 mm; Cózar et al 2014, Eriksen et al 2014, Jambeck et al 2015). Woodall et al (2014) suggested that the deep sea is a likely sink for this 'lost' microplastic. However, their conclusion was based on finding high densities of plastic fibres in deep-sea sediments, all of which are made of polymers that are denser than seawater (polyester, polyamide, acetate and acrylics). In this paper, I use ship-based surveys of floating marine litter to provide empirical support for the notion that size-based sedimentation affects the size and composition of floating marine debris as a function of distance from major litter sources. Buoyancy is a function of volume, whereas the amount of biofouling is limited primarily by surface area. As a result, size should be important in determining the time it takes for biofouling to cause the sinking of items with densities only slightly less than that of seawater, because relative surface area increases dramatically as items get smaller (figure 1). Item shape also is important; for a given volume, surface area to volume ratios are lowest for spherical items and increase as items become elongated, flattened (figure 1) or have complex shapes (e.g. mesh structures). Accordingly, for a given plastic volume, thin litter items such as bags and flexible packaging should sink more rapidly than items made from thicker plastic (although rigidity and material type can influence fouling rates, e.g. Artham et al 2009, Bravo et al 2011).
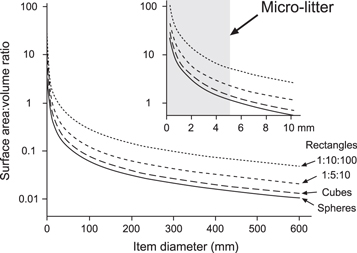
Figure 1. The effect of particle size and shape on its surface area (mm2) to volume (mm3) ratio, scaled against the diameter (mm) of a spherical litter item, and comparative relationships for cubes and rectangular solids with dimension ratios of 1:5:10 and 1:10:100 of equal volume to a sphere of a given diameter. The inset shows the relationship for small items (shaded block = microlitter items <5 mm across). Note the log scale on the y-axis; surface area to volume ratios increase at a rate faster than exponential (which would give a straight line on a semi-log plot).
Download figure:
Standard image High-resolution imageMarine debris comes from two main sources: at sea (fisheries and shipping flotsam and jetsam) and land-based inputs (Ryan et al 2009). This study was conducted off South Africa in the southeast Atlantic Ocean, southwest Indian Ocean, and adjacent Southern Ocean (figure 2), where almost all litter derives from coastal waters. There is little shipping in oceanic waters in this region (Lebreton et al 2012), and limited high-seas fishing effort (Ryan 2014), so most litter in oceanic waters presumably has dispersed there from coastal waters, deriving from land-based sources or coastal shipping and fisheries (Ryan 2014, Ryan et al 2014b). Thus distance from urban centres (at a local scale) and from the continental shelf (at an ocean basin scale) can be used as proxies for time at sea to infer how the size and buoyancy of litter items influences their ability to disperse long distances. I predict that if size-based sedimentation is important, as one moves offshore there should be (1) an increase in the size of floating debris, and (2) a change in debris composition, with an increase in the proportion of highly buoyant items (e.g. bottles, cans, expanded polystyrene and other foamed plastics), and a decrease in the proportion of thin items such as bags and flexible packaging, which have a high surface area to volume ratio compared to more compact shapes.
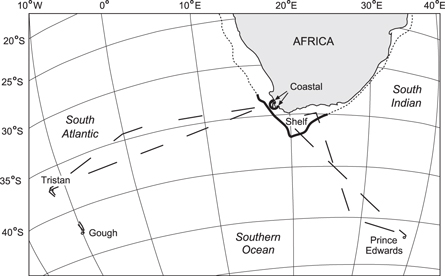
Figure 2. The study area, showing approximate cruise tracks where floating litter was recorded in three regions (delimited by bold lines): coastal waters close to Cape Town, waters over the continental shelf (dashed line depicts the 1000 m isobath), and in oceanic waters.
Download figure:
Standard image High-resolution image2. Materials and methods
Floating marine debris was recorded during four research cruises from Cape Town (34°S, 18°E) aboard the R.V. S.A. Agulhas II: to Tristan da Cunha (37°S, 12°W) and Gough Island (40°S, 10°W) from 5 September to 9 October 2013 (Ryan 2014) and again from 4 September to 9 October 2014, and to the Prince Edward Islands (47°S, 37°E) from 2 April to 6 May 2014 (Ryan et al 2014b) and from 9 April to 15 May 2015 (figure 2). Observations were made using the protocols described in Ryan (2013, 2014) and Ryan et al (2014a). Briefly, litter >1–2 cm long was recorded on one side of the bow from the bridge wing (22 m above sea level) or from the ship's bow (6 m) while the ship was underway during daylight hours. Items were allocated to one of seven distance bands from the side of the ship: 0–10 m, 10–20 m, 20–30 m, 30–40 m, 40–50 m, 50–100 m and >100 m. Frequent observations of small floating organisms (e.g. Physalia) or natural debris items (cuttlefish shells, feathers) provided confidence that small items were detected, at least close to the vessel. The possible effect of item size on detection distance was controlled for by restricting analyses to items observed within 20 and 50 m of the ship. Similarly, to ensure that differences in sea state did not account for differences in the sizes of litter items, analyses were repeated excluding all items observed when there was more than a gentle breeze (Beaufort scale >3, wind >5 m s−1).
Binoculars or images taken with a digital SLR camera and a 500 mm telephoto lens were used to identify litter items and to score the incidence of encrusting biota (presence/absence). Items were placed in broad categories by type of material and application (packaging, fisheries, user items, etc) following Ryan (2014). Small items and submerged items that could not be identified were scored as plastic 'pieces'. The size of each debris item was allocated to one of five size classes based on its longest dimension: <5 cm, 5–15 cm, 16–30 cm, 31–60 cm, and >60 cm (minimum size approximately 1–2 cm). Item buoyancy was scored as protruding well above the surface (mainly bottles, floats, lightbulbs, aerosol cans, expanded polystyrene and other foamed plastics); at the surface without significant windage, or completely submerged. All scores of litter size and buoyancy were made by the same observer, so any biases were consistent across the data set.
Litter was compared in three regions (figure 2): coastal waters within 20 km of Cape Town harbour, shelf waters (all other waters over the African continental shelf), and oceanic waters (>1000 m deep, off the shelf edge). The division of coastal versus shelf waters was imposed in part by the timing of ship movements; all cruises departed in the mid-afternoon, and docked in the early morning, limiting observations close to Cape Town, which is the main source of marine litter in the region (Ryan et al 2014a).
3. Results
One thousand litter items were scored in close to 350 h of observations, with transects covering 8138 km (table 1). The crude density of litter (not controlled for distance from the vessel; Ryan 2013) decreased markedly from coastal waters close to Cape Town through shelf waters and into oceanic waters (table 1), consistent with the assumption that most litter derives from land-based or near-shore sources. However, adequate samples of litter were obtained to detect differences among the three regions (n = 237–400 items per region) because sampling effort increased with distance from shore (table 1).
Table 1. The number and crude density of litter items in relation to sampling effort in coastal, shelf and oceanic waters off South Africa.
| Coastal | Shelf | Oceanic | Total | |
|---|---|---|---|---|
| Number of litter items | 400 | 237 | 363 | 1000 |
| Transect time (h) | 7.3 | 28.7 | 312.3 | 348.3 |
| Distance (km) | 129 | 694 | 7315 | 8138 |
| Litter items per 100 km | 310.1 | 34.1 | 5.0 |
As predicted, litter size increased with distance from shore (pooling items >30 cm, χ2 = 898.2, df = 6, P < 0.001). Figure 3 shows the size frequency distribution for all items recorded. Detection distance is determined in part by item size and buoyancy (e.g. Ryan 2013, 2014), but this had little effect on the size-frequency distributions. Oceanic litter was invariably larger (modal size 5–15 cm) than shelf and coastal litter (modal size < 5 cm) even if litter >50 m (χ2 = 200.9, df = 6, P < 0.001) or >20 m (χ2 = 107.0, df = 6, P < 0.001) from the ship were ignored. Differences in sea state also were not responsible for the observed patterns; the greater preponderance of large items in oceanic waters occurred even when data were restricted to observation periods when wind and wave action was minimal (Beaufort scale ≤3; χ2 = 232.5, df = 6, P < 0.001).

Figure 3. The size frequency distributions for 1000 marine litter items observed floating in coastal, shelf and oceanic waters off South Africa.
Download figure:
Standard image High-resolution image
Plastic items dominated litter throughout (96%–99%, table 2). However, the functional composition of litter varied with distance from shore. Bags and flexible food wrappers dominated in coastal (78%) and shelf waters (66%), but made up only 13% of oceanic litter. There was a corresponding increase in the proportion of buoyant items (bottles, floats, light bulbs, aerosol cans and sealed tins, expanded polystyrene and other foamed plastics) with distance from shore (table 2). Buoyant items that protruded well above the water surface comprised 3% of coastal litter, 17% of shelf litter and 25% of oceanic litter. The proportion of unidentified plastic items also was greater in oceanic waters (26%) than shelf (10%) and coastal (9%) waters. This was due to two factors: an increase in the proportion of degraded fragments, and a greater proportion of submerged items that could not be identified. Submerged items comprised 16% of oceanic litter items, compared to 6% of shelf and coastal litter, suggesting that items that had been at sea longer were more likely to sink. Of the submerged items that could be identified, most were large, thick plastic bags or flexible sheeting. Fishery-related items (floats, netting, ropes, fish trays, etc) also comprised a larger proportion of oceanic litter (table 2), but this did not account for the relatively larger size of litter offshore, because the same pattern occurred if all fishery-related items were excluded from the data set (χ2 = 167.1, df = 6, P < 0.001).
Table 2. The composition of litter items in coastal, shelf and oceanic waters off South Africa.
| Coastal | Shelf | Oceanic | |
|---|---|---|---|
| Bottles | 2% | 5% | 17% |
| Foamed plasticsa | 2% | 10% | 9% |
| Bags and food wrappers | 78% | 66% | 13% |
| Other packaging | 5% | 5% | 6% |
| Floats | <1% | <1% | 5% |
| Other fishing gear | 3% | <1% | 16% |
| Plastic user items | <1% | <1% | 4% |
| Plastic pieces | 9% | 10% | 26% |
| Non-plastic items | 1% | 3% | 4% |
Overall, there was a strongly significant difference in the proportion of the three buoyancy classes among the three count regions (χ2 = 111.3, df = 4, P < 0.001). The increase in submerged items in oceanic waters was consistent with an increase in the incidence of visible epibionts, which were observed on 26% of oceanic litter items, compared to 3% of shelf and <1% of coastal litter items. A yellow-brown biofilm was recorded most frequently (88% of fouled items), followed by barnacles (27%, mainly goose barnacles Lepas spp.) and a few items with large macro-algae (4%; proportions sum to >100% because some items supported multiple epibionts). These are minimum estimates, because only prominent epibionts were visible, and only litter items close to the ship could be examined carefully. Bryozoa and spirorbid worms are commonly found attached to marine debris stranded in South Africa (PGR unpubl. data), but were not visible on litter observed at sea. The higher incidence of epibionts on oceanic litter was not simply a consequence of the greater proportion of submerged items offshore; 23% of surface items supported epibionts in oceanic waters, compared to 0.8% in coastal and shelf waters.
4. Discussion
There is no doubt that some marine debris items can float for prolonged periods and travel vast distances (e.g. Barnes et al 2009, Ebbesmeyer et al 2012). However, it has long been known that fouling by algae and other epibionts can overcome the buoyancy of low-density plastic items, causing them to sink to the seabed (Holmström 1975). Buoyancy is a function of the volume and average density of an item, whereas fouling occurs on the surface of an item (and for very buoyant items, only the submerged parts). Size and buoyancy combine to determine how long persistent debris items float, and thereby influence their ability to accumulate in mid-ocean gyres. The results support both hypotheses based on surface area to volume ratios: the size of litter items increased with distance from the major litter source in the study area, and the proportions of different litter types changed as predicted from their buoyancy and shape. A similar size-based pattern of floating litter distribution was found in the Bay of Bengal, where litter items are smaller towards the head of the Bay, close to the Ganges Delta, which is likely to be a major source of litter into the Bay (Ryan 2013).
Several other factors could have influenced the results. First, windage affects the dispersal rate and direction of floating litter (e.g. Ebbesmeyer et al 2012, Duhec et al 2015), which might contribute to the greater presence of buoyant items in oceanic waters. However, the larger size of items in oceanic waters occurred even if items protruding above the surface were excluded (χ2 = 209.3, df = 6, P < 0.001). Second, oceanic litter might include a larger proportion of ship-derived wastes than coastal or shelf waters. However, the rapid decrease in the density of litter from coastal waters close to the major urban centre of Cape Town, through shelf waters and out into oceanic waters, suggests that differential dispersal from coastal sources dominates the signal detected, supporting the conclusion that size and buoyancy together determine the dispersal of floating litter. Also, there is little evidence to suggest that ship-based waste differs systematically in terms of size or buoyancy; excluding fishery wastes did not affect the overall pattern. Shipping is scarce in the oceanic waters sampled (typically <1 ship seen per day), but abundant in shelf waters around the Cape coast (Lebreton et al 2012), and yet the difference in litter size and composition was more marked between shelf and oceanic waters than between coastal and shelf waters (figure 3). Finally, small items might be broken up more quickly, or become less visible with time at sea. There is little empirical data on the degradation rate of floating plastic items, but in general plastics degrade even more slowly at sea than on land (Andrady 2015). Given lifespans of months if not years at sea (Andrady 2015), it seems unlikely that accelerated degradation accounts for the observed patterns. This conclusion is supported by degradation trials of polyethylene bags suspended in seawater, which developed substantial epibiont communities within 4–8 weeks, yet remained structurally intact to the end of the 16-week experiment (O'Brine and Thompson 2010).
For solid debris items made from a given polymer (i.e. those lacking included air spaces with the same specific density), buoyancy increases with volume irrespective of item shape, whereas surface area varies with shape. Among larger debris items (greater than approximately 100–200 mm diameter), shape is more important than volume in determining the surface area to volume ratio (figure 1). This explains why among macrolitter, long and thin items such as bags show particularly rapid sedimentation. Among small litter items, size is more important than shape, with surface area to volume ratios increasing dramatically for items below an effective diameter of about 5 mm (figure 1). However, caution is needed in extrapolating the results from macrolitter to microlitter, because there may be functional differences in the types of fouling organisms able to colonize different size classes of items, resulting in differences in the rate at which buoyancy is lost.
Indeed, it is simplistic to assume that size, shape and buoyancy alone influence sedimentation rates among floating debris. The rate and type of biofouling varies with the nature of the surface, its location and season (Railkin 2004). Also, particle size affects movement and sink rates independent of buoyancy (e.g. Isobe et al 2014, Woodall et al 2014). However, my results suggest that biofouling could play an important role in structuring the size and composition of litter items floating at the sea surface. Fouling might not lead to sinking all the way to the sea floor; as fouled items sink, changes in the fouling community caused by predation or a lack of light below the euphotic zone might cause plastic to drift up and down in midwater (Ye and Andrady 1991, Andrady 2011). But irrespective of whether items sink all the way to the seabed or yo-yo up and down, they will not be sampled as floating debris by net-tows or direct observations, which together have been used to estimate the amount of floating debris (e.g. Eriksen et al 2014). Sedimentation provides a plausible mechanism for the great discrepancy between estimates of the amount of plastic waste entering the sea (Jambeck et al 2015) and the amount drifting at the sea surface (Cózar et al 2014, Eriksen et al 2014), and suggests that the deep ocean is the major sink for waste plastic (Woodall et al 2014). Size-based sedimentation might explain the apparent paucity of small plastic items floating at the sea surface globally (Cózar et al 2014, Eriksen et al 2014). We require empirical data on size-specific fouling rates and resultant changes in litter density to assess the actual importance of this mechanism.
Acknowledgments
I thank Bruce Dyer for assisting with litter surveys, and Francesca Fazey and Coleen Moloney for advice and discussions, and two anonymous reviewers for their helpful comments. This project was part of the South African National Antarctic Programme, with financial support from the National Research Foundation and the University of Cape Town.