
Abstract
Artemether (ART) and lumefantrine (LUM) are the gold standard antimalarial drugs used for the treatment of malaria in children and pregnant women. Typically, ART and LUM are delivered orally in the form of a combined tablet, however, the appropriateness of this route of administration for these drugs is questionable due to the poor absorption and therefore bioavailability observed unless administered alongside lipid-rich foods. Transdermal drug delivery in the form of a patch-type system has been identified as a viable alternative to the conventional tablet-based therapy. A novel, surfactant-based ART-LUM formulation (S3AL), developed for transdermal delivery, may eliminate the shortcomings associated with oral delivery; namely poor drug absorption which is caused by the inherently low solubility of ART and LUM. Moreover, by successfully delivering these antimalarials transdermally, first-pass metabolism will be avoided leading to enhanced drug bioavailability in both cases. The S3AL formulation contained ART and LUM at equal concentrations (2.5% w/w of each) as well as Procetyl® AWS (30% w/w), oleic acid (10% w/w), 1-methyl-2-pyrrolidone (10% w/w), and water (45% w/w). The addition of LUM to the formulation changed the system from a striae structure to a dark field structure when visualized by a polarized light microscope. Additionally, this system possessed higher viscosity and superior skin bioadhesion, as evidenced by mechanical characterization, when compared to a similar formulation containing ART alone. S3AL was also proven to be biocompatible to human keratinocyte cells. Finally, in vitro studies demonstrated the propensity of S3AL for successful delivery via the transdermal route, with 2279 ± 295 µg cm−2 of ART and 94 ± 13 µg cm−2 of LUM having permeated across dermatomed porcine skin after 24 h, highlighting its potential as a new candidate for the treatment of malaria.
Export citation and abstract BibTeX RIS

Original content from this work may be used under the terms of the Creative Commons Attribution 4.0 license. Any further distribution of this work must maintain attribution to the author(s) and the title of the work, journal citation and DOI.
1. Introduction
Annually, approximately 228 million people are infected with malaria, leading to the deaths of approximately 405 000 people, 67% of which are children under the age of five [1]. Regrettably, a large majority of these deaths, specifically 78%, consistently occur in Africa—a less economically developed region of the globe [1, 2]. However, the negative impact of malaria is not limited to the African region, with many other areas across the globe battling against this infectious disease [3–5]. Malaria is transmitted by mosquitoes of the Anopheles genus, which have been infected by the protozoan parasites, Plasmodium vivax, Plasmodium falciparum, Plasmodium ovale, Plasmodium malariae and Plasmodium knowlesi [4, 6].
Due to increased rates of malaria transmission/ infection, there is a distinct need to broaden the therapeutic options, and routes of administration of anti-malarial drugs. Poor patient adherence is considered to play a major role in the failure of malaria treatment regimes, particularly those that are administered via the oral route. This may be due to, for example, discontinuation of treatment after the presentation of clinical improvement; forgetting to take the correct dose of medication; failure to administer a new dose post-vomiting; lack of professional guidance; or lack of understanding regarding therapeutic efficacy [5–8]. Some of the main symptoms of this disease include fever, anemia, vomiting, nausea, lack of appetite and anorexia. All these symptoms can severely hinder overall treatment efficacy as the patient is prevented from taking their medications alongside lipid-rich foods, which results in reduced drug absorption and ultimately diminished therapeutic effect [9–11].
The first-line treatment for uncomplicated malaria, recommended by the World Health Organisation, is artemisinin-based combination therapy (ACT), which is based on combining two drugs with differing mechanisms of action [12]. ACT consists of semi-synthetic artemisinin derivatives, that have a fast onset of action plus a slow-acting drug such as lumefantrine (LUM), amodiaquine, mefloquine, piperaquine or pyronaridine. The distinct advantage of combination therapy composed of fast-acting and slow-acting components is that treatment can reduce blood parasite levels i.e. parasitemia quickly whilst ensuring that residual parasites are eliminated without causing drug resistance [12]. The gold standard malaria treatment for children and pregnant women is a combination of two drugs, artemether (ART) and LUM [1, 9, 13–17]. Currently, treatment is delivered orally for both adults (80 mg ART/480 mg LUM) and children (20 mg ART/120 mg LUM) twice daily for three days [12].
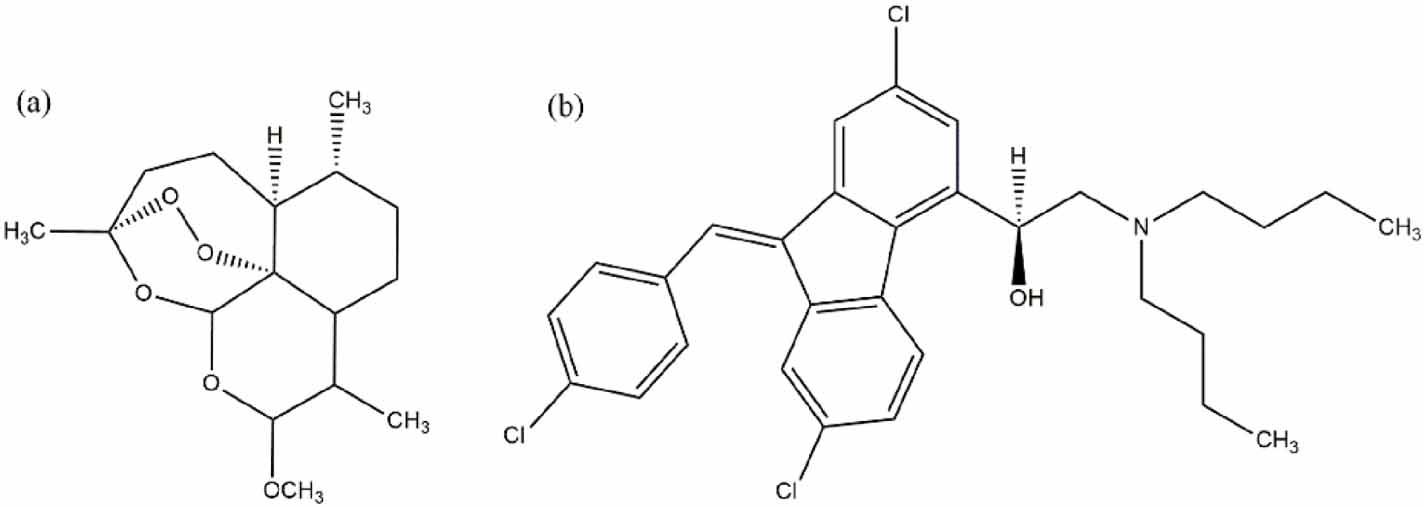
ART (figure 1(a)) is the component of this formulation that acts rapidly to reduce parasitemia by more than 90% within 24 h of treatment commencement, with almost complete eradication achieved within 36 h [18]. Despite the potent nature of ART, systemic absorption is limited to just 30% after oral administration, multiplying the risk of drug resistance due to sub-optimal exposure [13, 17, 18].

Figure 1. Structural representations of (a) artemether (ART) and (b) lumefantrine (LUM).
Download figure:
Standard image High-resolution imageLUM (figure 1(b)), belonging to the aryl amino alcohols class (C30H32Cl3NO), is the slower-acting antimalarial present in this formulation. Its inclusion serves to guarantee that the antimalarial concentration in the plasma is maintained in the therapeutic range for an extended period, thereby ensuring that residual parasites are eliminated, and drug resistance avoided. The bioavailability of LUM after oral administration is significantly improved in the presence of foods rich in lipids i.e. foods with high fat content, due to its hydrophobic nature. LUM has a half-life of 2–3 days in healthy volunteers, however, it has been shown that this is prolonged to between 4 and 6 days in patients infected with malaria [9, 10].
As detailed previously, many antimalarial drugs are hydrophobic in nature and therefore need to be taken with or after food that is rich in fats to ensure adequate drug absorption [9, 19]. The combination therapy of ART and LUM is no exception to this, and as such, many of the patients that receive this treatment are exposed to sub-optimal drug levels due to poor drug absorption caused by the previously mentioned gastrointestinal side effects of malaria that adversely affect their ability to fulfill this need to eat regularly [13–15]. To compound this issue even further, the majority of malaria victims live in grossly underdeveloped regions where the disease is endemic, meaning patients are often unable to access food before the administration of each oral dose of anti-malarial [3, 9, 16].
Owing to the high degree of variability in drug absorption associated with this oral formulation, there is a currently unanswered need to develop formulations for administration via alternative routes [16, 17]. Transdermal drug delivery is the delivery of therapeutic agents across the skin for systemic distribution, and it represents an exciting alternative to traditional oral drug delivery [18]. ART and LUM are hydrophobic compounds and the work outlined within aims to reveal the potential of a surfactant-based, liquid crystalline (LC) transdermal system as a viable alternative for the delivery of these antimalarial drugs to the systemic circulation [20]. LCs are classified as either thermotropic or lyotropic in nature. Thermotropic LCs are formed by anisotropic molecules and are characterized by phase transitions that occur with temperature variation in pure substances [21, 22]. Alternatively, lyotropic LCs, which are regularly utilized in both pharmaceuticals and cosmetics, are formed by the relative concentration of amphiphilic molecules in a given solvent [23–25]. Due to their higher surface area, lyotropic systems increase drug permeation across semipermeable membranes and as such hold much promise as a vehicle for drug delivery via bioadhesive topical formulations [26–28]. The oil phase present in the LCs facilitates the dissolution of a lipophilic drug thereby enhancing its ability to permeate and be absorbed. Furthermore, several studies have shown that LC formulations containing lamellar, hexagonal or cubic mesophase are able to penetrate the skin with ease, demonstrating their suitability for the transdermal delivery of both hydrophobic and hydrophilic drugs [29–32]. Hexagonal and cubic phases were extensively investigated and have much potential for delivering compounds that are difficult to deliver, such as proteins, peptides, nucleic acids and drugs with high or low molecular weight [33]. The difference between these three systems are the package due to the different composition in the water/surfactant and oil phase in a diagram of phases [33].
In general, lamellar systems are formed by a linear arrangement of lipid bilayers, where the hydrophobic tail group points to the center of the sheet, and the hydrophilic head group is in contact with water. In general, they are systems with low viscosity, and show maltese crosses under polarized light microscopic (PLM) analysis. Hexagonal systems are more structured, as they are packaged in the form of long cylinders arranged in the shape of hexagons, formed by amphiphilic molecules mixed with water. Mechanically, they usually show medium viscosity, and present striations when analyzed under PLM. Finally, the cubic systems are more structured and organized mesophases that occur between the lamellar and hexagonal phases. They are systems without birefringence when analyzed under PLM, and rheologically characterized as systems with high viscosity. This mechanical characteristic is responsible for the bioadhesive properties of the cubic mesophase, making it useful to improve the drug penetration through the stratum corneum, which is the main barrier for transdermal delivery systems [33].
Herein we report the development of a transdermal surfactant-based system, incorporating ART-LUM, for the treatment of uncomplicated malaria. This therapeutic option can deliver ART-LUM to the bloodstream through the skin, with the advantage of avoiding the first-pass metabolism, when compared to oral administration. Not only will this serve to enhance the bioavailability of these therapeutics but an effective treatment in this manner should reduce the likelihood of side effect incidence, in the very least diminishing side effect severity [13, 14, 34]. Furthermore, this novel transdermal system was designed self-application by the end-user, enabling administration for both inpatient and outpatient care, an aspect that may greatly expand access to antimalarial drugs and improve the outcome of malaria cases in low-resource settings.
2. Material and methods
2.1. Materials
ART was obtained from Chengdu L & D Pharmaceutical Co., Ltd, (Sichuan Sheng, China) and Santa Cruz Biotechnology, Inc. (Dallas, USA), 98% purity. LUM was purchased from Tokyo Chemical Industry Co., Ltd with 98% purity. Methanol LC-MS grade, formic acid, trichloroacetic acid (TCA), trizma, penicillin, G-streptomycin and sulforhodamine B (SRB) were purchased from Sigma-Aldrich® (Dorset, UK). Oleic acid and 1-methyl-2-pyrrolidone were obtained from Synth® (Diadema, SP, Brazil). Ethanol HPLC grade and Millex® syringe filters (25 mm × 0.22 µm) were provided by Merck® (Darmstadt, Germany). Propoxylated and ethoxylated cetyl alcohol (PPG-5-CETETH-20) were obtained from Croda® (Campinas, SP, Brazil). The human keratinocyte (HaCaT) cell line was obtained from American Type Culture Collection (ATTC) (Manassa, VA, USA). Roswell Park Memorial Institute (RPMI) media (Vitrocell®, Campinas, SP, Brazil) and foetal calf serum (FBS) (Gibco®, Thermo Fisher Scientific, Waltham, MA, USA). Porcine ear skin was purchased from a slaughter house duly certified by the Ministry of Agriculture and Supply of the State of São Paulo (Frigorífico Angelelli LTDA, Piracicaba-SP).
2.2. Construction of phase diagrams and preparation of formulations
Ternary-phase diagrams were developed to aid the process of selecting the most suitable formulation for future studies. These diagrams served as useful visual aids, providing a great deal of information about each formulation in terms of composition and appearance. Briefly, formulations were prepared by weighing out varied amounts of PPG-5-CETETH-20 (surfactant), oleic acid [35] with or without 1-methyl-2-pyrrolidone (oil phase) and water, and maintained at 25 ± 0.5 °C [31, 32]. For over a decade, our group has utilized this phase-diagram approach to optimize and refine the formulation of various systems, including one composed of water, PPG-5-CETETH-20 and oleic acid, which provided the considerable rationale for this work [16, 21, 25, 30, 36]. In this case, it was possible to use the same three components for the ART phase diagram, but for the phase diagram containing the drug combination (ART + LUM), it was necessary to include 1-methyl-2-pyrrolidone, to improve the solubilisation and release of LUM [33].
2.2.1. ART phase diagram
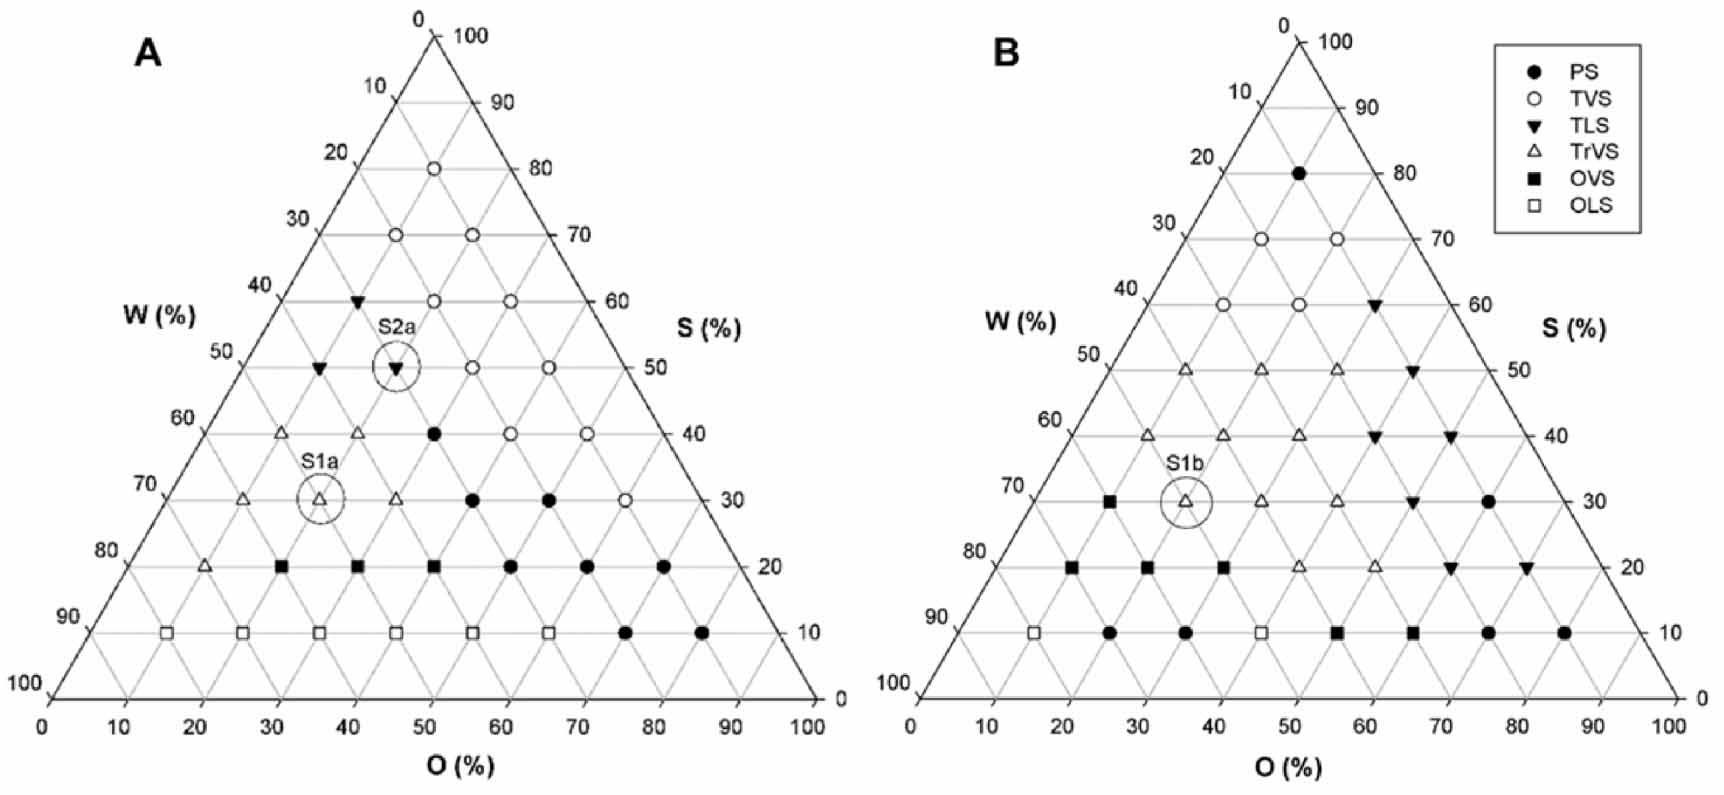
Prior to the development of a phase diagram based on systems that contained both ART and LUM, a diagram based on systems containing ART alone as the active species, was prepared (figure 2).
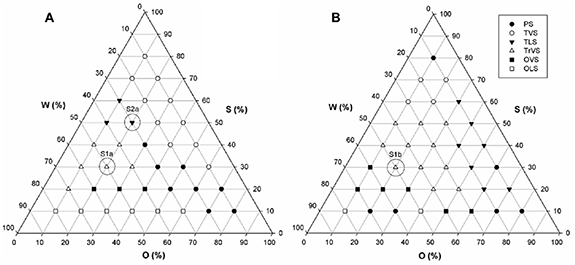
Figure 2. (a) Ternary phase diagram ART (2.5% w/w) obtained by the mixture of water, surfactant and oil and its macroscopic visual examination. Chosen formulations are highlight in the diagram i.e. S1A and S2A, which were composed of 20/30/50 and 20/50/30 (O/S/W), respectively. (b) Ternary phase diagram containing Art-Lum (2.5:2.5% w/w) obtained by mixture of water, surfactant and oil and its macroscopic visual examination. Chosen formulation is highlighted in the diagram i.e. S3AL, which was composed of 20/50/30 (O/S/W). Abbreviations: O—oleic acid); W—(water); S (PPG-5-Ceteth-20); PS—phase separation); TLS—transparent liquid system); TVS—transparent viscous system); TrVS—translucent viscous system); OVS—opaque viscous system); OLS (opaque liquid system).
Download figure:
Standard image High-resolution imageBased on the literature, ART was deemed more likely to interact with system components, and thusly, the generation of the ART phase diagram first, enabled the identification of the formulations that were best suited for LUM incorporation [14, 34, 37]. As detailed above, the ART ternary-phase diagram was constructed based on formulations containing ART (2.5% w/w), and varied concentrations of PPG-5-CETETH-20 (surfactant), oleic acid (oil phase) and water [33]. Previously reported work from our group has investigated the behavior of similar blank systems (i.e. containing no drug). Compositions of the most promising blank formulations (S1 and S2) and drug-containing formulations (S1A and S2A) are listed in table 1.
Table 1. Composition of formulations selected for analysis.
| Formulation | %OA | %S | %W | %MP | %ART | %LUM |
|---|---|---|---|---|---|---|
| S1 | 20 | 30 | 50 | — | — | — |
| S1A | 20 | 30 | 47.5 | — | 2.5 | — |
| S2 | 20 | 50 | 30 | — | — | — |
| S2A | 20 | 50 | 27.5 | — | 2.5 | — |
| S3 | 10 | 30 | 50 | 10 | — | — |
| S3AL | 10 | 30 | 45 | 10 | 2.5 | 2.5 |
Abbreviations: OA: oleic acid; S: PPG-5-ceteth-20; W: water; MP: 1-methyl-2-pyrrolidone.
2.2.2. ART-LUM phase diagram
For the ternary-phase diagram based on formulations containing both ART and LUM (each at a concentration of 2.5% w/w), 36 separate systems were tested. Prior to mixing of the oil and water phases of these systems, the ART-LUM drug combination was solubilized in the oil phase i.e. a 1:1 mix of oleic acid and 1-methyl-2-pyrrolidone. Upon drug solubilization, this oil phase was then mixed with the water phase i.e. PPG-5-CETETH-20 (surfactant) and water. The systems were then left to stabilize for 48 h, before all formulations were inspected visually and classified as either; translucent liquid systems, transparent viscous systems (TVS), translucent viscous systems (TrVS), opaque viscous systems, opaque liquid systems, or as displaying phase separation (PS) [37]. Only the most suitable formulation (S3AL) was taken forward for cell viability studies and bioadhesive evaluation. As before the compositions of the most promising blank formulation (S3) and drug-containing formulation are detailed in table 1.
2.3. PLM
PLM analyses were carried out using a microscope (Carl Zeiss Meditec AG, Jena, Germany) at a magnification of ×20 and under polarized light, with temperature maintained at 25 ± 0.5 °C. To perform each analysis, a small amount of formulation was placed on a glass slide and covered with a coverslip which facilitated the evaluation of system homogeneity and allowed instances of anisotropy or isotropy to be identified [31].
2.4. Texture profile analysis (TPA)
Formulation texture profile analysis (TPA) was carried out using a TA.XT Plus texture analyzer (Stable Micro Systems, Surrey, UK). During this process, the hardness, compressibility, adhesion and system cohesion of each formulation was determined. Characterization in this manner is intended to support the findings obtained from PLM and rheological analyses [22, 29, 38, 39]. Formulations were prepared (50 g), before 7 g of each was transferred into separate 50 ml Sterilin tubes, which were then centrifuged in a Sorvall TC6 centrifuge (Thermo Fisher Scientific, Waltham, MA, USA) at 2665 × g for 15 min to remove air bubbles and ensure surface uniformity. After 48 h, the samples were placed in a thermostatic bath at 32 ± 1 °C to mimic the temperature of skin. Sequentially, the experiment was performed, with the texture analyzer programmed to compress the sample at 1 mm s−1 up to a depth of 10 mm, at which point the probe was then lifted upwards and away from samples at a rate of 0.5 mm s−1. After a 5 s interval, a second compression was carried out following the same protocol and under the same conditions. The number of replicates for this experiment was six.
2.5. Rheological characterizations
Rheological characterizations were performed to confirm the structures identified by PLM and texture analysis [31, 35, 39]. These characterizations were performed using an MCR-102 rheometer (Anton Paar, Graz, Austria). Tests were conducted at 25 ± 0.5 °C using a plate-plate geometry with a 50 mm diameter and a gap of 1 mm, with a solvent trap in place to prevent sample evaporation. Then, steady-state shear measurements were carried out across the range of 0.01–100 s−1. The experimental data were fitted using the power-law model (equation (1)), which is given by:

where, η is system viscosity,  is the shear rate, k is the consistency index and n is the power-law index. Next, amplitude sweep tests were performed at a constant angular frequency of 10 rad s−1 and strain ranging from 0.01% to 100%. Finally, frequency sweep tests were performed at a constant strain of 1% (within the linear viscoelastic range) and an angular frequency ranging from 0.1 to 240 rad s−1. All tests were carried out in triplicate.
2.6. Ex vivo bioadhesion test
A TA-XT2 Texture Analyzer (Stable Micro Systems, Haslemere UK) was used to evaluate the bioadhesion of S3 and S3AL formulations. The samples (10 g) were transferred into 50 ml conical tubes, centrifuged at 2665 × g for 15 min and placed on a support situated on the stage of the Texture Analyzer (n = 6). Dermatomed porcine ear skin [33] was carefully attached to the cylindrical probe (10 mm) of the texture analyzer, using an elastic rubber ring, and then the probe was deployed, at a constant speed of 0.5 mm s−1, until a predetermined compression force of 0.5 N was placed upon the sample [36, 39]. To ensure adequate contact between the skin and the sample, the probe was moved down (1 mm) below the surface of the formulation and held in place for 60 s. Thereafter, the probe was lifted upwards and away from the sample at a speed of 0.5 mm s−1. In all cases, the bioadhesion force (FBA) was considered to correspond to the detachment force (N). Additionally, The work of bioadhesion (WBA) (N), which was calculated from the AUC of the force versus time curve, was determined for each sample, as described previously [39].
2.7. Thermal analysis
Differential scanning calorimetry (DSC) was performed to determine stability of S1A and S3AL at room temperature, as well as the melting points and crystallinity of both formulations themselves, and the individual components of each formulation. For all DSC analyses, a NETZSH DSC 200 F3 Maia® DSC was used and all procedures were carried out according to previously reported protocols [33]. Thermo gravimetric analyses (TGA) were performed to analyze formulation degradation point as a function of weight and temperature and to complement findings from DSC analyses. TGA analyses were carried out using Shimadzu (50 M) TGA equipment [36]. The heating rate was programmed to increase by 10 °C min−1, starting at 25 °C and finishing at 500 °C, under a nitrogen flow of 50 ml min−1.
2.8. In vitro permeation studies
In vitro permeation studies were carried out using the widely reported Franz cell apparatus (Hanson Vertical Diffusion Cell, Microette Plus, Hanson Research, USA) which were assembled in combination with dermatomed porcine ear skin following a previously described protocol [38, 40]. The receiver compartment of each Franz cell contained 50:50% v/v ethanol:water [14], which was degassed prior to use and thermostated at 32 ± 0.5 °C with constant agitation at 50 rpm. The media described here is permitted by OECD guidelines, which states that 50% (v/v) is the maximum concentration of ethanol allowed to be used in such permeation studies [40]. A defined mass of formulations containing ART or ART-LUM (1 g), were placed onto the dermatomed porcine ear skin (circular area of 0.6 cm2) and the donor compartment of the apparatus was clamped onto the receiver compartment. In order to investigate the permeation of pure drug substances using the same methodology, both drugs were dispersed in propylene glycol (25 mg of drug per gram of dispersion), and then 1 g of this dispersion was applied to dermatomed skin as before [41].
At pre-determined time intervals an automated sampling device, (Virtual Instruments, Microette Plus, Hanson Research, USA) collected 250 µl of sample fluid from the receiver compartment. After sample collection, an automated injector (Auto Plus ™ MultifillT M injector, Hanson Research, USA) replenished receiver medium (50:50% v/v ethanol:water) levels with 250 µl of freshly prepared receiver medium. Sample collection time points were at 30, 60, 90, 120, 180, 240, 300, 420, 480, 720 and 1440 min.
Calculation of the permeation profiles of ART and LUM were determined as previously described [41]. Briefly, the cumulative amount of ART or LUM transported across dermatome porcine skin was plotted as a function of time.
2.9. Quantification of ART
The quantification of ART was carried out using ultra-performance liquid chromatography in combination with mass spec (UPLC-MS), (Accela 600 pump, Accela autosampler, LTQ XL™ Linear Ion Trap Mass Spectrometer, Thermo Fischer Scientific Inc., Waltham, MA, USA) with detection measured by single ion monitoring of the daughter ion m/z 163. System parameters were based on a previously reported method [14, 42], which was validated in accordance with protocols published by the International Conference on Harmonization (ICH) [43]. Separation was achieved using a Waters® Acquity BEH-C18 (1.7 µm pore size, 2.1 × 50 mm) analytical column and the chromatograms obtained were analyzed using Thermo Xcalibur software 2.2 SP 1.48. The mobile phase was composed of 20:80% v/v water (0.01% v/v formic acid): methanol (LC-MS grade, 0.01% v/v formic acid). Following sample injection, mobile phase was maintained at 20:80%, for 3 min followed by an incremental increase to 100% methanol (0.01% v/v formic acid), and held for a further 3 min. Total sample run time was 6 min with a flow rate of 0.4 ml min−1 and an injection volume of 1.0 µl. Linear ion trap mass spectrometer parameters consisted of a capillary temperature of 320 °C, a vaporizer temperature of 450 °C, gas flow at 30 arbitrary units (arb), auxiliary gas flow at 15 arb, sweep gas flow at 5 arb, tube lens voltage at 80 Volts (V), capillary voltage at 28 V and source voltage at 6 kV, in positive mode. The ART calibration curve was run with ART concentrations in the range 1.560–200 ppm, dissolved in mobile phase.
2.10. Quantification of LUM
LUM quantification analysis was also carried out using a validated method, developed in accordance with ICH [43]. The method was performed on a UPLC system autosampler (Xevo TqD® Waters® Acquity, Waters Corp., Milford, MA, USA), with detection measured by multiple reaction monitoring of the mean LUM ion m/z 530 and of the daughter ion m/z 348 [44]. Chromatograms were analyzed using MassLynx software. The mobile phase used was A (0.1% formic acid) and B (methanol LC-MS grade), following a gradient elution protocol. After sample injection, mobile phase was increased gradually from 60% B to 100% B over the course of 3 min, at which point mobile phase composition was held for 2 min to elute LUM, before mobile phase composition returned to 60% B for 2 min to ensure column equilibration. Total sample run time was 7 min with a flow rate of 0.4 ml min−1 and an injection volume of 1.0 µl. Mass Spectrometer parameters consisted of a desolvation gas flow (N2) of 300 l/hora, a desolvation temperature of 200 °C, a collision gas flow (Ar) of 1 l h−1, an ionization source temperature at 150 °C, a capillary voltage of 3.5 kV and a cone voltage of 45 V, in positive mode.
2.11. Samples preparation for analytical analysis
Prior the analytical analysis described above, the samples from in vitro studies were centrifuged at 12 500 rpm for 10 min, before the supernatant was removed and filtered using a filter membrane 0.22 µm Gamma Sterilized (Millex ® GP)[45].
2.12. Cell viability studies
Cell viability studies were performed to evaluate the safety of the formulation i.e. skin cell viability when in contact with the formulation and the effect of concentration on cell viability. These studies were performed using the human epithelial HaCaT cell line, a spontaneous immortalized non-tumorigenic human keratinocyte cell line (ATTC, Manassa, VA, USA). Cells were cultured in RPMI media (Vitrocel®), including 5% FBS (Gibco®), 100 U ml−1 penicillin and 100 µg ml−1 G-streptomycin at 5% atmospheric CO2 and incubated at 37 ± 0.5 °C. When cells had reached 80% confluency, they were harvested following 0.25% trypsin–EDTA treatment for 5 min (TrypLE Express; Thermo Fisher Scientific) at 37 ± 0.5 °C. Proteases were then inactivated by the addition of 0.3 mg ml−1 trypsin inhibitor and cells were harvested by centrifugation (500 × g for 5 min), suspended in fresh medium, seeded into a 96-well microplate (200 μl/well, 106 cells ml−1), and incubated overnight at 37 ± 0.5 °C in an atmosphere of 5% CO2 to allow cell adhesion before stimulation. All formulations were diluted 1:400 in RPMI media prior to their addition to cell cultures. The formulation dilutions and exposure times were based on those reported previously [46]. Cells were then treated with S3, S3AL, ART, LUM and an ART-LUM combination (1:1 w w−1) at 125, 62.5, 31.25, 15.62, 7.81, 3.90, 1.95, 0.97 and 0.48 µg ml−1. Treatments were carried out in triplicate. After exposure, the culture medium was removed and then replaced by fresh medium. The cells were then incubated for a further 24 h. A colorimetric SRB cell-viability assay was used to determine the effect of the treatments on cell viability. After 24 h, the cells were fixed with 50 µl TCA (50%) and incubated for 60 min at 4 ± 0.5 °C. Thereafter, TCA was removed, and the cells were washed with water, followed by drying of the plates at room temperature. Then 50 µl of SRB (0.4% w/v in acetic acid 1%) was added to the wells and was left in contact with the cells for 20 min. They were washed again with acetic acid (1%) and dried at room temperature. Finally, 150 μl of Trizma (10 μM, pH 10, 5) was added to the wells. The absorbance was measured at λ = 570 nm using a digital spectrophotometer Elx800 Absorbance Microplate Reader (Biotek, USA) and values were expressed as percentages of SRB reduction over control.
2.13. Statistical analysis
Where appropriate, data was analyzed using one-way analysis of variance (one-way ANOVA) with the Turkey-Kramer post hoc test. In all cases, p
 0.05 denoted significance. Statistical analysis was carried out using Sigma Plot and Origin Pro 8 software.
3. Results and discussion
3.1. Phase diagram
The surfactant-based systems (LCs) were developed in accordance with the phase diagrams (figures 2(a) and (b)), comparing 36 systems containing a mixture of PPG-5-Ceteth-20 as a surfactant (S), oleic acid as an oil phase (O) and water (W) with ART solubilized in O [47] (diagram 1, figure 2(a)). The second diagram (figure 2(b)) was developed containing ART:LUM in combination (2.5:2.5% w/w). The solubilization of both drugs in the same phase was performed by mixing the drugs in the oil phase, in this case, it was necessary to use oleic acid: 1-methyl-2-pyrrolidone (1:1 w w−1) to ensure total dissolution of LUM in the system. The blank system formulation, composed of water (W), PPG-5-Ceteth-20 (S) and oleic acid (O) was first conceptualized within our group by Carvalho et al in 2010 [28] and has to be used to in combination with multiple drugs including azidothymidine and celecoxib [20, 31]. The ternary-phase diagram for ART indicated formation of TVS, from 50% to 60% of S, 40% to 50% of W and 10% to 20% of O. The phase diagram for formulations containing both ART and LUM (figure 2(b)) was developed, in order to compare the behavior of the system when LUM and 1-methyl-2-pyrrolidone were added. When in comported into these LC systems, the solubility of LUM improved from 3.09 × 10⁻⁵ mg g−1 in water to 25 mg g−1 when in the formulation, whilst ART demonstrated an approximate 54-fold solubility improvement when compared with its intrinsic aqueous solubility (0.457 mg ml−1). For this diagram, the point S3AL the same classification (TrVS). PS points were moved to external points in the diagram and TVS systems were formed between 70% and 60% of S and TrVS formulations, which formulation S3AL was classed as were formed between 50% and 20% of S. The final composition of the LCs studied is represented in table 1.
The regions in the ternary diagram were delineated and formulations S1A, S2A and S3AL were selected for physiochemical characterization and release studies. Based on the release results, the S3AL system was chosen as a suitable candidate for the incorporation of both drugs (ART and LUM). Due to the S1A system (which was located at the same point as S3AL on the ART diagram) demonstrating a better release capacity in relation to the S2A system, only the final formulation S3AL was tested during bioadhesion and cell viability studies.
3.2. PLM
Formulation characterization under PLM is essential to predict the structures formed in each system. The photomicrographs obtained from PLM clearly showed the presence of well-defined striations in systems S1, S1A and S3AL, which suggests the presence of hexagonal phase systems. System S2 showed the presence of malt cross-shaped structures, indicating the presence of lamellar phase system [32]. S2A system, which is the combination of S2 system with ART, presented, both malt cross-shaped structures, and striae, suggesting that the addition of ART to the system favored the formation of a hexagonal phase system. Therefore, these systems were characterized as anisotropic systems [23].
More viscous systems and under polarized light exhibit structures in the form of striations, as is well evidenced in S1, S1A, S3 and S2A systems (figure 3). Lamellar systems have parallel and planar layers of bilayers of surfactant separated by layers of a solvent-dimensional forming network [28] and under PLM exhibit malt cross-shaped structures [27, 43]. The presence of LUM altered the liquid-crystalline mesophase formation of S1 and S1A, producing very well defined hexagonal phases when observed under PLM [23, 32].
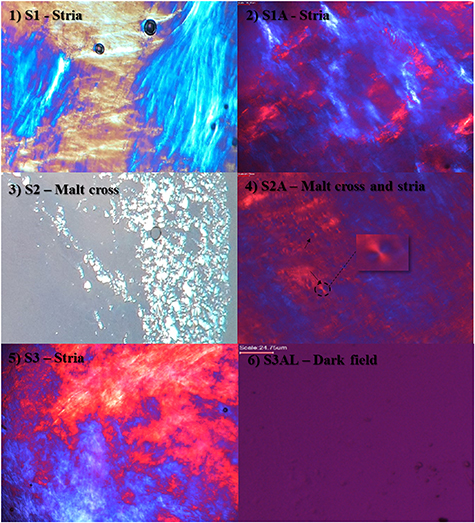
Figure 3. The structure of each system observed under polarized light microscopy: (1) S1—stria; (2) S1A—stria; (3) S2—malt cross; (4) S2A—Malt cross and stria; (5) S3—stria and (6) S3AL—dark field. Magnification 20×.
Download figure:
Standard image High-resolution imageSystem S3AL did not present birefringence under PLM, with sample dark visual field, yet due to the high viscosity observed (item 3.3 and 3.4), it is likely that it can be classified as a cubic mesophase. However, not all the systems mentioned have this characteristic, only the lamellar and hexagonal phase systems present birefringence when analyzed under PLM. As cubic phase systems are isotropic and thus are not able to deflect light from polarized plane, presenting the birefringence phenomena, this classification of S3AL is based on the system viscosity and transparency [31, 32]. S3AL system, which presented a dark field under polarized light, was characterized as a highly viscous and isotropic system [38].
3.3. Texture analyzer
Formulation TPA, using the TA.XT Plus texture analyzer, is a simple and rapid, penetrometric, technique that can be used for the mechanical characterization of semi-solid pharmaceutical formulations and for the identification of physical–chemical interactions between formulation components [39]. The parameters studied in TPA included; adhesiveness (attractive forces between the surface of the probe and the sample); compressibility (force required to deform the product during the first probe compression cycle, this test determines the degree of spreadability of the formulation for real life application, hardness (force required to deform the sample) and cohesiveness (force required to overcome the internal bonds of the material) [16].
Table 2 displays the texture profile parameters of blank samples (S1 and S2), the samples that were loaded with ART (S1A and S2A) and those that were loaded with the ART-LUM combination (S3AL). From this table it is evident that, compared to their respective blanks, the addition of ART decreased the hardness, compressibility and cohesion of LC formulations. However, by adding LUM to the formulation in association with ART (S3AL), there was a considerable increase in hardness, as well as a substantial increase of cohesion. Conversely, the addition of LUM to such formulations served to decrease overall LC adhesiveness and compressibility.
Table 2. Hardness, compression area, cohesion and adhesion measurements of LC systems: S1, S1A, S2, S2A and S3AL. Data obtained from texture analyzer (n = 5) (Mean ± SD).
| Compression | ||||
|---|---|---|---|---|
| Samples | Hardness (N) | area (N s−1) | Adhesion (N s−1) | Cohesion (%) |
| S1 | 1.064 ± 0.105 | 0.709 ± 0.044 | 0.791 ± 0.066 | 67.38 ± 0.036 |
| S1A | 1.154 ± 0.108 | 0.721 ± 0.056 | 0.766 ± 0.085 | 62.61 ± 0.019 |
| S3AL | 7.617 ± 0.735 | 0.499 ± 0.095 | 0.512 ± 0.086 | 88.42 ± 0.029 |
| S2 | 0.153 ± 0.017 | 0.105 ± 0.009 | 0.092 ± 0.017 | 69.18 ± 0.022 |
| S2A | 0.217 ± 0.036 | 0.139 ± 0.010 | 0.130 ± 0.010 | 64.37 ± 0.028 |
Considering LC adhesion (table 2), this property increased when ART was added to S2, going from 0.092 ± 0.017 N s−1 in S2, to 0.130 ± 0.0102 N s−1 in S2A. For the S1 LC system, the opposite trend was observed, with a slight decrease from 0.791 ± 0.066 N s−1 in S1, to 0.766 ± 0.085 N s−1 upon ART introduction. The combined formulation S3AL, displayed a greater decrease in LC adhesion with a final adhesive force of 0.512 ± 0.086 N s−1 observed. The changes in the adhesive properties of these systems could be in relation to the variation in the phases of each, as evidenced in figure 3. Where, S2 showed maltese crosses, common in systems with a lamellar phase, whereas S1 exhibited structures with a striate arrangement, characteristic of hexagonal systems [16, 18, 26, 40]. Hexagonal phase LCs possess a higher degree of organization, and consequently, are highly viscous systems, when compared to lamellar systems [17, 24, 42].
Samples S1, S1A and S3AL demonstrated average hardness of 1.064 ± 0.105 N; 1.154 ± 0.108 N, and 7.617 ± 0.735 N, respectively. A slight increase in LC hardness was observed for the sample without ART (S1), compared to the sample containing ART (S1A). However, a considerable increase in hardness was observed upon the addition of LUM to S1A i.e. in S3AL. System 2, presented hardness of 0.153 ± 0.017 N for S2 and 0.217 ± 0.036 N for S2A, demonstrating again an increased hardness when ART is included in the formulation.
The formulation that displayed the greatest cohesion was S3AL, with a value of 88.42 ± 0.029%. The blank form of this LC system (S1) showed a decreased cohesion profile of 67.38 ± 0.036%, whilst a similar formulation that contained only ART (S1A) demonstrated a further decrease in cohesion (62.61 ± 0.019%). A similar trend was observed for system 2, where the blank formulation (S2) displayed 69.18 ± 0.022% cohesion, whereas S2A, which contained ART, had a cohesion value of 64.37 ± 0.028%. These findings confirmed that ART is responsible for a reduction in system cohesion in both S1 and S2 systems.
The compressibility of blank formulation S1 (table 2) was seven times greater than that of S2. In a similar fashion, the compressibility of S1A was five times greater than S2A. Interestingly, for both LC systems, the addition of ART served to enhance system compressibility with S1 and S2 showing compressibility values of 0.709 ± 0.044 N s−1 and 0.105 ± 0.009 N s−1, respectively, whilst their drug-containing counterparts had compressibility values of 0.721 ± 0.056 N s−1 and 0.139 ± 0.01 N s−1, respectively.
3.4. Rheological behavior
Rheological characterizations were performed for samples S1, S1A, S3 and S3AL. S3AL, exhibited the greatest hardness of all the samples tested, hence, this sample was analyzed further, and the results plotted separately in figure 4.
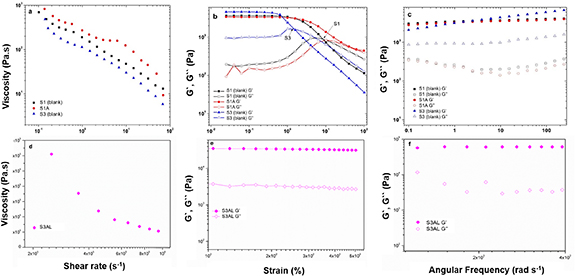
Figure 4. (a) Viscosity as a function of the shear rate, (b) amplitude sweep test; storage (G′) and loss (G″) moduli as a function of the strain, and (c) frequency sweep test; storage (G′) and loss (G″) moduli as a function of the angular frequency for S1, S1A and S3. (d) Viscosity as a function of the shear rate, (e) amplitude sweep test; storage (G′) and loss (G″) moduli as a function of the strain, and (f) frequency sweep test; storage (G′) and loss (G″) moduli as a function of the angular frequency for S3AL.
Download figure:
Standard image High-resolution imageThe steady-state shear measurements are shown in figures 4(a) and (d), and the power-law fitting parameters are presented in table 3. The data obtained here revealed that LCs exhibited shear-thinning behavior. As observed, the viscosity of S1, S1A, S3 and S3AL decreased when the shear rate increased, in all instances, n< 1. System S1 (blank) showed a consistency index of 171.9 ± 8.13 Pa sn and after ART incorporation (S1A), this parameter increased to 302 ± 36.6 Pa sn. This represented a 75% increase in relation to S1, which resulted in a significantly increased viscosity. S3 (the blank of S3AL), which is composed of formulation S1 and 1-methyl-2-pyrrolidone, exhibited a consistency index of 109.15 ± 4.26 Pa sn, which implied that the presence of this component in the formulation may have been responsible for the decrease in viscosity. The systems S1, S1A and S3, showed the presence of striations, under PLM, which are characteristic of hexagonal phase systems. These systems are generally more viscous than lamellar phase systems [24, 29]. The increase of viscosity in hexagonal systems can be explained by the solvation of the polar terminal chain present in the PPG-Ceteth-20, surfactant, by the addition of water. This leads to an increase in the polar region of the system, as well as system volume and curvature, resulting in hexagonal phase structures due to a greater degree of packing. In this way, structures that are more densely packed are more restricted in terms of lateral and translational movement, resulting in higher system viscosity [17, 24, 42].
Table 3. Ostwald-de-Waele viscosity model fitting parameters for LC systems: S1, S1A, S3 and S3AL.
| Samples | m (Pa sn) | n (-) | R2 |
|---|---|---|---|
| S1 | 171.9 ± 8.13 | 0.436 ± 0.027 | 0.9882 |
| S1A | 302 ± 36.6 | 0.419 ± 0.021 | 0.9244 |
| S3 | 109.15 ± 4.26 | 0.360 ± 0.0202 | 0.9835 |
| S3AL | 5085 ± 1973 | 0.594 ± 0.054 | 0.7590 |
Abbreviations: m (consistency index); n (power law index).
Additionally, after ART-LUM incorporation, S3AL had the highest consistency index of 5085 ± 1973 Pa sn, (figure 4(d)) which complemented the findings of LC hardness analysis. The highest viscosity observed in S3AL suggested the presence of a cubic phase in the system, due to the extreme viscosity level, characteristic in non-birefringence, cubic systems [22, 29, 38]. Whereas, as observed in figure 4(b), formulations S1 and S3 exhibited a definite transition from solid-like (G′ > G″) to liquid-like (G″> G′), while formulation S1A and S3AL (figure 4(e)) showed a solid-like character throughout the range analyzed. Subsequently, the frequency sweep analysis results shown in figure 4(c) present a similar pattern for samples S1 and S1A, suggesting that the addition of ART, under conditions of constant deformation, did not generate significant changes in the storage modulus (G′) and loss modulus (G). The S3 system, however, presented a distinct pattern, having G′ greater than the other formulations tested, which corroborated with the decreased viscosity and the transition to liquid-like behavior. The formulations were also classified as Newtonian (n = 1) or non-Newtonian fluid (n > 1). It is evident that all formulations possess non-Newtonian behavior, being characterized as a pseudoplastic fluid (n > 1) [48]. The present results are in agreement with the literature data [47, 48] where surfactant-based systems are well known as non-Newtonian behavior. In addition, the pseudoplastic behavior is a desirable characteristic for formulations that will be applied in the skin surface [48]. This is explained due to the capacity of easily flow in the skin when the stress is applied, improving the spreadability application and consequently the skin release [48].
3.5. Ex vivo bioadhesion test
The ex vivo bioadhesion experiment was intended to provide a comparison between S3AL (containing ART-LUM) and its respective blank formulation (S3). The parameters evaluated in this test were the bioadhesive force (FBA), defined as that corresponding to the maximum detachment force between the pig skin and formulation, and the bioadhesive work (WBA), related to the detachment energy [30]. The bioadhesion results for S3AL, in relation to the sample without drug (S3-blank) (table S1 available online at stacks.iop.org/BMM/16/065015/mmedia), indicated that the incorporation of the drugs into the surfactant-based LC system positively influenced bioadhesion properties. Specifically, the sample containing the drug combination demonstrated a significant increase in FBA (−0.169 N) compared to S3 (blank), which had an FBA of −0.036 N. Regarding bioadhesive work (WBA), the sample with the highest energy when in contact with the pigskin was S3AL with 0.564 N.s versus a WBA of −0.126 N s for S3. The finding that drug incorporation resulted in an increased bioadhesive force (FBA) and work (WBA), is most likely inferred by supramolecular bonds between the drugs and the formulation components [24, 41]. Surfactant-based systems are characterized by their bioadhesiveness due to supramolecular ordinations of the LCs to the surface of the mucosa or skin, where, once bonded on the surface of a biological tissue, long chain lipids, have high resistance to aqueous dilution, resulting in high adherence [38, 49]. The present study has demonstrated the efficiency of bioadhesion, of the investigated systems, and has identified that the presence of the drugs ART and LUM increase the system bioadhesion [15]. These findings can be correlated with the mechanical properties discussed previously, which found that a higher viscosity was observed when the drugs were incorporated in similar systems. In this case, a higher system viscosity has served to increase system bioadhesion and may improve the permeation of drugs into and through the skin.
3.6. Thermal analysis—TGA and DSC
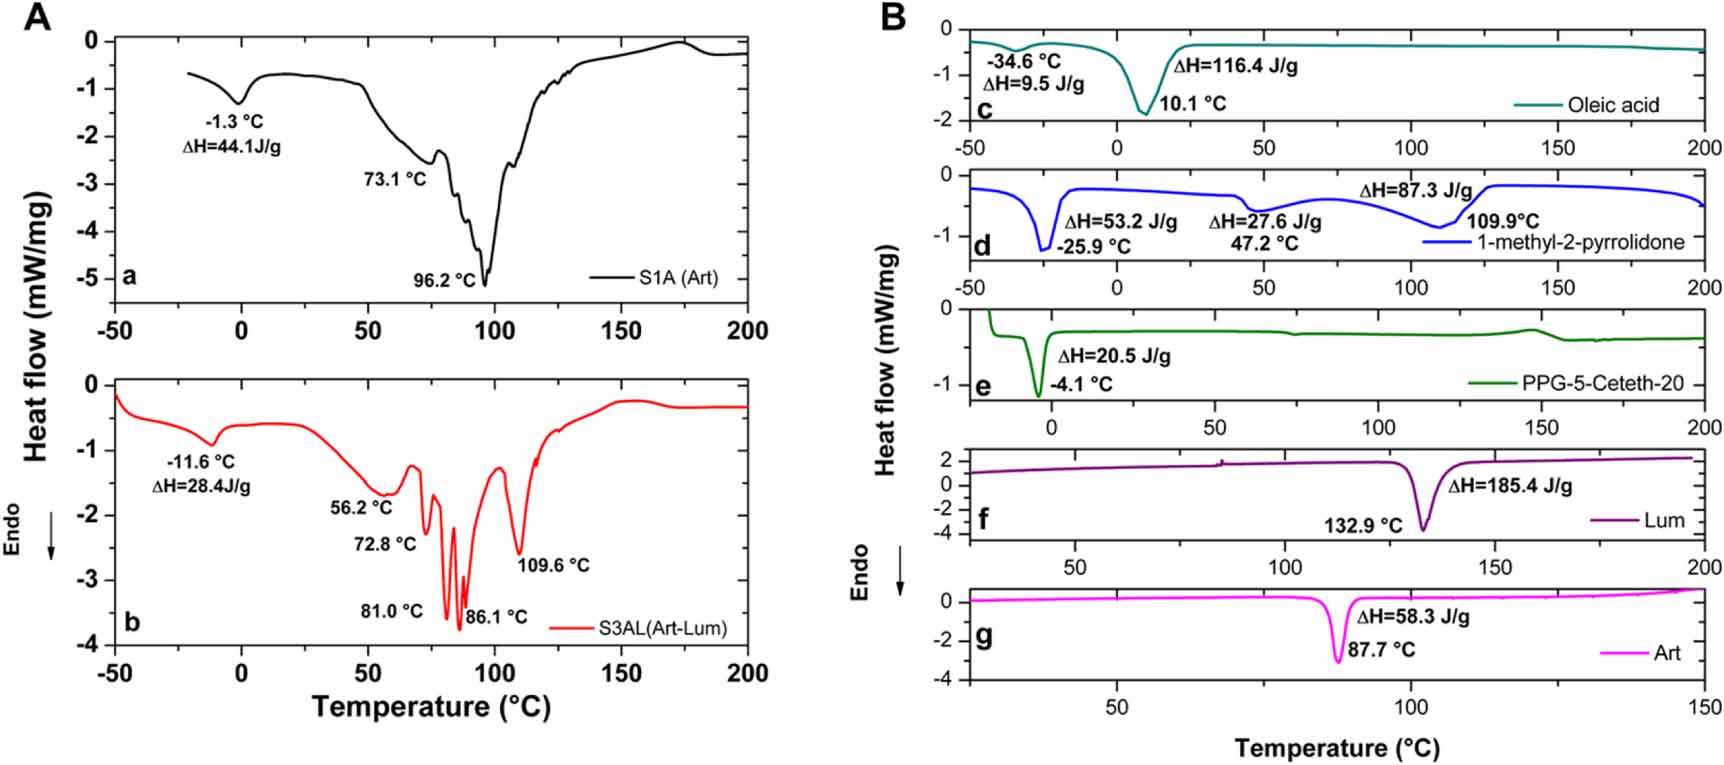
DSC analysis of LCs results for S1A, S3AL and all the individual formulation components are shown in figures 5(a) and (b). In the trace corresponding to S1A (figure 5(a)), the first endothermic peak, which occurred at −1.2 °C may be attributed to PPG-5-Ceteth-20 (figure 5(a)) [14]. The second and third events on this trace, which occurred at 73.1 and 96.1 °C, respectively, may correspond to the melting point of ART (usually at 87 °C), which had shifted due to interactions with components of the LC formulation. This can be corroborated taking into account the enthalpies of each component and their concentrations. The enthalpy calculated for the S1A (ART) corresponded to 44.1 J g−1.
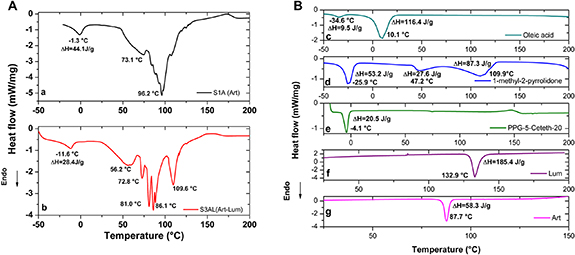
Figure 5. (a) DSC analysis of LC systems S1A (ART) and S3AL (ART-LUM). (b) DSC analysis of ART, LUM, PPG-5-Ceteth-20, 1-methyl-2-pyrrolidone and oleic acid.
Download figure:
Standard image High-resolution imageThe S3AL (ART-LUM) trace displayed an endothermic peak at −11.6 °C (figure 5(b)). This latter could be associated to 1-methyl-2-pyrrolidone and PPG-5-Ceteth-20 melting points: Tm = −25.8 °C and −4.1 °C respectively. Moreover, could be also associated to the oleic acid endothermic peak at −34.6 °C (figure 5(b)). This can be corroborated taking into account the enthalpies of each component and their concentrations: the enthalpy calculated for the S3AL (ART-LUM) first peak, as a function of its components is 24.8 J g−1, while the measured in the S3AL sample 28.4 [14, 50].
Mass loss as a function of temperature was performed using TGA analysis, in order, to obtain an estimation of the degradation profile of the surfactant-based systems S1A and S3AL (figures 6(a), (b), table 4). An overarching finding obtained from this analysis was that the degradation profiles of both LC systems were similar in nature.
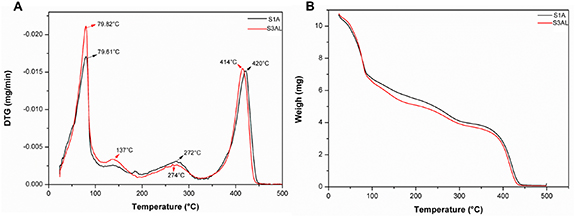
Figure 6. (a) Derivative thermogravimetry (DTG) for LC systems S1A and S3AL. (b) TGA curves for LC systems S1A and S3AL.
Download figure:
Standard image High-resolution imageTable 4. Percentage weight loss by TGA analysis of LC systems S1A and S3AL as a function of temperature.
| Temperature | Sample mass | ||
|---|---|---|---|
| Sample | range (°C) | loss (%) | Inference |
| S1A— ART | 24–88 | −38.96 | Loss of water and Art melting point |
| 117–295 | −24.03 | Degradation of 1-methyl-2-pyrrolidone and ART. 1st decomposition phase of oleic acid | |
| 338–433 | −35.44 | 2nd stage of decomposition of oleic acid | |
| S3AL— ART-LUM | 24–88 | −42.43 | Loss of water and Art melting point |
| 118–164 | −10.00 | 1st phase of decomposition of oleic acid and LUM melting point | |
| 196–299 | −13.00 | Degradation of 1-methyl-2-pyrrolidone | |
| 305–430 | −33.68 | 2nd stage of decomposition of oleic acid |
The first event observed in both samples was a peak at 79 °C, which started at 24 °C and ended at 87 °C. Since ART was present in both samples and it has a melting point of 87 ± 2 °C [13], it was inferred that this event was due to both water loss and the melting point of ART. This initial mass loss was the most significant for both samples, with loss of mass corresponding to −38.96% for S1A and −42.43% for S3AL. The hypothesis that water loss played a major role in this mass loss is well informed as both formulations contained 50% of this component. The second event in S3AL, started at 118 °C with endpoint at 164 °C and a peak at 137 °C. This event can be attributed to the onset of melting point of LUM, which occurs between 128 °C and 131 °C. Moreover, this event is also attributed to the first phase of oleic acid degradation and ART degradation [51]. The second S1A event, began at a similar temperature (117 °C), however, this event had an extended range, with an endpoint at 295 °C and a peak at 272 °C. The first stage of degradation of oleic acid (150 °C) and 1-methyl-2-pyrrolidone (206 °C) can be attributed to this event. The third distinct event in the S3AL trace, which began at 196 °C, ended at 299 °C and had a peak at 274 °C, may correspond to the degradation phase of 1-methyl-2-pyrrolidone.
The last events of both samples very similar in nature. This event began at 338 °C, peaked at 420 °C and ended at 433 °C for S1A, whereas, the event on the trace for S3AL started at 335 °C, peaked at 414 °C and finished at 429 °C. The results here suggest that this event may correspond to the degradation of Procetyl® AWS [14]. The results presented here suggests that both systems can be storage at room temperature, without drug degradation. However, further studies should be conducted to confirm this statement.
3.7. In vitro permeation studies
In order to select the best formulation for the transdermal delivery of the antimalarial drug combination of ART and LUM via permeation into and through the skin, in vitro permeation studies using the modified Franz cell apparatus and dermatomed porcine skin (500 μm thickness) were carried out. Initial studies tested the permeation of ART from S1A and S2A systems, with the drug quantified using UPLC/MS, according to the method outlined in table S2. After 24 h, a higher concentration of ART had permeated from S1A (648 ± 104 μg cm−2 24 h) compared to S2A (400 ± 153 μg cm−2 24 h) (table 5) (figure 7(a)). The higher water content (50% w/w) in S1 systems could explain the increase in ART release, when compared to S2A, as ART is hydrophobic and tends to be released more easily to the external environment when stabilized in a hydrophilic system [17, 20, 22, 49]. S2A had 50% (w/w) concentration of surfactant and a lower water content (30% w/w) compared to S1A, which infers a tendency for the hydrophobic drug to be more stable in the LC system, thus slowing drug release [20, 33, 35, 43].
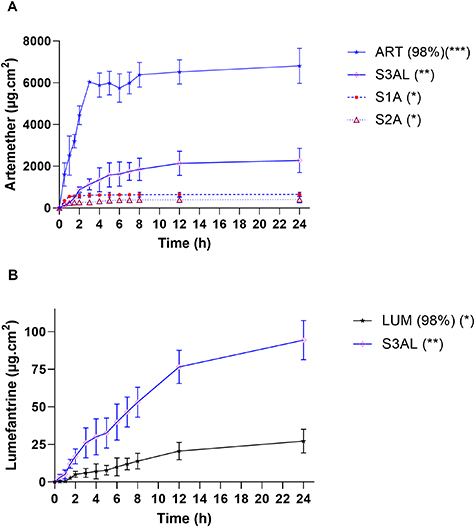
Figure 7. In vitro permeation experiments. ART–LUM permeation across dermatomed (500 μm) pig ear skin from (a) ART (98%) (ART pure drug (25 mg) dispersed in propylene glycol) and LCs: S1A, S2A (ART 25 mg/cell) and S3AL (ART-LUM 25 mg /each drug/cell) (n =6) with release profiles documented up to 24 h. *p < 0.001, **p< 0.02 and ***p< 0.05 (Turkey–Kramer test). (b) LUM (98%) (LUM pure drug (25 mg) dispersed in propylene glycol) and S3AL (ART-LUM 25 mg /each drug/cell) (n =6), with release profile documented for 24 h. *p < 0.001 and **p < 0.02 (Turkey–Kramer test).
Download figure:
Standard image High-resolution imageTable 5. Drug permeation release of ART-LUM across dermatomed (500 µm) pig skin (Mean ± SD, n = 12).
| Samples | Drug permeated (µg cm−2) 24 h |
|---|---|
| ART (98%) | 6807 ± 1596 |
| S1A (ART) | 648.5 ± 104.3 |
| S2A (ART) | 400.9 ± 153.4 |
| S3AL (ART) | 2279 ± 295.3 |
| LUM (98%) | 27.19 ± 7.903 |
| S3AL (LUM) | 94.31 ± 13.05 |
S3AL demonstrated superior skin permeation of ART compared to the other systems tested, with 2279 ± 295 μg cm−2 of ART permeated through the skin after 24 h. This system showed an ART release capacity that was 3.5 times greater compared to that of S1A. This observed difference between ART permeation from S1A and S3AL, can be explained by the incorporation of 1-methyl-2-pyrrolidone (10% w/w) S3AL. Whilst the ultimate aim of the inclusion of 1-methyl-2-pyrrolidone in the formulation of S3AL was to improve the solubility, and therefore loading, of LUM, an additional benefit is that it can act as a permeation adjuvant for both drugs [13]. An additional factor that may have played a role in the enhanced permeation capabilities displayed by S3AL, is the fact that this LC system has a cubic phase structure, which have an increased degree of packing compared to hexagonal phases systems like S1A [22, 24, 29].
Regarding the permeation of LUM from S3AL, 94 ± 31 μg cm−2 of LUM had permeated after 24 h. This value was three times higher than the release observed for LUM dispersed in propylene glycol (27 ± 7.9 μg cm−2 24 h) (figure 7(b), table 5). This result was expected due to the low release rate achieved (2.49%) in dialysis membrane studies (figure S1, table S3), which can be explained because the drug’s physic-chemical characteristics (figure 1(b)) i.e. being highly hydrophobic (aqueous solubility = 3.09 × 10−05 mg ml−1, Log P = 8.34), with a molecular weight of 528 daltons, and having three aromatic rings in its structure [52]. LUM is designed to bind to plasma proteins with a half-life between 4 and 5 days, exerting its extended activity profile by slowly eliminating residual malaria parasites from the bloodstream [8, 53]. Therefore, this result is a promising one as it demonstrates the effective delivery of this extended action antimalarial drug via a novel technology that is amenable to further release profile modifications [7, 26, 45].
Lithotropic LCs are optimal systems for the controlled release of drugs due to their capability to form lamellar, hexagonal or cubic mesophases depending on the concentration of amphiphilic surfactant, polar lipids and water present in their formulation [16, 21]. These systems exhibit a distinct variation in their phase behaviors, physicochemical structures and physicochemical properties in an aqueous environment; depending on the composition present of both lipids and surfactants. For this reason, these systems have been investigated for a variety of drug delivery applications [16, 18, 21]. Surfactant-based systems are capable of incorporating both hydrophilic and lipophilic drugs; enhancing the permeation of both by mimicking the lipid bilayer structure of mucosal membranes [16, 21, 54]. Surfactant-based systems also act to increase skin hydration by promoting increased water retention in the stratum corneum, thereby reducing trans-epidermal water loss. They also promote protection against photo and thermo degradation, providing stability to a system, whilst demonstrating sustained drug release due to the different mesophases present within a system [16, 38, 46, 54, 55].
3.8. Cell viability studies
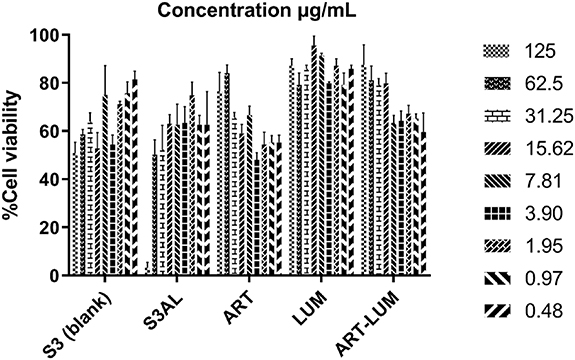
Based on the results of the in vitro permeation assays, the S3AL formulation was selected as the most promising candidate formulation, and thusly, was taken forward to be tested in terms of toxicity to HaCaT cells. Cell viability investigations were performed with samples containing S3 (blank), S3AL, ART, LUM and an ART-LUM combination (1:1 w w−1) (figure 8).
Figure 8. Cell viability using SRB color method for S3 blank, S3AL (formulation S3 containing ART-LUM), ART (artemether), LUM (lumefantrine) and ART-LUM association (1:1 w w−1) samples. (Mean ± S.E.M.; n = 3).
Download figure:
Standard image High-resolution image
The experiment was conducted according to ISO 10993-5 guidelines (2009)[47], which consisted of testing different drug/formulation concentrations, to identify the ideal concentration for transdermal application. Assay data (figure 8), demonstrated that after 24 h, 80% of human epithelial cells remained viable when dosed with S3 up to a concentration of 7.81 μg ml−1. For S3AL samples, which were composed of an LC system containing the ART-LUM combination, approximately 80% of cells remained viable at doses of 1.95 μg of formulation per ml/cell culture and lower. However, when the drugs were tested separately, they showed a reduced toxicity with 75% of cells remaining viable up to an ART concentration of 125 μg ml−1; and 98% viability observed at an LUM dose of 125 μg ml−1. Regarding the ART-LUM drug combination, approximately 88% of cells were viable after 24 h when a 125 μg ml−1 dose was administered.
It is important considering that not all compounds present in the formulation are able to penetrate the skin at the same time and concentration as those observed by in vitro studies. Thus, after penetrating the skin, the proportion 1:1 ART: LUM (w/w) used in the formulation, is not the same concentration achieved as in the in vitro permeation release studies and would not present the same cell viability level as tested directly in HaCaT cells.
Although the discrete toxicity level presented, it was not tested directly in the skin—which has different kinds of structured layers and barriers—but directly in a cell medium containing only keratinocyte human cells, which are sensitive and depend on the osmotic medium [56]. Surfactant-based systems have higher concentrations of surfactants [24, 25], which can change the cell medium equilibrium [38]. Therefore, it was necessary to consider the results of the drugs in cell culture to determine the safe concentration for human use [56].
4. Conclusion
LCs were successfully developed combining PPG-5-Ceteth-20, oleic acid, 1-methyl-2-pyrrolidone, ART and LUM. Characterization investigations revealed that the addition of LUM caused a phase transition within the LC system, from hexagonal to cubic phase, with higher viscosity and superior ex vivo skin bioadhesion observed. The LC formulation containing ART-LUM (S3AL) was shown to be safe for transdermal use at 2.5:2.5 (%, w/w). Furthermore, S3AL was identified as the most suitable formulation for the transdermal delivery of both ART and LUM. This new transdermal formulation is an alternative to conventional ART-LUM delivery via oral tablets, which may expand the number of patients receiving adequate malaria treatment to include those in the most under-developed and deprived regions of the world, where access to hospital care is simply not possible. Additionally, the need to ingest lipid-rich foods alongside conventional oral therapies is problematic due to the extensive gastrointestinal side effects caused by the disease itself. Non-invasive transdermal delivery of the same antimalarials, as reported here, removes this barrier to effective care, and may serve to improve patient compliance across multiple patient groups including; children and pregnant women [13, 48, 57]. Further in vivo characterization of this transdermal drug delivery system is required to realize its potential as a revolutionary alternative to conventional malaria treatments.
Acknowledgments
This work was funded by Fundação de Amparo à Pesquisa do Estado de São Paulo (Fapesp) grants 2014/16008-3 and 2016/18384-8, Capes and CNPq.
Data availability statement
All data that support the findings of this study are included within the article (and any supplementary files).
Conflict of interest
The authors declare no commercial or financial conflicts of interest in this work.