


Abstract
It is crucial to correctly predict the S-matrix with plasma and set the optimal impedance matching device in the ion cyclotron resonance heating (ICRH) antenna system design. In this paper, a hybrid circuit/3DLHDAP code to verify the S-matrix measurements in the presence of plasma and optimize the load-resilient conjugate-T circuit for Large Helical Device (LHD) ICRH antennas has been developed and benchmarked. The variation of S-matrices for handshake form (HAS) and field-aligned-impedance-transforming (FAIT) antenna systems with density, magnetic field and coupling distance during heating obtained by the code's simulations agrees with that of with the LHD ICRH experiments. The mutual coupling of toroidally aligned HAS antennas is larger than that of poloidally aligned FAIT antennas over a wide range of densities. When the density and coupling distance increase, under a magnetic field on the magnetic axis of 2.75 T and 1.0 T, within a certain density change range, at the minimum voltage position with vacuum injection, the change rule of the antennas' Sa_minV_11 and Sa_minV_22 with density is opposite to that with coupling distance, which means that under certain conditions, adjusting the coupling distance may make up for the S-parameters changes caused by plasma density variation, keeping the minimum voltage position fixed, and may make impedance matching easier to achieve during long-pulse operation. Based on obtaining the S parameters, conjugate-T circuits for the HAS and FAIT antennas are designed with the hybrid circuit/3DLHDAP code, which can keep the reflection coefficients low without controlling impedance matching device over a wide range of plasma parameters region. The related results in this paper may provide some guidance for the high-power long-pulse operation of the ICRH antenna system on the fusion device.
Export citation and abstract BibTeX RIS

Original content from this work may be used under the terms of the Creative Commons Attribution 4.0 license. Any further distribution of this work must maintain attribution to the author(s) and the title of the work, journal citation and DOI.
1. Introduction
Maximizing antenna coupling to plasma is one of the main challenges for high-power and long-pulse operation in both tokamaks and stellarators. Many experimental studies and simulations have been dedicated to the improvement of antenna coupling and relevant impedance matching techniques [1–7]. As is well known, coupling loading R, which is defined as the equivalent resistance terminating a transmission line with characteristic impedance Zc , is highly dependent on the edge density profile and changes rapidly (⩽ ms) under the fast-changing density resulting from phenomena such as edge localized modes (ELMs), L-H transition, and plasma start up, etc [3–5, 8, 9], which occurs too quickly to be tracked by a real-time controlled traditional matching system (e.g. a lumped capacitor and an inductance, liquid impedance matching device, whose matching time is greater than or equal to 10 ms [4]). Therefore, load resilient systems, providing an inherently voltage standing wave ratio (VSWR) less than VSWRmax (typically VSWRmax= 2:1) are hence required [3, 4].
In 2003, Monakhov proposed to use one type of conjugate-T device to improve the ion cyclotron resonance heating (ICRH) ELM tolerance on JET [10]. The conjugate-T circuit comprises two complex conjugate impedances. Simulations have demonstrated an excellent circuit tolerance to the coupling loading R perturbation. Although a low VSWR can be obtained in a large variation range, this is an ideal case that does not take into account the plasma-dependent mutual coupling between antennas. Quantitatively, coupling resistance R can only reasonably describe the coupling properties of a single antenna with plasma. A complex scattering matrix (S-matrix), in the presence of plasma, can provide a consistent description of the RF properties of a multi-strap antenna [6]. In 2018, Monakhov measured the S-matrix of 4-port ICRH antennas at JET by sweeping the relative phases of the voltages applied to straps, a comparison of TOPICA simulations of the A2 antennas with the experimental results confirms that the existing model plausibly describes the RF coupling of the antenna straps with plasma [6]. In 2019, Tierens used RAPLICASOL and TOPICA to predict the S-matrix entries and capacitor settings for the WEST ICRH antenna system [1]. Recently, the load-resilience of a conjugate-T loop consisting of two capacitors and a 3-branch node had been successfully demonstrated on plasma for WEST ICRH launchers, which agreed with simulations involving S-matrices computed on TOPICA/HFSS and RF network computations performed on SIDON [3, 5]. All these works provide the possibility to predict and verify the experimental S-matrix measurements and impedance matching setting in the presence of plasma by computer simulations.
The Large Helical Device (LHD) is a superconducting device with a R0 (major radius) of 3.9 m, an a0 (minor radius) of 0.6 m, an m (toroidal mode number of helical coil) of 10, an l (multipolarity) of 2 [11]. The LHD has used the poloidal array (PA), handshake form (HAS) and field-aligned-impedance-transforming (FAIT) antennas for ICRH [2, 12], and a world-record injected energy of 3.36 GJ in a long-pulse operation was achieved [12]. To realize the goal of high-power and long-pulse operation, the ICRH devices of the LHD were optimized by adopting a devised in-vessel impedance transformer (IVIT) and an ex-vessel impedance transformer (EVIT) [2]. Although triple liquid stub tuners have been employed for real-time impedance matching on the LHD, their adjustment speed is too slow to cope with the fast variations of ICRH antenna input impedance arising from fast plasma events (e.g. plasma start-up and pellet injection). To increase the ICRH injection power with fast coupling changes, the ICRH antenna system of the LHD is ready for the design of a load-resilient conjugate-T device to improve the situation. Therefore, ICRH experiments to measure S-matrices with hydrogen plasma were first conducted on the LHD recently. A program hybrid circuit/3DLHDAP was also developed, consisting of two parts: 3DLHDAP (three dimensional LHD antenna with plasma), and an RF circuit model to calculate the S parameters and optimize the load-resilient conjugate-T device for the LHD ICRH antenna system.
The commercial software COMSOL is capable of solving Maxwell's equations using finite elements, which makes it relatively straightforward to impose fully non-uniform plasma parameters, including arbitrary three-dimensional (3D) profiles and background magnetic fields. Although the validity and correctness of ICRH simulations based on COMSOL have been proven by some codes [1, 13–15], but few codes consider both Ohmic losses and the curvature of the 3D model to describe the interaction of the ICRH antenna and plasma. The hybrid circuit/3DLHDAP is a program based on COMSOL and RF design theory that builds the model according to the actual experimental conditions while taking into account the 3D magnetic fields, the 3D shape of the LHD device and PA, FAIT, and HAS antennas, and their Ohmic losses or power losses. Experimental measurements of the ICRH antennas' S-matrices with real plasma on the LHD provides a good opportunity to demonstrate the validity of the code.
This paper is organized as follows: in section 2, we introduce the method of ICRH antenna S-matrix measurement with real plasma on the LHD. In section 3, we introduce the models and equations of the hybrid circuit/3DLHDAP code for S-matrix simulation, and compare the theoretical calculations with experimental ones. According to the experimental measurement and simulation of hybrid circuit/3DLHDAP, section 4 shows the steps to optimize the load-resilient conjugate-T circuit for the LHD ICRH antenna system. Section 5 presents the conclusions of the study.
2. Method of antenna S-matrix measurement with real plasma
To design a conjugate-T circuit with S-matrices considering mutual coupling between antennas and change of the effective antenna position, experiments to measure the relationships between S-matrices and line-averaged electron density, magnetic field, coupling distance, namely, the distance between the plasma confined by the last closed flux surface (LCFS) and the Faraday screen, for ICRH are firstly conducted in the 24th LHD experiment campaign in 2022. ICRH power modulation with rectangular waveform (figures 1(c) and 2(a), (b), (e)) and phase scan (figures 3(c) and (f)) experiments are performed, where ICRH, ECH, and NBI are used to heat the plasma (figures 1(a)–(c)). The experiments are performed at 38.47 MHz with hydrogen, where line-averaged electron density is measured by the far infrared laser interferometer and scanned in wide range from 0.37 × 10¹⁹m−3 to approximately 6.27 × 10¹⁹ m−3 . Lvac and L are the distance between the input port of reducer attached to the directional coupler (DC) and the position of minimum voltage with vacuum injection (ICRH pulses are injected into the vacuum vessel without plasma), and the distance between the input port of reducer of DC and the position of minimum voltage during experiments. The DC has been well calibrated with vector network analyzer, thus, its error of loading resistance is within 0.1 Ω, and its error of phase is within 0.1°.

Figure 1. Temporal behavior of parameters during the LHD pulse 180297: (a) NBI power, (b) ECRH power, (c) ICRH power, (d) line-averaged electron density  , and (e) plasma stored energy WP.
Download figure:
Standard image High-resolution image
Figure 2. Temporal behavior of parameters relevant to the S-matrix measurements by power modulation: (a) forward power and reflection power of the HAS upper antenna measured by the DC, (b) forward power and reflection power of the HAS lower antenna measured by the DC, (c) position of minimum voltage change ( ) on the transmission line outside the vacuum vessel of the HAS antennas, (d) HAS coupling loading, (e) forward power and reflection power of the FAIT upper antenna measured by the DC, (f) forward power and reflection power of the FAIT lower antenna measured by the DC, (g) position of minimum voltage change (
 ) on the transmission line outside the vacuum vessel of the FAIT antennas, and (h) FAIT coupling loading.
Download figure:
Standard image High-resolution image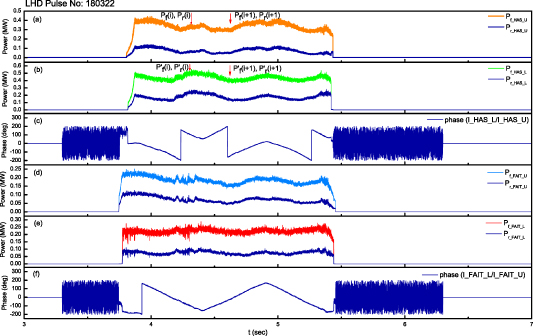
Figure 3. Temporal behavior of parameters relevant to the S-matrix measurements by phase scan: (a) forward power and reflection power of the HAS upper antenna measured by the DC, (b) forward power and reflection power of the HAS lower antenna measured by the DC, (c) phase difference between the HAS upper and lower antennas, (d) forward power and reflection power of the FAIT upper antenna measured by the DC, (e) forward power and reflection power of the FAIT lower antenna measured by the DC, and (f) phase difference between FAIT upper and lower antennas.
Download figure:
Standard image High-resolution imageThe magnetic field on the magnetic axis  is Bax
, whose direction changes from clockwise (CW) to counterclockwise (CCW). The coupling distances of the FAIT and HAS antennas are
is Bax
, whose direction changes from clockwise (CW) to counterclockwise (CCW). The coupling distances of the FAIT and HAS antennas are  and
and  , respectively. The key parameters of plasma pulses are summarized in table 1.
Table 1. Key parameters of LHD pulses with ICRH antenna power modulation and phase scan.
| Pulse number | Bax | Polarity |

|

|
|---|---|---|---|---|
| 180275–180286 | 1 T | CCW | 6 cm | 8 cm |
| 180287–180303 | 2.75 T | CCW | 6 cm | 8 cm |
| 180308–180329 | 1 T | CW | 6 cm | 8 cm |
| 180330 | 1 T | CW | 8 cm | 9 cm |
| 180333 | 1 T | CW | 10 cm | 10 cm |
| 180409–180424 | 2.75 T | CW | 6 cm | 8 cm |
| 180425 | 2.75 T | CW | 8 cm | 9 cm |
| 180427 | 2.75 T | CW | 10 cm | 10 cm |
The DC measured the upper antenna's forward power  and reflection power
  , as well as the lower antenna's forward power
  and reflection power
  at different times ti
(figures 2 and 3). Analyzing the datum at two moments ti
and ti+
1 with equations (1) and (2), we get the S-matrix Sa_DC
and impedance Za_DC
at the position of the DC
at different times ti
(figures 2 and 3). Analyzing the datum at two moments ti
and ti+
1 with equations (1) and (2), we get the S-matrix Sa_DC
and impedance Za_DC
at the position of the DC

where Zc
= 50 Ω is the characteristic impedance of the coaxial line; and Vf
(i), Vr(i), V'f
(i), V'r(i) are the incident and reflected voltages of the upper and lower antennas, respectively. The ABCD transmission matrix  at the DC can be obtained by equation (3)
The ABCD transfer matrix  at the position of minimum voltage with vacuum injection meets

with
where L1_DC = 35.176 m and L2_DC = 29.733 m are the distances between the DC and the minimum voltage position with vacuum injection for the upper antenna and the lower antenna, respectively. The impedance matrix Za_minV at the minimum voltage position with vacuum injection is
Finally, S-matrix Sa_minV at the minimum voltage position with vacuum injection can be obtained
Figures 4 and 5 show the influence of density and magnetic field on measured S-matrices at the minimum voltage position with vacuum injection for the HAS and FAIT antennas, respectively, which are similar to the Smith chart. If the angle between Sa_minV_ 11 (or Sa_minV_ 22) and the x-axis rotates CW, it shows that the minimum voltage position is shifted toward the antenna side. Conversely, if the angle rotates CCW, it means that the minimum voltage position is shifted away from antenna side. A ±180° rotation in Sa_minV_ 11 and Sa_minV_ 22 corresponds to the shift of the voltage node. The distance between the minimum voltage position and the antenna tip is an integral multiple of half the wavelength. It should be noted that the minimum voltage position simulated in the paper is the voltage node closest to the EVIT. Figures 4 and 5 provide clear evidence that when the density increases to a certain value with Bax = 2.75 T for the HAS antennas (figures 4(a) and (b)) and Bax = 1.0 T for the HAS and FAIT antennas (figures 4(c), (d) and 5(c), (d)), the minimum voltage position stops moving away from the antenna side and begins to move toward it. Furthermore, as the density increases, the minimum voltage position gradually moves away from the FAIT antenna ends for Bax = 2.75 T (figures 5(a) and (b)). At lower plasma densities, the position change of the minimum voltage is more sensitive than that at high densities (figures 4 and 5). Figures 6 and 7 show the influence of coupling distance on the measured S-matrices at the minimum voltage position with vacuum injection for the HAS and FAIT antennas, respectively. For both the HAS and FAIT antennas, with the increase of coupling distance, the position of the minimum voltage gradually moves to the antenna side. When magnetic field changes from 1 T to 2.75 T, |Sa_minV_ 11| and |Sa_minV_ 22| decrease.

Figure 4. Influence of density and magnetic field on measured S-matrices at the minimum voltage position with vacuum injection for the HAS antennas, pulse Nos: #180275–180303, #180308–180329, #180409–180424, green dots 0.37 × 10¹⁹m−3 <  < 1.6 × 10¹⁹m−3, blue dots 1.6 × 10¹⁹m−3 <
  < 3.5 × 10¹⁹m−3, black dots 3.5 × 10¹⁹m−3 <
  < 4.5 × 10¹⁹m−3, red dots 4.5 × 10¹⁹m−3 <
  < 1.0 × 10²⁰ m−3. (a) Bax
= 2.75 T, CW, (b) Bax
= 2.75 T, CCW, (c) Bax
= 1.0 T, CW, (d) Bax
= 1.0 T, CCW.
< 1.0 × 10²⁰ m−3. (a) Bax
= 2.75 T, CW, (b) Bax
= 2.75 T, CCW, (c) Bax
= 1.0 T, CW, (d) Bax
= 1.0 T, CCW.
Download figure:
Standard image High-resolution image
Figure 5. Influence of density and magnetic field on measured S-matrices at the minimum voltage position with vacuum injection for the FAIT antennas, pulse Nos: #180275–180303, #180308–180329, #180409–180424, green dots 0.37 × 10¹⁹
−3 <  < 1.6 × 10¹⁹m−3, blue dots 1.6 × 10¹⁹m−3 <
  < 3.5 × 10¹⁹m−3, black dots 3.5 × 10¹⁹m−3 <
  < 4.5 × 10¹⁹m−3, red dots 4.5 × 10¹⁹m−3 <
  < 1.0 × 10²⁰ m−3. (a) Bax
= 2.75 T, CW, (b) Bax
= 2.75 T, CCW, (c) Bax
= 1.0 T, CW, (d) Bax
= 1.0 T, CCW.
< 1.0 × 10²⁰ m−3. (a) Bax
= 2.75 T, CW, (b) Bax
= 2.75 T, CCW, (c) Bax
= 1.0 T, CW, (d) Bax
= 1.0 T, CCW.
Download figure:
Standard image High-resolution image
Figure 6. Influence of coupling distance on measured S-matrices at the minimum voltage position with vacuum injection for the HAS antennas; pulse Nos: #180322, #180330, #180333, #180420, #180425, #180427;  = 3.1–3.2 × 10¹⁹m−3; CW, coupling distance between HAS antennas and plasma: green (8 cm) < blue (9 cm) < red (10 cm), dots (Bax
= 1.0 T), crosses (Bax
= 2.75 T). (a) Sa_minV_
11, and (b) Sa_minV_
22.
= 3.1–3.2 × 10¹⁹m−3; CW, coupling distance between HAS antennas and plasma: green (8 cm) < blue (9 cm) < red (10 cm), dots (Bax
= 1.0 T), crosses (Bax
= 2.75 T). (a) Sa_minV_
11, and (b) Sa_minV_
22.
Download figure:
Standard image High-resolution image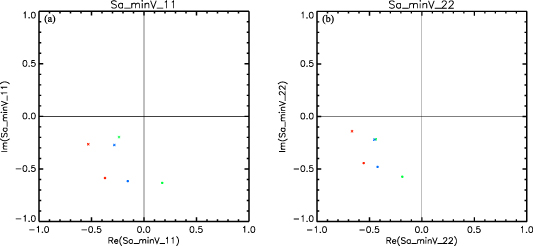
Figure 7. Influence of coupling distance on measured S-matrices at the minimum voltage position with vacuum injection for the FAIT antennas; pulse Nos: #180322, #180330, #180333, #180418, #180425, #180427,  = 3.1–3.2 × 10¹⁹m−3; CW, coupling distance between FAIT antennas and plasma: green (6 cm) < blue (8 cm) < red (10 cm), dots (Bax
= 1.0 T), crosses (Bax
= 2.75 T). (a) Sa_minV_
11, and (b) Sa_minV_
22.
= 3.1–3.2 × 10¹⁹m−3; CW, coupling distance between FAIT antennas and plasma: green (6 cm) < blue (8 cm) < red (10 cm), dots (Bax
= 1.0 T), crosses (Bax
= 2.75 T). (a) Sa_minV_
11, and (b) Sa_minV_
22.
Download figure:
Standard image High-resolution image3. Models and equations for S-matrix simulation by hybrid circuit/3DLHDAP
Complementary to the experiments on the LHD, a theoretical simulation for ICRH antenna S-matrices in the presence of plasma not only provides a unique opportunity for verification of the simulation tools, but it also makes the comparison and assessments of measured and simulated S-matrices more straightforward. Therefore, we developed a hybrid circuit/3DLHDAP code based on COMSOL to study the S-matrix when the 3D ICRH antenna interacts with the LHD plasma.
3.1. Models and equations for the interaction between ICRH antenna and plasma
The model of interaction between the 3D ICRH antenna and the LHD plasma in the hybrid circuit/3DLHDAP code is shown in figure 8(a), where R, Φ, and z are the radial, toroidal, and axial directions of the LHD, respectively. The 3D magnetic configuration is reconstructed by VMEC [16], and the magnetic field is calculated from Biot–Savart's law [17]. The 3D antenna is located between the LCFS and the wall. The amplitude and flux surfaces of magnetic field, and the projection of the antenna for the Φ = 0 cross section are shown in figure 8(b), where the magnetic radius of the magnetic axis and the strength of the magnetic field on the axis are fixed at 3.6 m and 1.0 T, respectively. The material of the LHD wall is stainless steel, and the antenna head models are from the PA, HAS, and FAIT antenna heads in the LHD [2, 12], which are mainly composed of a Faraday shield (FS), two straps, protectors, and a portion of the input transmission lines. To provide a more precise description of the behavior of the antenna, the antenna geometry is curved; the materials of the components marked in blue (side protectors), red (top protectors), gray (FS, current straps, transmission lines), and green (FS, current straps) are respectively carbon fiber composite, graphite IG-430U, stainless steel, and molybdenum (figure 9).
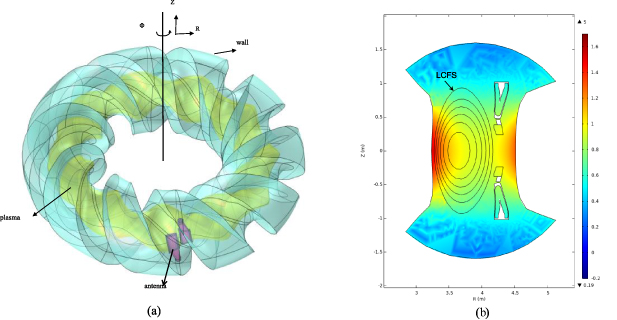
Figure 8. (a) Schematic diagram of the interaction between 3D ICRH antenna and LHD plasma. (b) Flux surfaces (contour lines) and magnetic field amplitude distribution (color gradation) for Φ = 0 cross section with Bax = 1.0 T at Rax = 3.6 m.
Download figure:
Standard image High-resolution image
Figure 9. A detailed view of the 3D ICRH antennas on the LHD. (a) PA antennas, (b) HAS antennas, and (c) FAIT antennas.
Download figure:
Standard image High-resolution imageThe radial profile of the electron density is obtained by fitting the measured results of Thomson scattering systems installed at the 3-O port (Φ = 18°) (figure 10). In the plasma region, the dielectric tensor only includes the collision effect (collision frequency  is approximately equal to
  ) and does not include the temperature effect. The cold plasma dielectric tensor
  can be obtained by rotating
  [18] from local coordinates (Stix frame) to the laboratory frame with the method introduced in [19]. Using impedance boundary conditions, the finite element method, and the S-matrices of the antenna head Sa_head
, the fields in the whole plasma-vacuum domain can be solved. Then, the total power absorbed by plasma is given by [20]
[18] from local coordinates (Stix frame) to the laboratory frame with the method introduced in [19]. Using impedance boundary conditions, the finite element method, and the S-matrices of the antenna head Sa_head
, the fields in the whole plasma-vacuum domain can be solved. Then, the total power absorbed by plasma is given by [20]

Figure 10. Radial profiles of the electron density (poloidal plane at Φ = 18°). Square black block: experimental values measured with Thomson scattering systems; red line: fitting function according to the measured results.
Download figure:
Standard image High-resolution imagewhere  ,
,  , and
Ep
are vacuum permittivity, the dielectric tensor, and the wave electric field in the plasma, respectively. The antenna radiation energy is [21]
, and
Ep
are vacuum permittivity, the dielectric tensor, and the wave electric field in the plasma, respectively. The antenna radiation energy is [21]
where S denotes the surface of the current straps, and Jan is the antenna surface current density. Heating efficiency is defined as [22]
3.2. Models and equations for S-matrix simulation
The FAIT and HAS antennas are mainly composed of an antenna head, an IVIT, a feedthrough, and an EVIT. Figure 11 shows a schematic view of the upper and lower FAIT antennas. The distances between the EVIT and the minimum voltage position with vacuum injection for the upper antenna (point A) and the lower antenna (point B) are respectively L1_V and L2_V , respectively. The upper and lower antennas can be modeled as a two-port network consisting of a cascade of an EVIT, a feedthrough, an IVIT, an antenna head, and ports 1 and 2 at points A and B, respectively. The ICRH antenna head's Sa_head is obtained by hybrid circuit/3DLHDAP (section 3.1), and the S parameters of the EVIT, feedthrough, and IVIT are calculated by the high frequency structural simulator (HFSS) [23]. Using equation (11), the S parameters of each part are combined one after another in sequence to get the antennas S parameters Sa_minV at the minimum voltage position with vacuum injection, starting from point A and ending with the point B

Figure 11. Schematic diagram of upper and lower FAIT antennas.
Download figure:
Standard image High-resolution imagewith
3.3. Benchmarking of the code hybrid circuit/3DLHDAP
We benchmark our code with the experiment results of the LHD. In the ICRH, resonance ions are accelerated in a direction perpendicular to a magnetic field; then, ions with a larger perpendicular velocity slow down through the Coulomb collision with low-temperature background electrons and non-resonant ions [24]. As PA antennas have a poloidal array, the peak  mainly locates near zero, direct electron heating by Landau damping and transit time damping is very small, and absorption occurs mainly through ion cyclotron resonances. Therefore, our collision model can approximately simulate the minority ion heating efficiency of PA antennas. Figure 12 shows the experimental [22] and simulation results for the heating efficiency of PA antennas without an FS at different current phases. The heating efficiencies of the experiments results were estimated from the power modulation experiment. Although the modulation amplitude of the stored energy has been used to derive the heating efficiency with a simple model [25], absolute errors may occur. However, trends with respect to phase can be clearly observed. The tendency of the simulation is consistent with the experimental results, which verifies the reasonableness and correctness of the code. The difference of absolute values between the experiment and the simulation may be due to the artificial collisional damping implemented in the simulation instead of real minority ion heating. Next, we use this code to calculate the S parameters of the FAIT and HAS antennas and compared them with experimental ones.

Figure 12. The relationship between PA antennas heating efficiency and current phases for Bax
= 2.75 T, CW,  = 1–1.3 × 10¹⁹ m−3, minority ratio 0.2–0.25 [22]. Experimental results (green diamond) and simulation (red hexagon) results are shown.
Download figure:
Standard image High-resolution image3.4. S-matrix simulation for FAIT and HAS antennas with hybrid circuit/3DLHDAP
Figures 13–15 respectively show the simulated S parameters at the minimum voltage position with vacuum injection for the HAS and FAIT antennas heating the plasma under different densities, magnetic fields, and coupling distances. The simulated trends are agree with the experimental measurement results (figures 4–7). And the simulation results confirm these facts. When Bax is 2.75 T for the HAS antennas (figures 13(a) and (b)) and 1 T for the HAS and the FAIT antennas (figures 13(c), (d) and 14(c), (d)), there is indeed a turning point with a threshold density, where the Sa_minV_ 11 and Sa_minV_ 22 turn CCW to CW, and |Sa_minV_ 11| and |Sa_minV_ 22| increase. Reversing the magnetic field direction makes the mutual coupling Sa_minV_ 12 and Sa_minV_ 21 exchange (e.g. figures 13(a) and (b)). The mutual coupling is sensitive to low density, changing significant fluctuation with it. The measurement results of the experiments also confirmed that the impact of density on mutual coupling was greater at low densities (green dots in figures 4 and 5) than at high densities (red dots in figures 4 and 5).

Figure 13. Simulated S parameters at the minimum voltage position with vacuum injection for HAS antennas heating the plasma under different densities and magnetic fields, green dots 0.37 × 10¹⁹m−3 <  < 1.6 × 10¹⁹m−3, blue dots 1.6 × 10¹⁹m−3 <
  < 3.5 × 10¹⁹m−3, black dots 3.5 × 10¹⁹m−3 <
  < 4.5 × 10¹⁹m−3, red dots 4.5 × 10¹⁹m−3 <
  < 1.0 × 10²⁰ m−3. (a) Bax
= 2.75 T, CW. (b) Bax
= 2.75 T, CCW. (c) Bax
= 1.0 T, CW. (d) Bax
= 1.0 T, CCW.
< 1.0 × 10²⁰ m−3. (a) Bax
= 2.75 T, CW. (b) Bax
= 2.75 T, CCW. (c) Bax
= 1.0 T, CW. (d) Bax
= 1.0 T, CCW.
Download figure:
Standard image High-resolution image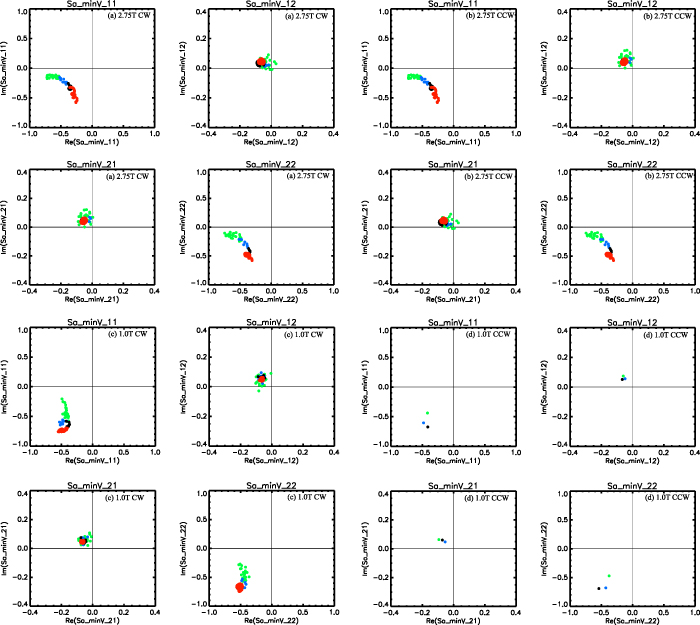
Figure 14. Simulated S parameters at the minimum voltage position with vacuum injection for FAIT antennas heating the plasma under different densities and magnetic fields, green dots 0.37 × 10¹⁹ m−3 <  < 1.6 × 10¹⁹m−3, blue dots 1.6 × 10¹⁹m−3 <
  < 3.5 × 10¹⁹m−3, black dots 3.5 × 10¹⁹m−3 <
  < 4.5 × 10¹⁹m−3, red dots 4.5 × 10¹⁹m−3 <
  < 1.0 × 10²⁰ m−3. (a) Bax
= 2.75 T, CW. (b) Bax
= 2.75 T, CCW. (c) Bax
= 1.0 T, CW. (d) Bax
= 1.0 T, CCW.
< 1.0 × 10²⁰ m−3. (a) Bax
= 2.75 T, CW. (b) Bax
= 2.75 T, CCW. (c) Bax
= 1.0 T, CW. (d) Bax
= 1.0 T, CCW.
Download figure:
Standard image High-resolution image
Figure 15. Simulated Sa_minV_
11 parameters at the minimum voltage position with vacuum injection under different coupling distances;  = 3.1–3.2 × 10¹⁹ m–3, CW, dots (Bax
= 1.0 T), crosses (Bax
= 2.75 T). (a) Coupling distance between HAS antennas and plasma: green (8 cm) < blue (9 cm) < red (10 cm). (b) Coupling distance between FAIT antennas and plasma: green (6 cm) < blue (8 cm) < red (10 cm).
= 3.1–3.2 × 10¹⁹ m–3, CW, dots (Bax
= 1.0 T), crosses (Bax
= 2.75 T). (a) Coupling distance between HAS antennas and plasma: green (8 cm) < blue (9 cm) < red (10 cm). (b) Coupling distance between FAIT antennas and plasma: green (6 cm) < blue (8 cm) < red (10 cm).
Download figure:
Standard image High-resolution imageFigure 16 shows the simulated mutual coupling |Sa_minV_
12|2 for the FAIT and HAS antennas under the same conditions, with  = 0.4–10 × 1019m–3, Bax
= 1.0 T, and CW. The mutual coupling between the upper antenna and the lower antenna of the HAS is greater than that of the FAIT antennas over a wide density range. This difference is due to the different placements of the FAIT and HAS antennas: the FAIT antennas are poloidally aligned [12], whereas the HAS antennas are placed in the toroidal direction [26]; the former is preferable for the weak mutual coupling between two antennas [27]. Therefore, the impedance matching can be easily done over wide parameters changes for the FAIT antennas.
= 0.4–10 × 1019m–3, Bax
= 1.0 T, and CW. The mutual coupling between the upper antenna and the lower antenna of the HAS is greater than that of the FAIT antennas over a wide density range. This difference is due to the different placements of the FAIT and HAS antennas: the FAIT antennas are poloidally aligned [12], whereas the HAS antennas are placed in the toroidal direction [26]; the former is preferable for the weak mutual coupling between two antennas [27]. Therefore, the impedance matching can be easily done over wide parameters changes for the FAIT antennas.

Figure 16. Simulated |Sa_minV
_12|2 for FAIT and HAS antennas under the same conditions;  = 0.4–10 × 1019m−3, Bax
= 1.0 T, CW.
= 0.4–10 × 1019m−3, Bax
= 1.0 T, CW.
Download figure:
Standard image High-resolution image4. Optimization of conjugate-T for ICRH antenna system in LHD with hybrid circuit/3DLHDAP
Figure 17 shows a schematic diagram of the ICRH antenna system. A and B are the minimum voltage points of the upper and lower antennas, respectively (shown in figure 11), and T is the connection point between the transmission line |TC| and the conjugate-T circuit. The lengths of the two legs of the conjugate-T are |AT| = L1 and |BT| = L2, respectively, which can be determined by equation (12) if two Sa_minV values are obtained experimentally. We choose two S parameters, Sa_minV 1 and Sa_minV 2 from all measured S parameters. Impedance matching at point D is assumed to be performed at the S-matrix Sa_minV 1 and Sa_minV 2. To keep the reflected power zero even if the plasma condition changes, the following conjugate-T condition must be satisfied [28]


Figure 17. Schematic diagram of the ICRH antenna system.
Download figure:
Standard image High-resolution imagewhere Y is the admittance at position T.
The impedance at the minimum voltage position on line |TC| in vacuum injection is Rm when the reflection coefficient is zero, and Z is the impedance at the same position when Sa_minV is changed. Then, assuming that the condition of matching device is the same in figure 17, the reflection coefficient |Vr /Vf | at position D is [28]
According to the rule of S-matrices obtained in experiments and simulations, we know that the Sa_minV_ 11 parameters at low density and high density are located near the lines imaginary part of Sa_minV_ 11 equals to zero and real part Sa_minV_ 11 is zero in the third quadrant of figure 18, respectively. To keep the reflection low with the designed conjugate-T device, we choose one S parameter, Sa_minV 1, at low density, and another, Sa_minV 2, at high density, and attempt to ensure that most measured S parameters exist between them. By solving equation (12), several sets of solutions can be obtained. To obtain high heating efficiency in minority ion heating, we choose a solution that ensures the current phase difference between the two points A and B of the conjugate-T circuit (figure 17) close to 180° to excite a large parallel wave number for the HAS antennas. As any current phase can achieve a high heating efficiency for FAIT antennas, a solution with the lowest reflection coefficient among the several solutions is chosen. For example, if we choose Sa_minV 1 and Sa_minV 2 respectively at positions 1 and 2 for the HAS antennas (figure 18(a)) and FAIT antennas (figure 18(b)), conjugate-T device's optimal lengths—L1_HAS = 4.047 m, L2_HAS = 4.660 m for the HAS antennas and L1_FAIT = 1.236 m, L2_FAIT = 4.074 m for the FAIT antennas—can be respectively obtained with the equation (12) to get a low reflection coefficient over a wide parameters range. If we select Sa_minV 1 and Sa_minV 2 at positions 1' and 2', respectively, for the FAIT antennas (figure 18(b)), only a small number of S-parameters are located between these two S-parameters, and the lengths of the conjugate-T circuit are L'1_FAIT = 3.880 m, L'2_FAIT = 1.780 m, respectively, as determined by equation (12). This type of conjugate-T device makes the reflection coefficient even higher than the previous one over a wide range of parameters (figure 19). Therefore, we should choose Sa_minV 1 and Sa_minV 2 carefully to obtain the optimized conjugate-T system.

Figure 18. All measured Sa_minV_11 values of (a) HAS antennas and (b) FAIT antennas.
Download figure:
Standard image High-resolution image
Figure 19. The relationship between reflection coefficient and line average density  for the FAIT antennas system.
Download figure:
Standard image High-resolution imageTo illustrate the optimized conjugate-T's performance over a wide range of plasma parameters, the reflection coefficient |Γ| of the antenna system with and without the conjugate-T is shown in figure 20. Without the conjugate-T, the upper or lower antenna system can only make the reflection coefficient very low near the matching point (point 2 for HAS antennas (figure 20(a)) and point 1 for FAIT antennas (figure 20(b)). With the optimally designed conjugate-T, the antennas system can maintain low reflection coefficients (less than 0.4) over a wide range of parameters without a controlling impedance matching device.

Figure 20. The relationship between reflection coefficient and line average density  for the HAS antennas system (a) and the FAIT antennas system (b): black cubes (antennas with conjugate-T), red dots (upper antenna without conjugate-T), and blue triangles (lower antenna without conjugate-T).
Download figure:
Standard image High-resolution image
5. Conclusion
ICRH heating experiments and simulations to design the load resilient conjugate-T system for the LHD have been carried out in this paper. ICRH power modulation and phase scan to measure S-matrices with real hydrogen plasma were firstly conducted on the LHD, and the change rules of S-matrices for HAS and FAIT antenna systems with density, magnetic field, and coupling distance during heating experiments were discussed in section 2. To further confirm the rules of S-matrices observed in experiments, a hybrid circuit/3DLHDAP code to predict the S-matrices in the presence of LHD plasma with PA, FAIT, and HAS antennas heating the plasma has been developed and benchmarked.
The geometries of the model in hybrid circuit/3DLHDAP are built according to the actual size of the LHD device and PA, FAIT, and HAS antennas, which takes into account their curvature and Ohmic losses or power losses of them. The 3D magnetic configuration is reconstructed by VMEC, magnetic field is calculated from Biot–Savart's law, and a cold plasma model including the collision effect is adopted. The FAIT and HAS antennas' IVIT, feedthrough, and EVIT are separately calculated by HFSS, and then held them together with 3DLHDAP in RF circuit modeling. This hybrid circuit/3DLHDAP combines ICRH antennas' impedance matching, coupling, and power deposition process, and can predict port S-matrices, port reflection coefficients, the electric currents on conductors, electric fields distribution in plasma, power coupled to plasma, and optimal matching settings, which are very important to evaluate and predict the ICRH system performance.
In this paper, we mainly use hybrid circuit/3DLHDAP to simulate S-matrices for the ICRH antenna system. The variation of S-matrices for HAS and FAIT antenna systems with density, magnetic field, and coupling distance during heating obtained by the calculations with the code hybrid circuit/3DLHDAP is in agreement with the experiment results (section 3). Both theoretical simulations and experimental measurements show that when the magnetic field on the magnetic axis equals to 2.75 T and 1.0 T, the rotation direction of the Sa_minV_ 11 and Sa_minV_ 22 for the FAIT and HAS antennas with increasing density (within a certain range) is opposite to that with increasing coupling distance, which implies that under certain conditions, controlling the coupling distance may compensate for the S-parameters changes caused by plasma density variation, and keep the minimum voltage position unchanged. In the LHD, the effective length is defined as the distance between the stub tuner closest to the antenna and the minimum voltage position [29], which was found to be increased during long-pulse ICRH operation [30]. By adjusting the coupling distance, it is possible to fix the effective length, and may make it easier for the ICRH antenna system to obtain impedance matching during long-pulse operation. The simulations also suggest that under the same conditions, the mutual coupling between the upper antenna and lower antenna of the HAS is greater than that of the FAIT antennas over a wide range of densities, which proves that the relative position between the straps has a great influence on the mutual coupling.
According to the rule of S-matrices obtained in experiments and simulations, we respectively optimize the HAS and FAIT antennas' conjugate-T system by the code hybrid circuit/3DLHDAP. The simulation shows that by using the optimized conjugate-T, reflection coefficients can be kept low without a controlling impedance matching device for both HAS and FAIT antennas over a wide range of plasma parameters. The hybrid circuit/3DLHDAP's ability to correctly predict the S-matrix in the presence of plasma and set the optimal impedance matching network is crucial in the antenna design phase, and the related results provide good confidence for future high-power long-pulse operation of the fusion devices' ICRH antenna system.
Acknowledgments
The authors gratefully acknowledge Dr Kamio S. providing original experiment datum of figure 12, and thank the LHD experiment group members and technical staff members for their contributions to this work. This work is supported by National magnetic confinement fusion energy development research project (2022YFE03070003), Key projects of Hunan Provincial Department of Education (20A432), Government Sponsored Study Abroad Program of Chinese Scholarship Council (202108430056), Natural Science Foundation of Hunan Province (2020JJ4515), National magnetic confinement fusion energy development research project (2019YFE03070000), the LHD budget ULRR703 from National Institute Fusion Science. The LHD data can be accessed from the LHD data repository at www-lhd.nifs.ac.jp/pub/Repository_en.html.