


Abstract
On the FTU tokamak, the collective Thomson scattering (CTS) diagnostic was renewed for investigating the possible excitation of parametric decay instabilities (PDI) by electron cyclotron (EC) or CTS probe beams in presence of magnetic islands and measure their effects on the EC power absorption.
The experiments were performed launching a gyroton probe beam (140 GHz, 400 kW) and observing the scattered radiation in symmetric and asymmetric directions (with respect to the equatorial plane) in different conditions of plasma density and magnetic field (with or without the EC resonance in the plasma), and with magnetic islands generated by Neon injection. The acquisition with a fast digitizer allowed observing spectral features with very high time and frequency resolution. Shots were performed at 7.2 T, with the fundamental EC resonance out of the plasma region, at 4.7 T, with the resonance on the high field side of the plasma column, and at 3.6 T, in this last case with the plasma between the first and the second EC harmonics both lying outside the plasma volume. Several types of spectral features characterized by their frequency and their fast time evolution were identified in the observed signal after a proper treatment. The paper reports the observations in the different experimental cases and the correlation of the features with the existence of MHD modes as witnessed by magnetic probes signals and with macroscopic plasma parameters.
Export citation and abstract BibTeX RIS
This article was updated on 23 August 2021 to correct the copyright line.
1. Introduction
The collective Thomson scattering (CTS) diagnostic on the FTU tokamak, originally designed to infer the thermal ions distribution function [1], was recently renewed [2, 3] for investigations on the possible excitation of low power threshold Parametric Decay Instabilities (PDI, see [4]) by ECRH beams in presence of magnetic islands, and study their possible effects on the absorption of powerful microwave beams used for electron cyclotron (EC) heating and Current Drive. The subject is gaining importance due to the large use of powerful EC sources for the Heating and Current Drive in present tokamaks (ASDEX Upgrade, JT60-U, DIII-D TCV, FTU and others), stellarators (W7-X, TJ-II) and in future devices (ITER, DEMO), where the well-controllable and precise EC power deposition is crucial for stabilization of Neoclassical Tearing Modes and for other tasks. Especially after evidence of anomalous scattering of injected waves from measurements with the CTS diagnostic at TEXTOR tokamak [5, 6], the power thresholds for PDI occurrence were reconsidered, finding non-linear mechanisms [7] lowering the thresholds below the power available in present EC beams. These are linked to particular conditions of density (local maxima as found in large magnetic islands) and wave injection and polarization (2nd harmonic X-mode launched from the low-field side) that may occur in present experiments and may involve a non-negligible fraction of the power in the launched beam. The importance of the verification of the presence of analogous phenomena in the FTU tokamak lies in the fact that the experimental conditions of the launch in FTU polarization (1st harmonic O-mode launched from the low-field side) are more similar to the ones occurring in the larger devices. The description of the experimental evidences found in measurements with the CTS diagnostics adds elements to the study of the occurrence and the impact that 'anomalous' phenomena may have in the EC wave injection.
Experiments were performed with the same gyrotron probe (140 GHz, 400 kW) used for EC heating on FTU, launched and received from the equatorial FTU EC launcher [8, 9] in different geometrical configurations of probe launch and receiving directions, plasma densities and magnetic fields (with or without the EC first and second harmonic resonances in the plasma), and with or without Neon induced magnetic islands, mainly identified as tearing modes at q = 2 position. The dynamic of magnetic islands, with rotation frequencies of several kHz, required the use of an intermediate frequency analyzer different from the old 32 channels filter bank, which has a time-resolution limited to around 1 ms. A fast digitizer with acquisition frequency up to 12.5 GS s−1 was connected in parallel to the old radiometer back-end, allowing the observation of new spectral features with very high time and frequency resolution [10]. The new diagnostic capabilities, the experimental setup and the experiments performed searching new evidences in the CTS spectra are detailed in the next sections, together with the work performed to interpret the results.
2. The CTS diagnostic on FTU
The investigation on fast phenomena started in 2014, with a single receiving line, without polarization selection and with a single front-end receiving section including attenuators, one 10 kHz modulator, and a notch filter. Signal is combined on a mixer with the output of a high-frequency tunable local oscillator (LO), operating at around 140 GHz and stabilized in frequency with a phase-locked loop driven by a synthesizer. The intermediate-frequency (IF) section output covered a ±1.2 GHz bandwidth around the LO frequency, limited by the amplifiers in the original configuration. The output was directed to the conventional 32-channels radiometer, based on analog filter banks within the ±1.2 GHz bandwidth, using 10 kHz modulation (chopping) at input and synchronous demodulation plus 1 kHz filtering for improving signal-to-noise ratio. In parallel, the new digitizer was connected directly to the IF section and used to monitor selected time intervals, obtaining spectra by direct Fourier transform (FT) of the acquired IF signal.
Several improvements were implemented to enhance diagnostic capabilities. First, the polarization selection of the received signal was enabled, using two corrugated mirrors inserted into the last section of the quasi-optical receiving line. The installation of a second radiometer, similar to the first one, implemented an additional radiometric channel, connected to the receiving line in parallel with the first by means of a beam-splitting wire-grid, in order to feed the radiometers with the two orthogonal polarizations. As a third improvement, the bandwidth of the IF sections of both radiometers has been extended to ±4.2 GHz around the LO frequency, substituting the amplifiers of the two front-ends. Furthermore, a second notch filter has been added on one of the two receivers, to improve the protection of mixer by the gyrotron stray radiation.
Further improvements are ongoing: a second separate receiving line, to allow direct comparison of signals with the ones acquired with the first line (as in ASDEX Upgrade [11]), is being designed. The receiving antenna, based on the remote steering (RS) concept, consists of a corrugated waveguide with square section and of proper length. The antenna has been built and mounted on the equatorial plane of the same FTU port used for EC and CTS antennas. Details of the improvements can be found in [12].
3. Experimental setup
The experiments were performed with probe and receiving beams in symmetric and asymmetric configurations with respect to the FTU equatorial plane, using the two symmetric antennas of the EC new launcher. Normally the launcher is operating with probe mirror in fixed position with a toroidal angle β (typically around 5°, in order to avoid direct reflection of the probe by the vessel wall) and receiving mirror sweeping toroidally during the pulse, the scan covering an angle of few degrees around the expected angle for CTS overlapping beams, in order to find evidence of the actual beam crossing in the signals. The beam paths are computed with the EC beam-tracing code GRAY [13].
In figure 1 (from left to right) the poloidal projections of the probe and the receiving beams in the typical symmetric (7.2 T magnetic field, with crossing in the plasma magnetic axis and 4.7 T, with crossing on the q = 2 magnetic surface) and asymmetric (4.7 T, with crossing on the EC resonance and the q = 2 surface at the same time) are shown. All these configurations have been tested, typically in different plasma density conditions, with and without the presence of the m:n = 2:1 magnetic islands. The main difference between the configurations is alternatively the presence, the absence and the position of the EC resonance with respect to the beam-crossing (scattering) volume: in the case of 7.2 T the first harmonic EC resonance is outside the plasma on the LFS, at R = 1.35 m, not interacting with the probe beam (unless in case of plasma formation in the port itself). In the 4.7 T symmetric case the resonance acts only as a dump of the probe radiation after multiple reflections, since the absorption at the first passage is very low (estimated of the order of 3%), reducing the level of stray power disturbing the measurements. In this case the resonance is optically thin, and the gyrotron power reflects on the high field side wall, as well as the receiver collects signals reflected in the vessel. The 4.7 T asymmetric case has been studied in order to investigate the simultaneous effect of the injection of EC power on the resonance (absorption at first passage ~60%) and the magnetic island, as is expected when EC power is used to stabilize NTM modes, like in recent experiments [14] and as foreseen in ITER [15] and DEMO [16].
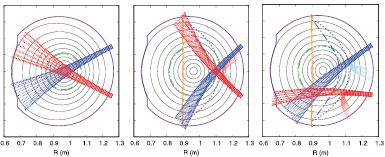
Figure 1. Poloidal projections of O-mode polarized beams launched (red) and received (blue) in three cases: B0 = 7.2 T, crossing at the plasma magnetic axis (left). B0 = 4.7 T, crossing at the q = 2 surface on the LFS of the plasma mid-plane (center) and crossing at the lower intersection between the q = 2 rational surface and the cold first harmonic EC resonance (right). The q = 2 rational surface is in green, the fundamental EC resonances in orange (solid = cold, dashed = Doppler-shifted), the Upper Hybrid layer and X-mode Right cut-off in blue (dash-dot, dotted respectively). The path of the X-mode polarized component of the two beams (reflected by the cutoff) is shown with lighter colours.
Download figure:
Standard image High-resolution image4. Plasma conditions and experimental results
While in 2014 shots could be carried out at both the magnetic fields of 7.2 T and 4.7 T, in the two following years the high field of 7.2 T could not be obtained. To realize a plasma scenario with both first and second harmonics EC resonances out of the plasma volume, shots at 3.6 T have been performed, with the first EC harmonic of the probe frequency on the high field side of the torus and the second EC harmonic on the low field side.
The experiments were performed at the different magnetic fields in similar plasma conditions, with plasma density ne variable in the range 0.4–1.2 * 1020 m−3, plasma current variable from 350 to 700 kA, without additional heating (apart from the probe, when the resonance was into the plasma) and usually with similar conditions in terms of safety factor at the edge (qedge ~ 3.5), in order to locate the q = 2 surface at the same position.
The presence of magnetic islands has been induced with the injection of a small quantity of Ne gas, leading to a grow of a m:n = 2:1 island, and finally to a plasma disruption.
In case of Ne injection, the probe (140 GHz, 350 kW) was usually turned on when the Ne gas was already penetrated, not to prevent the island generation, and the radiometer protection blinding gate interval set to 50 ms, at whose end the digitizer acquisition of typically 100 ms was triggered.
The use of the fast digitizer showed the presence of very fast signals in the spectra, with characteristic times of the order of microseconds, that could not be resolved in time with the filter bank radiometer. For the interpretation of the spectra it is useful to recall that the heterodyne detector does not allow to distinguish the upper and lower bands with respect to the LO frequency, so that the two bands appear superimposed in the acquired spectrograms, and that the LO frequency is typically centered on the probe frequency, so that this last turns out to correspond to the same horizontal axis hidden by the notch filter cut-off frequency band. Moreover, the input signal is chopped at 10 kHz for operating the background signal rejection on the radiometer, which is averaged then on the ms time scale. This chopping allows distinguishing in the FT spectra the disturbances in the receiving chain from signals originating from the line. In the present setup it is not possible to distinguish spectral effects due to gyrotron sidebands received from the stray component and not filtered by the notch. This will be further investigated when the second receiving line will be implemented.
A strong effort was devoted to the spectral calibration, performed normalizing for the spectrum received in shots with ohmic heating (without probe) and with the EC fundamental resonance of the LO frequency in the vessel. In these conditions the emission is expected to reproduce the plasma electron temperature (known since measured with the ECE diagnostic) at the intersection of the observing direction and the resonant surface. The features observed are usually found at the keV temperature scales, well above the ECE background level.
While the study on the correlation of the emissions found in the spectra with the magnetic island is still ongoing (since the complete set of planned plasma configurations has not been obtained yet), a collection of spectral features is here presented, mostly detectable only by accurately choosing both time and frequency resolutions for calculating the FT.
The spatial location where the spectral features originate is not still clear. The attempt to locate them in the scattering volume by sweeping the received beam across the probe beam is not conclusive, since a clear variation of the amplitude or of other characteristics with the overlapping of the two beams is not found.
In the following sections some spectral evidences are presented, not clearly correlated to magnetic islands and still without a definite classification. In fact, in most of the shots with magnetic islands detectable by magnetic probes, no emission disturbing the spectra and having a time behavior consistent with the rotation of the magnetic island has been found.
In the FTU plasma conditions obtained in experiments presented in this work, differently from what was found formerly [17], there is no clear evidence of non-monotonic density profiles in the plasma. In particular, we could not detect significant evidence of oscillations in the signals of the interferometer (used to measure the plasma density) on the line of sight intersecting the island. Actually, some evidences of such oscillations could be rarely measured as in [17] or (in more central radial positions) during transient phases pellet injection. A non-trivial criticality is that the interferometric technique requires the Abel inversion of the integrated line density measured along the radius, and this technique is capable to provide reliable (inverted) profiles only in case of poloidally symmetric distributions, which is not the case when a large tearing mode is present.
4.1. Variable-frequency line emissions
Sequences of faint lines in a range 0.5–1.1 GHz from the gyrotron frequency have been observed in the shots performed at 7.2 T, with the geometry shown in figure 1, left and with the fundamental EC resonance outside the plasma (figure 2, left), receiving in X polarization. When examined in detail, on a time scale strongly expanded, their extremely fast temporal evolution can sometimes be appreciated. In shot #38476, at the time shown in figure 2, right, the frequency difference with the probe tends to vary, increasing from 0.5 to 1.1 GHz in a few (2–5) microseconds, while in other time intervals of the same shot the time behaviour, if any, is so fast that cannot be appreciated.
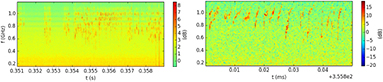
Figure 2. Spectrum of the received radiation close to the gyrotron frequency for shot #38476 (scale in GHz, spectral amplitudes in dB, uncalibrated). Left: Fast emissions are visible in a frequency range between 0.5 and 1.1 GHz. Right: When resolved in microsecond time scale, measured starting from 355.8 ms, emissions appear as a sequence of faint lines emitted with a very fast temporal evolution.
Download figure:
Standard image High-resolution imageSimilar features were observed in shots at B0 = 4.7 T, whose spectra are shown in section 4.3, with the LO frequency shifted 800 MHz below the probe frequency, in order to distinguish the emissions on the lower frequency side from the ones at higher frequencies. They are seen as emission bands visible at the bottom of the spectrum in figure 4, thus at frequencies lower than the probe, and expanded in figure 5, left. These emissions, analyzed with a fine time-scale (figure 5, right) are very similar to the ones found in the shot of figure 2, even though this time a higher noise level (due to higher stray power) make their behaviour less defined.
If these two observations are associated to the same phenomenon, also the lines shown in figure 2 are then most probably emitted at a frequency below the probe frequency, fact that is an indication, but not still conclusive for the correlation of the phenomenon to a type of PDI decay.
4.2. Bursts emissions of continua
At 4.7 T, with the resonance on the high field side of the plasma column, a continuous (in frequency) emission is sometimes observed in shots that do not present m:n = 2:1 and 3:2 tearing modes (at least, at a level detectable with the probes). Such emission, which cannot be resolved in spectral lines, appeared suddenly and disappeared after few milliseconds. In figure 3, left, the spectrum is shown for shot #39003, obtained in symmetric configuration (figure 1, center). It turns out to be composed temporally by 'bursts' with a time scale of microseconds and asynchronous repetitions, with a finer temporal structure (figure 3, right). We can exclude interferences with spurious signals at a few GHz (entering in the IF section of the diagnostic) since the features are observed only when the 10 kHz modulator (chopper) on the high-frequency side is open. So, they are detected around the gyrotron frequency, where interferences from the environmental sources are not expected. It is to be investigated further if they can be explained as spurious gyrotron emissions, or burst plasma formation outside the plasma column but close to the resonance (at the top and bottom of the vessel) or by other phenomena. This emission in the CTS spectra, similar to the ones observed at TEXTOR for low density [6], was anyway correlated in time with magnetic probe signal at each corresponding spectral frequency, showing a correlation at low level, possibly due to components at frequencies typically higher than the island rotation frequency, differently from what is observed in [6].

Figure 3. Left: Spectrum of the received radiation close to the gyrotron frequency for shot #39003 (the Y scale represents the frequency relative to the LO frequency, in this case coincident with the gyrotron frequency), while the colour scale represent the spectral amplitudes in dB, uncalibrated. An asynchronous sequence of bursts with broader continuum spectrum is detected up to 1 GHz from the gyrotron frequency. Right: Expanding the time scale around t = 830.46 ms. there is no clear evidence of emissions in spectral lines as instead in the case of figure 2.
Download figure:
Standard image High-resolution image4.3. Lines at the deuteron cyclotron frequency
In the 2015 FTU campaign the experiments were performed at nominal toroidal magnetic field of 4.7 T and 3.6 T, respectively with the fundamental resonance in the plasma and with the plasma between the first and the second harmonic EC resonances. For easing the interpretation of the emissions, the LO frequency was significantly down-shifted, to visualize the gyrotron (probe) frequency 0.8 GHz far away from the LO frequency and the IF amplifier stop band (0–50 MHz). This allows to better distinguish emissions lying above and below the probe frequency. In this condition the gyrotron line due to the stray radiation not fully absorbed by the notch filter is well visible in the spectrogram. Different types of spectral features with a fast evolution were observed. In particular, two of them are presently under deeper investigation: the first one consists of a rapid asynchronous sequence of bursts detected at frequency multiples of the (deuterium) ion cyclotron frequency for a magnetic field B = 5 T, appearing above and below the gyrotron frequency and occurring in connection with an MHD activity which leads to plasma disruption (figure 4), found either in symmetric and asymmetric configurations (cases respectively shown in figure 1 center and right).
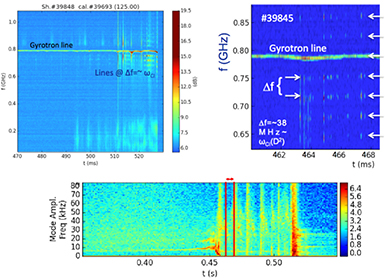
Figure 4. Top left: Spectrum (in dB, uncalibrated) of the received radiation in shot #39848 (B0 = 4.7 T, asymmetric case): the gyrotron line (highly attenuated) is visible 800 MHz away from the LO frequency, at 139.48 GHz. Top right: sequence of bursts emitted at frequency multiple of the deuteron ion cyclotron frequency, above and below the gyrotron line (shot #39845, symmetric case). Bottom: MHD spectrogram of shot #39845, showing an intense activity before and after the time interval (marked by red vertical lines) of the top right figure: the colour scale is logarihtmic, in arbitrary units.
Download figure:
Standard image High-resolution imageThe emissions visible in figure 4 (top: left, asymmetric case; right, symmetric case) seem to be linked to the MHD regime due to the effects of the Neon injection which is exploited to stimulate the m:n = 2:1 magnetic island growth at the q = 2 surface, typically triggering during the shot a strong activity associated with a particularly narrow plasma size and non-monotonic density (or temperature) profiles. The analysis of these regimes is complex, as the correlation of the timing of the bursts with the position (or sometimes even the existence) of significant perturbations of the magnetic equilibrium. For these reasons, even though the multiplicity and the frequency gap between the lines may be highly indicative of PDI process, an accurate interpretation of the phenomena occurring in these shots is not yet concluded and thus not presented in this work.
From the spectra shown in figure 4, additional lower-frequency emission bands are visible during the same time interval, as reported in figure 5, left. These emissions, analyzed with a fine time-scale (figure 5, right) reveal to be similar to the features observed at B0 = 7.2 T, as described in section 4.1.
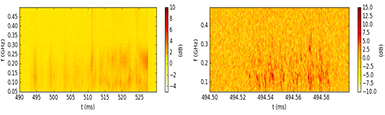
Figure 5. Left: Lower-frequency band in spectrum of shot #39848 (asymmetric case): the emissions appear within ±300 MHz from the LO frequency, corresponding to 0.5–1.1 GHz below the probe frequency. Right: When resolved in time around 494.5 ms, the same emission appears similar to the ones observed at B0 = 7.2 T.
Download figure:
Standard image High-resolution image4.4. Periodic bursts at around 15 MHz from the probe
The second feature found in 2015 is the presence of periodic bursts (spikes) in the CTS spectra at a frequency of around 15 MHz from the probe frequency, with repetition rate sometimes of the same order of the m:n = 2:1 island rotation frequency (figure 6, left), some other times at a much higher repetition rate (figure 6, right). Correlation studies have been made to infer if the observed peaks were emitted in coincidence (or, at least, in a recognizable phase) with the transit of the island O-point in front of the CTS antenna, or maybe at some multiple of the island rotation frequency, in case the repetition rate is significantly faster than the island rotation (figure 6, right).

Figure 6. Left: Periodic emission at frequency around 15 MHz from the gyrotron frequency in shot #39689 (asymmetric configuration): frequencies are shown with respect to the LO frequency centered at 140.28 GHz. Right: The periodic emission at frequency around 15 MHz from the probe frequency in shot 39 686 (symmetric configuration) is resolved in spots with a much higher (but regular) repetition rate, above and below the gyrotron frequency. Time is measured from the fast acquisition trigger, when probe frequency safely stabilizes in the notch filter stop band.
Download figure:
Standard image High-resolution imageSome attempts have been given to investigate the correlation between spikes and transit of the island O-point, but clear results have not yet been obtained because of the proximity between the island rotation frequency and the input chopping frequency (both around 10 kHz).
The study of this line is reported in figure 7: on the left part the CTS spectra is shown, after calibration. The gyrotron frequency was not stable along the pulse varying by a few MHz, while the frequency of the bursts was constantly shifted by 15 MHz. Thus the study of the correlation of this line with the signal of magnetic probes required a preliminary work to isolate the information of the amplitude of this emission from the spectra.

Figure 7. Top left: Varying gyrotron frequency around 22 MHz from the LO during 60 ms acquisition in shot #39686 (symmetric case); the color scale is in dB, uncalibrated. Spikes appear at a frequency around 37 MHz (around 15 MHz from the gyrotron frequency). Top right: The information spectrum of the amplitude fluctuation of the signal shifted 15 MHz from the gyrotron in linear scale: it shows repetition at frequencies below 100 kHz. Bottom: Spectrum of a magnetic probe for shot #39686, showing an island rotating at 10 kHz: the colour scale is logarithmic, in arbitrary units.
Download figure:
Standard image High-resolution image
At first, gyrotron frequency has been accurately calculated (by the center of the spectral power distribution around the expected gyrotron frequency). This calculation required correcting the spectra by taking into account the effect of the uneven (sloping) notch filter attenuation on the two sides of the notch central frequency. Then, the amplitude of the signal shifted of 15 MHz from the gyrotron frequency corrected in this way has been extracted. This signal has been firstly compared with both the corrected (as above described) gyrotron amplitude and gyrotron frequency time evolution, showing no correlation between this signal and the gyrotron behaviour, and then it would suggest to rule out a dependence of this line on the gyrotron emission spectrum.
The further analysis of the amplitude of the line shifted by 15 MHz was performed with the aim to correlate its repetition rate with the rotation frequencies of the magnetic islands. For this scope, the amplitude signal, evaluated each 1.33 µs to have a reconstructed signal sampled at 750 kHz, has been analysed by calculating its 'information' spectrum evaluated as follows: after performing the FT on a time slice of 2 ms, the chopping signatures (around 10 kHz and harmonics) were cleaned and FT divided by the average power density. The information spectrum is shown in figure 7, right, where maxima were truncated at 10. The information spectrum shows fluctuations above the noise level at frequencies below 100 kHz, which is a frequency sensitively higher than the island rotation frequency, from 10 to 12 kHz in the same time interval, as obtained by the magnetic probe signal spectrum (figure 7, bottom). Similar analysis performed on different lines (at the gyrotron frequency, or shifted by 20 MHz) shows typical lower fluctuations (gyrotron) or the absence of fluctuations with amplitude higher than the background noise (shift by 20 MHz). From the next campaigns, it will be possible to avoid the use of the chopping during operation with the radiometer. This further improvement should be helpful to determine whether a correlation exists between the oscillations observed in the emission shifted by 15 MHz and some harmonics of the island rotation frequency or other higher frequency magnetic perturbations.
5. Conclusions
The data analysis of the experimental campaigns of 2014 and 2015 showed interesting phenomena occurring in the plasma at very short-time scale, as well as also other phenomena at longer time scales, which deserve further attention and careful diagnostic calibration before conclusion can be drawn. Further analysis of these data and those of the 2016 campaign will provide additional indications to figure out correct interpretations of several phenomena. Other investigations are ongoing, to exclude parasitic effects, as well as breakdown phenomena in front of the antennas or gyrotron spurious line emissions. The variation in the stray radiation distribution in the vessel will be also studied with the aid of a diffusive model, to characterize variations on the probe beam absorption associated to the observed phenomena. On the diagnostic side, further experiments are planned with a receiver improved both in frequency band (up to ±4.2 GHz from the probe) and with the addition of a second channel with polarization selection capability, to allow a clearer interpretation of the emissions. The improvements of the diagnostic with a second independent line of sight not crossing the probe, will finally allow the possibility to distinguish the emissions located in the scattering volume from those generated elsewhere.
Acknowledgment
This work has been carried out within the framework of the EUROfusion Consortium and has received funding from the Euratom research and training programme 2014–2018 under grant agreement No. 633053. The views and opinions expressed herein do not necessarily reflect those of the European Commission.