


Abstract
For several reasons the challenge to keep the loads to the first wall within engineering limits is substantially higher in DEMO compared to ITER. Therefore the pre-conceptual design development for DEMO that is currently ongoing in Europe needs to be based on load estimates that are derived employing the most recent plasma edge physics knowledge.
An initial assessment of the static wall heat load limit in DEMO infers that the steady state peak heat flux limit on the majority of the DEMO first wall should not be assumed to be higher than 1.0 MW m−2. This compares to an average wall heat load of 0.29 MW m−2 for the design  assuming a perfect homogeneous distribution. The main part of this publication concentrates on the development of first DEMO estimates for charged particle, radiation, fast particle (all static) and disruption heat loads. Employing an initial engineering wall design with clear optimization potential in combination with parameters for the flat-top phase (x-point configuration), loads up to 7 MW m−2 (penalty factor for tolerances etc not applied) have been calculated. Assuming a fraction of power radiated from the x-point region between 1/5 and 1/3, peaks of the total power flux density due to radiation of 0.6–0.8 MW m−2 are found in the outer baffle region.
This first review of wall loads, and the associated limits in DEMO clearly underlines a significant challenge that necessitates substantial engineering efforts as well as a considerable consolidation of the associated physics basis.
Export citation and abstract BibTeX RIS
1. Introduction
The recent years of ITER design finalization have revealed that the plasma surface interaction requirements for integration of the first wall were previously underestimated. The DEMO design faces an even higher challenge; compared to ITER, the European DEMO design  [1] implies a fusion power that is four times higher and a major radius that is only 1.5 times larger. In addition, as the DEMO blanket has to perform efficient tritium breeding and energy conversion, its first wall is based on the structural material EUROFER-97 (ferritic-martensitic steel) instead of CuCrZr as a heat conductor material and is assessed to have a heat load limit that is significantly lower than extensive parts of ITER's first wall. Due to this, plasma surface interaction solutions for the first wall need to be integrated in the DEMO design from the pre-conceptual design phase, which is currently ongoing. Moreover, various key design decisions for DEMO (e.g. double null configuration or high heat flux limiters at the first wall) are dependent on open questions on plasma surface interaction and SOL transport.
This publication describes the status of knowledge with respect to the question, if the wall and the plasma in DEMO can be designed in a way that the wall loads stay within acceptable limits; then the main focus is on the prediction of wall heat loads based on simple considerations without entering too far into related engineering considerations. Static loads are featured more compared to dynamic loads, which need to be investigated further in the future. Also, as this publication concentrates on heat load aspects, the area of first wall erosion, which has the potential to significantly constrain the plasma-wall-clearance [2], has to be addressed in future publications. It has to be stressed that this is a relatively early report, intended to create awareness of the gaps that need to be closed.
The investigations presented in this paper are based on the design  [1], which includes a lower single-null magnetic configuration and an ITER-like divertor. After the introduction, several technical first wall limits are introduced (section 2). After this, basic information like the average static heat load distribution on the first wall of DEMO (section 3.1), relevant load types (section 3.2) and a conservative set of assumptions on the distribution of power to various key power loss channels (section 3.3) is presented. The bulk of the publication illustrates DEMO extrapolations for the following load types: thermal charged particle heat loads (section 4), static radiation heat loads (section 5), static fast particle heat loads (section 6) and disruption heat loads (section 7).
2. Technical heat load limits for the first wall
The baseline first wall designs assumed in this publication consist of a few mm of W amour joined onto a EUROFER-97 structure integrating numerous parallel cooling channels a few millimeters below its surface. The options for the coolant are pressurized  or He. In order to obtain a first indication of the allowable static heat load limit of the first wall and its main dependency calculations with the code RACLETTE [3] have been carried out (table 1). RACLETTE evaluates in 1D with a geometrical 2D correction the thermal response of all components involved in the heat removal process. It includes all key heat transfer processes like evaporation, melting, radiation and water boiling; it also considers corresponding limits. In these calculations a heat transfer coefficient of 100 kW (m2K)−1 (8.8 kW (m2K)−1) and a coolant velocity of 8 m s−1 (80 m s−1) have been assumed for
  (He).
(He).
Table 1. Maximum heat load sustainable at the blanket before reaching the critical temperature in EUROFER-97 ( C), for different thicknesses t, of EUROFER-97 between coolant and W, different coolant temperatures
  and
and  cooling respectively He cooling.
 cooling cooling |
|||
|---|---|---|---|
 |
 C C |
||
| t = 2 mm | 2.00 MW m−2 | 1.73 MW m−2 | |
| t = 3 mm | 1.70 MW m−2 | 1.47 MW m−2 | |
| He cooling | |||
 C C |
 C C |
 C C |
|
| t = 2 mm | 0.70 MW m−2 | 0.54 MW m−2 | 0.38 MW m−2 |
| t = 3 mm | 0.67 MW m−2 | 0.52 MW m−2 | 0.37 MW m−2 |
Based on the loss of strength at high temperatures, the EUROFER-97 temperature limit of  C typically considered in the breeding blanket design was used. Thermal stresses and failure by ratcheting is therefore not considered. Also the W temperature has been calculated and compared to relevant limits.
The EUROFER-97 temperature limit was found to be the driving criteria for the cases considered here. Apart from the coolant type and temperature  the minimum thickness t of the EUROFER-97 structure between W and coolant has the most eminent impact on the first wall heat flux limit. Smaller first wall channels would allow further reduction of t at the cost of increased pumping power requirements, higher fabrication cost, and higher manufacturing precision requirements.
Considering the results summarized in table 1 we currently assume that the steady state peak heat flux limit on the majority of the DEMO first wall is not higher than 1.0 MW m−2. This is much lower than the values being considered on the first wall of ITER, which have a peak of 4.7 MW m−2 [4]. The lower power handling capability of the wall in DEMO arises from [5]: (1) the requirement to breed tritium that imposes low neutron absorbing PFCs, (2) the higher coolant temperature for efficient power conversion, (3) the need to use materials able to withstand high neutron fluency and significant radiation damage and with low activation. In the case of DEMO, it is necessary to use EUROFER-97 as heat sink material rather than CuCrZr [6] as in the case of ITER, noting that the latter has roughly ten times higher thermal conductivity.
In addition to the standard designs considered so far, first concepts of alternative designs with higher heat flux capabilities are currently under discussion. These include design concepts with
- lower
 , for which an integration in the primary heat transfer system might not be possible (Could reduce the net electric power output of the plant.),
 - different material choices like the usage of Cu-alloys as heat sink (Necessitates more frequent exchange of components.),
- more complex first wall options (e.g. including HyperVapotrons) (Could significantly increase the total plant costs.).

An extreme option would be local wall components with high heat flux capabilities (≈20 MW m−2 for a limited duration) based on the ITER divertor monoblock technology [7].
Another critical question is whether the dynamic loads on the first wall of DEMO are leading to any limit of the first wall component being exceeded. For dynamic events, where the heat deposition is faster than the heat removal, the surface melting limit of W (≈3400 °C) could become critical. Expressed in terms of the heat impact factor, which accounts for the heat diffusion process, melting of bulk20 W surfaces starts from around 50 MJ  [8]. During dynamical events the temperature margin of the EUROFER-97 structure might be quickly exceeded. It is expected that the EUROFER-97-limit is more constraining than the W melt limit. More information on this can be found in [9]. Furthermore, it is currently not completely obvious how constraining W recrystallization (≈1200 °C)—especially in the case of periodic excursions of this temperature—will turn out.
3. Basic information
3.1. Average heat load
To obtain a first very crude assessment of wall heat load in DEMO, the total charged particle heating power (alpha heating power plus auxiliary heating power) of 457 MW is divided by the estimated wall surface of 1556 m2 obtaining an average heat load of 0.29 MW m−2. Hence, in cases of a limit of 1 MW m−2 a total peaking factor of up to 3.4 would be acceptable. To obtain a more detailed picture, predictions for each relevant load type have to be carried out.
For comparison, in ITER cases with the highest total charged particle heating power, the average heat load is 153 MW/800 m2 = 0.19 MW m−2. The load on the first wall is specified up to 4.7 MW m−2 corresponding to a peaking factor of 25. The fact that ITER is an experimental device while DEMO is a point design could justify a somewhat higher peaking factor for ITER.
3.2. Relevant load types
A first step towards a more detailed load assessment is to identify relevant combinations of plasma-wall-interactions and processes, during which these happen. Table 2 makes a first attempt to identify the most important combinations. Certainly, the loads due to some of these combinations are more dominant than others. However, it is essential to obtain estimates for all of them. Erosion in contrast to the other processes has individual technical limits.
Table 2. Combinations of plasma wall interaction and processes in the plasma leading to relevant first wall loads: x = relevant combination, (x) = possibly relevant combination, c = combinations considered in this pubication.
| Interactions | |||||
|---|---|---|---|---|---|
| Thermal charged particles |
Radiation | Neutral particles | Fast particles | ||
| Process | Static | x, c | x, c | x | x, c |
| Limiter configuration | x, c | x | x | (x) | |
| ELMs | x | x | |||
| Confinement transients | x | ||||
| Controlled VDEs | x | x | |||
| Disruptions | x, c | x, c | x | ||
| Erosion | x | x | x | ||
3.3. Assumptions on the power distribution
For the investigation of stationary heat loads, several assumptions on the power distribution in the plasma have to be made. The nominal power crossing the separatrix Psep,nom of 154 MW corresponds to 1.16 times the L-H-threshold power PLH [10] calculated via the scaling from Martin [11]21. It is assumed that the maximum value of Psep is 1.5 times the nominal value of Psep,nom. This does not include the case of an unforeseen H-L-transition during the flattop phase of the pulse, which needs to be investigated separately. A simple model is assumed, in which Psep is distributed into three channels: (1)  : a part associated with the standard SOL heat transport via charged particles as described in the Goldston model [13] with
  mm corresponding roughly to the scaling described in [14, 15], (2)
  : a part associated with the charged particle blob transport, where we assume a much higher e-folding length of 100 mm as justified in section 4.1 and (3)
  : a part that is going into radiation in the SOL and divertor. Only a negligible fraction of power in channel (1) arrives at the first wall and channels (2) and (3) correspond to the main static load interactions with the first wall.
There are significant uncertainties in the distribution of Psep to these channels. Figure 1 shows a possible power distribution for the conservative assumptions (a)  and b)
  (section 4.1). In addition to this distribution the case of a high radiation event should be considered, during which
  of Psep is radiated.
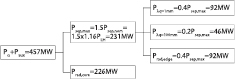
Figure 1. Distribution of power for the conservative assumptions (a)  and (b)
  .
.
Download figure:
Standard image High-resolution image4. Charged particle heat loads
4.1. The role of blobs
Blobs are coherent structures of denser plasma compared to the SOL background plasma elongated in the parallel direction. It has been predicted that there are two regimes for the perpendicular velocity  of the blobs [16]: At low SOL resistivity, in the sheath limited regime,
  , where
  is the blob size. At high SOL resistivity, in the inertial regime,
  , the transition between the two regimes has been experimentally shown [17] to be determined by the collisionality at the divertor plate. The inertial regime is especially reached, if the condition
is fulfilled, where  is the connection length,
  is the sound speed in the divertor and
  is the electron–ion collision frequency. While
  is not easily achieved in recent devices, for realistic DEMO parameters it will be fulfilled in the near separatrix and hence DEMO will be in the inertial regime. Consequently, the particle transport associated with the blobs is much more pronounced. On the contrary, the influence on the heat transport—which cannot be directly inferred from the particle transport—is at the moment not fully understood.
It seems reasonable to assume that in a high density regime up to  of the particle transport can be carried by blobs, as the time traces of the saturation current in ASDEX Upgrade L-mode discharges shown in figure 3(b) of [18] suggest. In a simple model
  of the associated power is transferred by the electrons to the divertor and
  (
( ) is represented in ions propagating with the blob to the wall. This compares to [19] where the difference between heating power and the sum of power to the target and radiated power has been found to be about
  in ASDEX Upgrade at highest densities. This difference, that is exposed to extensive measurement uncertainties, could be interpreted as the power that is deposited at the wall. Having in mind both of these values (
 and
and  ), we have associated up to
  of
of  to the long-
 -channel in figure 1. These considerations underline the need for more accurate and complete experimantal power balances.
Field line tracing in 2D has been applied adding the velocity component associated with the perpendicular motion of the blobs. Here the pessimistic assumption has been used, that the parallel elongation of the blobs is negligible at birth.22 The free parameters, which also represent urgent experimental investigation needs, are:
- the fraction of power transferred by the blobs fp
- the size of the blobs
- the velocity scaling factor fv23.

Assuming  MW and making reasonable assumptions on the blobs (fp = 0.2,
  , fv = 0.5) leads to wall heat loads due to blobs of 0.16 MW m−2. Going to a more conservative set of parameters (fp = 0.3,
  cm, fv = 0.7) gives 0.49 MW m−2 at the wall. It has to be stressed that the transfer from 2D wall load calculations with an idealized wall to 3D calculations with an engineering design of the wall can imply significant increases of the resulting heat loads.
In the 3D wall load calculations presented in section 4.3, exclusive blob transport with a corresponding e-folding length  is considered.
  is estimated assuming local heat conservation (
 ) and approximate differential operators (
 ). For the heat fluxes we use
  and
and  , where for
  we use the scaling for the inertial regime and fint is a factor that accounts for the intermittent nature of the blob transport. In [20] it is reported that ASDEX Upgrade L-mode plasmas typically ≈2% of a time trace from lithium beam emission spectroscopy in the SOL can be associated with blobs (
 ). To be conservative, we use
  in combination with
  ,
,  m,
m,  eV and a blob size of 10 cm, which gives
  mm.
mm.
4.2. The role of ELMs
A first review of the divertor temperature limit during ELMs in  came to the conclusion that an ELM mitigation method is required, which reduces the relative ELM size by a factor of 15 to 90 [1]. Consequently, various ELM mitigation methods are discussed [21] and first feasibility assessments have been started.
Large ELM filaments in principle could lead to spatially and temporally highly localized loads exceeding material limits, especially for the W armor. As it is unclear which method for ELM mitigation/avoidance will be selected, as well as the characteristics of any remaining plasma edge perturbations, the associated filamentary actives and the resulting wall loads are not currently known. Depending on the reliability of this method, plasma and wall might have to be designed to also sustain phases with unmitigated type-I ELMs.
4.3. Static charged particle wall loads in the flattop phase
The ITER experience has shown that 3D investigations are required to predict the peak heat loads due to plasma wall interaction with a wall that has typical engineering features (e.g. gaps and chamfers). A first set of such investigations has been carried out based on an initial engineering design of the first wall in DEMO. It should be noted that this wall design is initial and not optimized and even exhibits some substantial weaknesses, such that significant modifications will be required. The investigations presented in this section provide important guidance for the optimization of the first wall design.
The code PFCFlux [22] has been employed for power flux density calculations. According to section 3.3 the power crossing the separatrix of  MW has been assumed. PFCFlux calculates the heatflux mapping from the outer midplane to the wall and the associated shadowing using 3D fieldline tracing.
Figure 2 shows the peak heat flux density per blanket module. The peak heat loads of 6–7 MW m−2 are observed at the inner and outer baffle region (blanket-divertor transition region). Considering the relatively extensive angle between flux surfaces and first wall in this area, there is obviously some optimization potential. However, it is important to recall that in the ITER case penalty factors of totals up to 2.44 have been introduced [23]; this accounts for various deviations from the idealized situation (appearing during, design, manufacturing, assembly and operation). Also it should be stressed that the outer baffle is particularly highly loaded by radiation (section 5). As there is not much to be done about the radiation load, the charged particle heat load to this area has to be reduced by more than one order of magnitude. Also at the top of the main chamber, relatively high loads of up to ≈1.0 MW m−2 are observed. Besides the necessity to also reduce these loads, the load evolution during upward vertical displacement events has to be thoroughly investigated.
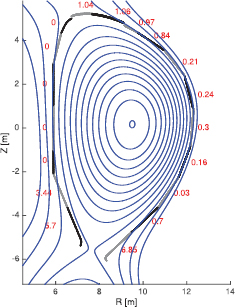
Figure 2. Peak power flux density (in MW m−2) for the 18 (individual) first wall panels of the DEMO (inboard and outboard) blanket segments (along the poloidal coordinate) calculated with PFCFlux assuming 46 MW crossing the separatrix to be distributed with  mm: the front faces of the breeding modules are alternately shown in black and grey. Flux surfaces are shown in blue.
Download figure:
Standard image High-resolution imageFigure 3 shows as an example the power flux density distribution on the inner baffle. It can be seen that a relatively large fraction of the surface is not wetted and hence there is considerable load concentration close to the edges. The edges in the toroidal direction have a radius of 100 mm. The peak heat loads appear in this area just before shadowing from other components sets in. This early version of the mesh does not include a radius, a chamber or any side face in the poloidal direction, which is relevant due to the poloidal gap between the blanket elements. The inclusion of this feature could lead to a further increase in the power flux density.
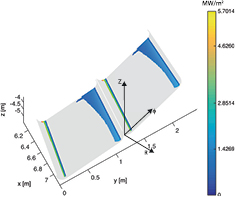
Figure 3. Power flux density distribution (in MW m−2) on the inner baffle (module 1) in a view from the top: the grey areas are shadowed.
Download figure:
Standard image High-resolution image4.4. Charged particle wall loads in limited configurations in ramp-up and ramp-down
The first wall loads in the diverted configuration can in principle be managed by increasing the wall clearance24 up to a point, at which the impact on the vertical stability [24] and hence on overall device performance [10] becomes intolerable. In contrast, in a limited configuration (e.g. during ramp-up or ramp-down), there is no free parameter like the wall clearance in a diverted configuration. However, there is the option to diverge from the baseline design option (i.e. wall contact at a low heat flux wall component) and include one or more dedicated high heat flux limiters into the design, in order to handle the wall contact25.
Planned limiter configurations usually have wall contact at the inboard or outboard side and both of these options have advantages and disadvantages. An inboard limited configuration would have the advantage that the electrical field during breakdown can be higher and consequently a higher pump-down target pressure and a lower pump-down duration26 could be possible with or without electron cyclotron breakdown assistance.
Another difference between inboard and outboard limited plasmas is related to the e-folding length  . For inboard limited plasmas a narrow and a broad SOL component are expected. Using an inboard limited configuration with 5MA we estimate
  mm (based on scalings from [25]) and
  mm (based on the Goldston model [13]). A typical DEMO equilibrium has a flux expansion between outer mid-plane (OMP) and inner mid-plane (IMP) of 1.7 leading to
  mm and
  mm. For the distribution of the power between the two components a large variety observed on various devices is reported in [26], concluding that it can be expected that the power channel balance parameter
  (
( and
and  are the parallel power flux densities at the separatrix outer midplane associated with the narrow respectively broad components) falls in the range between 1 and 6. We suggest to adopt the same approach for DEMO until further understanding of the determination of Rq is obtained.
For outboard limited plasmas the knowledge base is much weaker, which—considering that this is an interesting option for DEMO—should be changed. We use the finding, that in JET  for outboard limited plasmas can be up to 7.5 times smaller than
  for inboard limited plasmas [27]. This leads to a conservative estimate for
  for outboard limited plasmas in DEMO of 6 mm.
However, the most preferable option for limiter positioning in DEMO in terms of maintainability is to put them inside ports. This would allow for the limiter to be exchanged several times during the life time of DEMO. Especially the ports at the outer midplane, which are more poloidally than toroidally elongated, seem to be very relevant.
The maximum power crossing the separatrix in a limited configuration is an important parameter for the calculation of the wall loads. Similar to ITER, it is assumed that the limited to x-point transition happens at about 5 MA. Up to this point, the ohmic power launched into the plasma has been calculated to be less than 3 MW. The most optimistic assumption would be that despite of the breakdown phase27 no auxiliary power is launched to the plasma during the phase with limited configuration and hence  MW is used. We note that for ITER the rule
  has been used. Due to the negative
  the power crossing the separatrix could be higher during the limiter phase at the end of the ramp-down, however to assess this the investigation of the DEMO ramp-down needs to progress. If the plasma is perturbed into a limited configuration during the flattop phase, Psep can be higher by orders of magnitude.
5. Radiation heat loads
In order to be able to manage the power exhaust, DEMO has to operate with significantly higher radiation fractions than ITER. The optimum impurity mix to simultaneously achieve (1) divertor protection, (2) H-mode operation and (3) optimized fusion performance has been investigated [24, 28], but still needs further substantiation. Until now it seems to be clear that because of the relatively low fuel dilution higher Z impurities like Ar or Kr are interesting candidate seeding species. A second seeding species with lower Z radiating more efficiently in the divertor might be added. It needs to be investigated if the peak wall loads due to radiation in combination with other loads do exceed the wall load limits.
In a first approach for the estimation of the static radiation wall loads in DEMO, it has been assumed that the radiation source density is constant on flux surfaces. Figure 4 shows the total radiation load on the first wall for EU DEMO1 2015 (303 MW radiated from inside and 154 MW from outside the separatrix)28. A peak load of ≈0.4 MW m−2 is observed at the outer mid plane.

Figure 4. Total radiation load on the first wall of DEMO for a plasma with 0.74% Ar and 0.013% Xe and  MW, based on the assumption of a constant radiation source density on flux surfaces: The radial radiation source profiles have been obtained in DEMO simulations with STRAHL [29] coupled to ASTRA [30, 31].
Download figure:
Standard image High-resolution imageHowever, especially in plasmas with a (partially) detached outer divertor significant levels of radiation peaking in the x-point region have been observed [32]. Figure 5 shows the situation with a radiation source of 150 MW concentrated in the x-point. A peak load of ≈0.8 MW m−2 is observed on the divertor dome, which can be designed as a high heat flux component. In the outer baffle region up to 0.5 MW m−2 are calculated. Extrapolating this to the theoretical worst case limit where all heating power  MW is radiated from a highly localized source at the x-point leads to ≈1.5 MW m−2.

Figure 5. Radiation load on the first wall of DEMO based on the assumption that  MW is radiated from the x-point position (indicated by the dot).
Download figure:
Standard image High-resolution imageUnlike C, N and Ne that only strongly radiate at temperatures expected in the divertor/SOL (<100 eV), higher Z impurities like Ar, Kr or Xe also radiate significantly at temperatures further inside the separatrix. Therefore, we can assume that in DEMO a significant fraction of the heating power has already been radiated before it can be conducted/convected across the separatrix. Furthermore, the radiating volume in the core plasma in DEMO will be significantly larger than the radiating volume in the x-point and divertor region. Both effects suggest that the scenario described above, where all heating power is radiated in the x-point vicinity, is highly unlikely. Following experimentally observed ratios of divertor/x-point radiation to main chamber radiation as described in [33] for N, Ne and Ar seeding on JET a scenario where maximally 150 MW is radiated from the x-point region seems more realistic, but is still a very conservative upper limit for a stable operating scenario. In fact considering a ratio of 1/5 of divertor and x-point to main chamber radiation for Kr seeding in JET as reported in [2], would suggest an upper limit for the x-point radiator to be 60 MW.
Table 3 estimates the total radiation power load at the outer baffle for the two x-point radiation fractions  and
and  . It is assumed that after subtracting the x-point radiation power
  , the residual radiation power
  has a radial/poloidal source distribution as assumed for figure 4 (i.e. radiation source density constant on flux surfaces in confined and SOL plasma). The peak of the total radiation power flux density on the first wall (not divertor or dome) for these two cases is found at the outer baffle and has values of
  MW m−2 and 0.77 MW m−2, where
  ,
,  and
and  are the power flux densities at the outer baffle associated with the total radiation, x-point radiation and residual radiation, respectively. Hence, if
  of
of  is radiated, the associated loads are within the technical limits, but close to them.
Table 3. Total radiation power density and breakdown at the outer baffle for two distributions into x-point radiation and residual radiation (i.e. radiation source density constant on flux surfaces in confined and SOL plasma).
| Fraction of x-point radiation | 0.33 | 0.20 |
|---|---|---|
 (MW) (MW) |
151 | 91 |
 (MW m−2) (MW m−2) |
0.50 | 0.30 |
 (MW) (MW) |
306 | 366 |
 (MW m−2) (MW m−2) |
0.27 | 0.32 |
 (MW m−2) (MW m−2) |
0.77 | 0.62 |
6. Fast particle heat loads
First wall power loads by fast alpha particles were calculated using the well-established ASCOT code [34]. Losses that may be due to fluctuations and waves in the plasma have not been considered so far. The simulation was carried out for four different approximation of the background magnetic field: an axisymmetric 2D field ('2D'), a field including TF ripple due to finite number of TF coils ('TF only'), a field including TF ripple and ferritic inserts (FI) with full mass ('TF FI full') and with half mass ('TF FI half') to minimize the costs of the installation. The simulations were carried out until the alpha particles slowed down to local thermal energy, or until the alphas hit the first wall contour. As a first wall, a fully 3D CAD design was used enabling to detect possible hot spots or vulnerable components. Table 4 shows the global values for alpha particle losses. Two things are particularly interesting in this table. First, the mitigation of heat loads is very well obtained only with half of the mass in ferritic inserts. Secondly, the power loss and alpha losses does not correlate very well, i.e. the ferritic inserts tend to shield more particles with higher energies leading to lower lost powers while the absolute number of lost alphas is not dramatically different. Overall, the values obtained in this study are rather low. However, as shown in figure 6, this load is not distributed evenly along the wall, but rather peaked in both toroidal and poloidal directions. Even taking this into account, the maximum heat loads are well bellow the level of 0.1 MW m−2.

Figure 6. Alpha particle heat loads on the 3D blanket design of the DEMO wall using the 18-fold symmetry of the physical model for the case TF only: the poloidal angle is  at the outer midplane.
Download figure:
Standard image High-resolution imageTable 4. Global loss parameters for four different magnetic configurations.
| Configuration | Alpha loss ( ) ) |
Power loss ( ) ) |
Lost power (kW) |
|---|---|---|---|
| 2D | 5.4 | 0.026 | 110 |
| TF only | 7.7 | 0.15 | 640 |
| TF FI full | 6.0 | 0.037 | 160 |
| TF FI half | 6.6 | 0.052 | 220 |
While this analysis revealed several interesting and important aspects, unfortunately, there has been several shortcomings most importantly including inaccuracy of the magnetic field, calculated by a finite element based method, leading to crossing of the magnetic field lines deep inside the plasma. Moreover, the size of the wall elements used in this study clearly is not fully optimized. For many elements the wall loads are under-/overestimated as the elements are either very small (only one high energy particle can hit it, overestimating the heat load) or too large (part of the element can be empty and the other part can have several recordings of alphas been hit, thus, underestimating the heat load). These shortcomings are being issued at the moment and the results will be published in more detail separately. However, we do not expect the main results, like the data shown in table 4, to be quantitatively different even when the shortcomings have been relaxed.
In a complementary study [35] the question of the relevance of the plasma response for the fast particle losses has been investigated. This is motivated by the recent discovery [36], that the plasma response model employed to investigate the effect of axisymmetry breaking due to n = 3 resonant magnetic perturbations (RMP) has a very strong effect on fast ion confinement and losses. Two opposing approaches are compared, one where the symmetry breaking field calculated in absence of the plasma is added to an axisymmetric MHD equilibrium calculation (henceforth called the '2D +ripple' approach), while the other where a full 3D free boundary MHD equilibrium calculation naturally includes the plasma response within the 3D deformation of its flux-surfaces (henceforth called the '3D equilibrium' approach). Analyzing the fast particle trajectories for the two descriptions of the magnetic field for DEMO in the orbit code VENUS-LEVIS [37], it was found that the guiding center approximation was adequate for the study, essentially because the scale length of the magnetic field variation is much larger that the Larmor radius of 3.5MeV alpha particles. In addition, unlike in the n = 3 RMP study investigated previously [36], the magnetic ripple in DEMO (which has the mode number n = 18) does not cause a significant plasma response. Hence the standard '2D + ripple' and the '3D equilibrium' approaches reveal essentially the same plasma confinement properties and losses. This is indicated in figure 7, which shows loss rates of alpha particle distributions per energy interval plotted as a function of energy assuming a 2D equilibrium without ripple (blue), a 2D + ripple model (green), and a 3D equilibrium model (red). The figure also shows, that the deviation between the pure 2D and the other models is strongest between 100–200 keV. As the saturated distribution of  particles can only explain a small fraction of this effect, we hypothesis that this is due to collisions in the presence of magnetic wells.

Figure 7. Loss rates per energy interval as a function of energy for alpha particle distributions calculated assuming a 2D equilibrium without ripple (blue), a 2D + ripple model (green) and a 3D equilibrium model (red).
Download figure:
Standard image High-resolution image7. Disruption heat loads
The damage of plasma facing components due to huge heat loads during disruptions is of great concern for DEMO. In the following a first estimate of the peak power flux density and the heat impact factor at the first wall and the divertor during unmitigated and mitigated disruptions in DEMO is presented. This is based on a plasma in  with
with  MA,
MA,  and a pre-disruption thermal energy of 0.9 GJ29. Table 5 provides an overview of the assumptions and results of these investigations.
Table 5. Assumptions and load estimates for unmitigated and mitigated disruptions in DEMO.
| Unmitigated disruption | Mitigated disruption | |
|---|---|---|
| Thermal energy content | 0.9 GJ | 0.9 GJ |
| Magnetics energy content | 0.9 GJ | 0.9 GJ |
| Duration of wall energy impact | Rise phase: 1ms Decay phase: 3ms | 5-10ms |
| Energy release mechanism | Conduction / convection by charged thermal particles | Radiation |
Pre disruption  |
5 mm | not relevant |
| Radial broadening factor | 3 | not relevant |
| Toroidal peaking factor | 1 | 1.4 |
| Peak energy density | Rise phase: 3 MJ m−2 Decay phase: 7 MJ m−2 | 0.75 MJ m−2 |
| Peak energy impact factor | Rise phase: 95 MJ (m )−1 Decay phase: 128 MJ (m )−1 Decay phase: 128 MJ (m )−1 )−1 |
10.5–7.5 MJ (m )−1 )−1 |
For an unmitigated disruption, the heat load to first wall and divertor via conduction/convection by charged thermal particles is calculated. We use an optimistic pre-disruption e-folding length of 5 mm30 in combination with a conservative value of 3 for the broadening of the radial deposition profile during the disruption [38]. Accounting only for the loss of thermal energy, as in [39] we use a model based on experimental findings [40], in which the power flux across the separattrix during the disruption exhibits a fast rise phase and ∼2–4 × slower decay phase (similar to type I ELMs [41]). Consequently we assume that  (
( ) of the thermal energy is lost in the rise phase (decay phase) lasting 1 ms (3 ms). It is currently not clear, if there is toroidal peaking and we make, in the present study, the optimistic assumption that this is not the case. Using a relatively simple tool that calculates in 2D the evolution of the power flux density leads to a peak energy flux density at the inner divertor baffle of 3 MJ m−2 (7 MJ m−2) and peak heat impact factor of 95 MJ
  (128 MJ
  ). This is far beyond the threshold for surface melting of W [8] and also the EUROFER-97-limit of 550 °C would be significantly exceeded. Hence, such an event has to be absolutely avoided, as it is likely to necessitate an exchange of the affected blanket modules. The presented evaluation for unmitigated disruptions does not take into account any self-protecting mechanisms like vapor (or plasma) shielding, setting in as a consequence of the sudden ablation of the plasma facing material surface at the beginning of the thermal quench.
The prediction of the wall load during a perfectly mitigated disruption is based on a simple model, in which the impurities injected by a disruption mitigation system are stopped at the edge of the plasma, resulting in a cold front moving inward until it crosses the q = 2 surface and destabilizes MHD modes driving the thermal quench [42]. We assume that  of the thermal energy is radiated during these processes in 5–10 ms [43]. For the toroidal peaking factor the value 1.4, as observed at JET [44], is used, stressing that there are significant physical and technical uncertainties on this value. A Monte-Carlo-simulation tool similar to the one used for the calculation of static radiation loads [24], is used for estimating the first wall heat loads due radiation induced by massive gas injection. As a first approximation—following the simulation carried out for a basic inductive 15 MA ITER scenario, with Ne massive gas injection before the thermal quench [45]—the plasma thermal energy was simulated to be radiated homogeneously in an annular region (
 ) at the plasma edge. The distribution of energy density at the first wall is shown in figure 8. The peak energy flux density is 0.75 MJ m−2 and the peak heat impact factor is 10.5–7.5 MJ
  .
.

Figure 8. Poloidal distribution of the radiation wall load during a mitigated disruption in DEMO: The two minima roughly correspond to the divertor strike point areas.
Download figure:
Standard image High-resolution image8. Summary
This publication summarizes the recent knowledge and open gaps with respect to the question of first wall loads in DEMO, with a focus on static wall loads. In section 2 various technical load limits are introduced. One of the most constraining aspects for the case of static loads is the limit of  C for EUROFER-97. An initial list of load types and a set of conservative assumptions on the input power distribution are presented in section 3.
The characteristics of the radial blob transport determines the distribution of the static heat transport by charged particles to the first wall. In principle, by increasing the wall clearance it is possible to shift this balance as much as necessary towards the divertor. However, the higher the fraction of heat transported in blobs and the associated e-folding length are, the higher the clearance needs to be and the lower will be the vertically stabilizing effect of the vessel and the lower the elongation and hence the performance of the device can be.
For the integrated optimization of plasma shape and first wall engineering design a 3D charged particle heat load analysis has been established. Employing an initial engineering wall design with clear optimization potential in combination with parameters for the flat-top phase (x-point configuration), loads up to 6–7 MW m−2 have been calculated. Similar evaluations for limited phases have to follow. As shown for the ITER case [23], a critical point will be the question of identifying appropriate penalties (ITER: in total up to 2.44) representing all relevant kinds of inaccuracies (design, manufacture and assembly) to be multiplied by the peak heat loads.
Increasing the level of radiation by impurity seeding is used as a method to homogenize the heat distribution at the first wall. The radiation source distribution in the poloidal plane is an uncertainty in this context. Assuming a fraction of power radiated from the x-point region between 1/5 and 1/3 leads to peaks of the total power flux density due to radiation of 0.6–0.8 MW m−2, found in the outer baffle region.
Investigations of fast particle heat loads on the first wall with orbit following codes suggest, that even taking into account poloidal and toroidal peaking, the highest loads do not exceed 0.1 MW m−2. In a linked investigation it has been shown that the effect of the plasma response is negligible in this case. Effects of the interaction of modes and fast particles have not been taken into account, but might significantly change the result.
An investigation of the heat impact and its dynamics for unmitigated disruptions at full power shows very clear that it must be an absolute priority to avoid these events in DEMO, as the heat impact factor rises to more than twice the W surface melt limit. The calculated heat impact factor for mitigated disruptions corresponds to ≈20% of this limit. However the ITER experience shows, that redoing such an analysis with an engineering design of the first wall and a more detailed description of the plasma often leads to a significant increase of the calculated loads. Also, the processes at the wall during these events should be modelled in more details.
It has to be the subject of future work, how the various loads superpose for the full range of realistic features of the investigated processes (table 2). We assume that the distribution shown in figure 1 is one of the most conservative ones for the static case.
From these initial findings on first wall loads in DEMO some early recommendations for the design of the first wall can be derived. Two fundamental options for the first wall design are under discussion: (1) an ITER-shaped wall that is within the limits of the breeding blanket manufacturing possibilities aligned to the flux surfaces and does not contain any high heat flux components and (2) a wall that contains high heat flux limiters elongated in the poloidal direction. Also a mixture of these two options is conceivable. Furthermore, a double-null configuration for DEMO is under discussion and will be a subject of future publications. As it is assumed at the moment that the risk of unmitigated disruptions cannot be reduced sufficiently, the implementation of sacrificial limiters that receive the heat impact during these events is advisable. Especially for the outer baffle region, which is heavily statically loaded by charged particles and radiation, a solution with higher heat flux capability might become necessary. After a detailed study of dynamic events (e.g. vertical displacement events and unforeseen H-L-transitions) more locations that need to be hardened against higher heat fluxes than 1 MW m−2 will be identified.
Acknowledgment
This work has been carried out within the framework of the EUROfusion Consortium and has received funding from the Euratom research and training programme 2014–2018 under grant agreement No 633053. The views and opinions expressed herein do not necessarily reflect those of the European Commission or of the ITER organization.
Footnotes
- 20
The amor layer on the first wall is planned to be deposited.
- 21
The Martin scaling [11] is based on data from C wall devices. A reduction of PLH by 20–30% has been observed in W wall devices [12]. Also, for the ITER design point, the
-confidence interval expands from ≈50% to ≈200% of the scaled value. Finally a reasonable margin PLH should be allowed to ensure sufficient controllability and confinement quality. - 22
A parallel elongated blob would spread the power on a significantly larger area of the first wall.
- 23
This is a correction factor accounting for the fact that the employed equation for the perpendicular blob velocity is describing an upper limit. For instance it accounts for the fact that
decreases when going from the near to the far SOL. - 24
In the baffle region this might necessitate a modification of the divertor design.
- 25
Also in diverted configurations, high heat flux limiters at the first wall can help to manage the power exhaust to the first wall.
- 26
Based on current estimates for the first wall temperature during plasma operation and dwell time, hydrogen transport simulations assuming a neutron damaged wall suggest that strong outgassing from these neutron generated defects in W can increase the pump down time to more than 500 s (104 s) to reach a base pressure of
(). - 27
Here EC powers of up to 6 MW are currently considered.
- 28
The poloidal radiation load distribution is different than in [24], as a weakness of the analysis code has been identified and corrected recently.
- 29
There is some deviation from the precise values of
: and GJ. - 30
This compares to a prediction of ≈1 mm in [15].


