


Abstract
New results on the I-mode regime of operation on the Alcator C-Mod tokamak are reported. This ELM-free regime features high energy confinement and a steep temperature pedestal, while particle confinement remains at L-mode levels, giving stationary density and avoiding impurity accumulation. I-mode has now been obtained over nearly all of the magnetic fields and currents possible in this high field tokamak (Ip 0.55–1.7 MA, BT 2.8–8 T) using a configuration with B × ∇B drift away from the X-point. Results at 8 T confirm that the L–I power threshold varies only weakly with BT, and that the power range for I-mode increases with BT; no 8 T discharges transitioned to H-mode. Parameter dependences of energy confinement are investigated. Core transport simulations are giving insight into the observed turbulence reduction, profile stiffness and confinement improvement. Pedestal models explain the observed stability to ELMs, and can simulate the observed weakly coherent mode. Conditions for I–H transitions have complex dependences on density as well as power. I-modes have now been maintained in near-DN configurations, leading to improved divertor power flux sharing. Prospects for I-mode on future fusion devices such as ITER and ARC are encouraging. Further experiments on other tokamaks are needed to improve confidence in extrapolation.
Export citation and abstract BibTeX RIS
1. Introduction
The I-mode confinement regime features an edge barrier in thermal confinement, similar to that in the H-mode (high confinement) regime, but without the particle transport barrier also present in H-mode discharges [1]. This combination leads to high energy confinement but low particle confinement, which is beneficial for fusion in several respects; accumulation of impurities and He 'ash' is avoided, and density can be more readily controlled. Importantly, I-modes are generally stable to edge localized modes (ELMs), avoiding the transient heat pulses which are predicted to impact the divertor lifetime of ITER and other fusion devices, while maintaining steady density [2].
I-mode has been observed since the late 1990s on Alcator C-Mod [3] and ASDEX Upgrade [4], where it was first recognized as an improved confinement regime and was initially termed 'improved L-mode' [4], often a transient phase. It is most commonly and robustly accessed when the ion B × ∇B drift is away from the active X-point, the so-called 'unfavorable' drift direction for H-mode due to the higher power threshold for L–H transitions. Its development as a stationary regime and recognition of its potential attractiveness for fusion scenarios have led to increasing interest and exploration in recent years. A multidevice study coordinated by ITPA has compared results on C-Mod, AUG and DIII-D, based on a joint data set assembled in 2014 and detailed measurements on each of the three tokamaks [5, 6]. This shows that I-mode can be accessed over a very wide range of global and dimensionless parameters, including low q95 and low collisionality. Features which are common to all three devices include the formation of an edge Te and Ti pedestal, with L-mode density profiles, and changes in edge turbulence including a decrease in fluctuations across a mid-frequency range. A typical example on Alcator C-Mod, with BT = 5.8 T, and 4 MW ICRH, is shown in figure 1. After the L–I transition at 0.72 s, temperature, pressure and normalized confinement all increase strongly, reaching Te(0) = 8 keV, volume averaged pressure 1.25 atm and H98 = 1.2. Both C-Mod and AUG have reported a weakly coherent mode (WCM), at typically 150–250 and 120 kHz, respectively, and a fluctuating flow at the frequency of Geodesic Acoustic Modes during I-mode [7–11]. A recent study of I-mode transitions, pedestals and confinement properties on AUG by Ryter et al shows H98 approaching one in some cases, correlating with pedestal pressure and suggests a key role for ion heat flux as in H-modes [12]. Details of I-modes on DIII-D, with somewhat lower pedestal temperatures and confinement, are reported in [13].
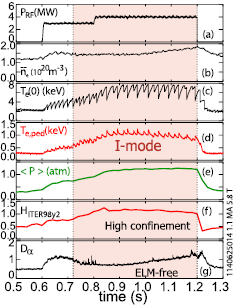
Figure 1. Example of typical C-Mod I-mode discharge 1140625014, BT = 5.8 T, Ip = 1.1 MA. Traces show (a) coupled ICRH power (b) line averaged density (c) central electron temperature, (d) Te near pedestal top (e) volume averaged pressure  , (f) energy confinement normalized to τITER-98y2, (g) Dα emission.
Download figure:
Standard image High-resolution imageWe report here on several new I-mode experiments which were conducted on C-Mod during the 2015 and 2016 campaigns, since the ITPA dataset was assembled. These aim to understand better the conditions to access and maintain the regime, and its performance, for improved confidence in its extrapolation. We have also begun to investigate the boundary heat flux in I-mode, a critical issue for any regime, and explore means of reducing it. Section 2 summarizes the expanded range of C-Mod parameters over which I-mode has now been accessed and discusses L–I and I–H threshold conditions. Notably, magnetic field BT has been varied from 2.7 to 8.0 T, revealing surprising dependences which lead to a wider operating window at higher BT. Section 3 presents studies of core particle and energy confinement in the I-mode regime. New results on the physics of fluctuations and flows at I-mode transitions and in the pedestal, enabled by improved diagnostics and by simulations, are summarized in section 4. Divertor heat flux and its control, including first experiments with a near double null configuration, are discussed in section 5. In section 6, we use these results to examine the prospects for extrapolation of I-mode to future burning plasma experiments, focusing on ITER and the high field demonstration fusion reactor pilot plant design ARC [14]. Key issues and uncertainties are identified. Results are summarized and future research on a range of devices to address these issues is proposed in section 7.
2. Extension of I-mode regime to lower and higher magnetic field and current
Plasma discharges in the I-mode regime have now been produced on C-Mod over essentially all the magnetic fields and currents achievable on this high field, compact tokamak, BT = 2.8–8.0 T and Ip = 0.55–1.7 MA, as shown in figure 2; not all discharges have yet been included in the dataset. In many cases, I-mode has been maintained, without transitions to H-mode, at the highest heating powers available, up to 5 MW ICRH with frequency 50–80 MHz. These results demonstrate the robust nature of the regime under appropriate conditions. This includes operating in a configuration with the B × ∇B drift away from the active X-point; all of the I-modes in this paper were accessed in this configuration, termed 'unfavourable' for H-mode due to higher power thresholds. In these cases powers in I-mode can exceed twice the L–H scaling for discharges with 'favourable' drifts [15]. We do note that there have been examples of I-mode with drift towards the X-point, in a specific shape [7]. However these had narrow power ranges, and the low H-mode thresholds typical of such configurations. Most recent I-mode discharges used a lower single null configuration, where the power flux is directed to the shaped lower divertor; field and current direction are in this case reversed compared to the typical configuration used for H-modes.
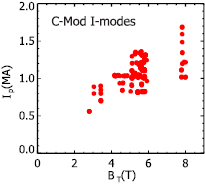
Figure 2. Current versus magnetic field of some I-mode discharges on Alcator C-Mod.
Download figure:
Standard image High-resolution imageAn unexpected result, first presented at FEC 2014 [5], was that in contrast to the L–H threshold, the power required to access I-mode scales at most weakly with toroidal field; P(L–I) was essentially the same at 2.8 T as the more typical C-Mod operating range of 5–6 T. Figure 3 shows a comparison of two discharges in the same day, with L–I transitions occurring for 1.2 MW ICRH in both 2.8 T and 5.4 T cases. Loss power, defined as Ploss = Poh + ηRF PRF − dW/dt, is 1.46 MW and 1.55 MW, respectively. Here Poh is the ohmic power, PRF is the ICRF power launched from the antenna, absorption efficiency ηRF the fraction of PRF absorbed by the confined plasma and W the stored energy. Second harmonic D heating is used at the lower B and D(H) at 5.4; we estimate ηRF = 0.8 in both cases. The upper limit of power for I-mode, set in many cases by I–H transitions, does increase with BT. In the 2.8 T example, a small increase of ICRF power to 1.5 MW leads to an I–H transition, while at 5.4 T this does not occur until PRF = 3.8 MW (Ploss = 3.2 MW). This general trend to a wider power range with I-mode at higher BT was found in a broader set of C-Mod I-modes, and to be roughly consistent with results on DIII-D and AUG operating typically in the 1.9–2.5 T field range [6].
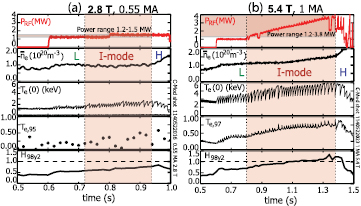
Figure 3. Comparison of two discharges on the same run day, at 2.8 T, 0.55 MA, ((a), discharge 1140522016) and 5.4 T, 1 MA, ((b), discharge 1140522023). Traces, from top to bottom, are coupled ICRH power, line averaged density, central electron temperature, Te near pedestal top, measured by Thomson Scattering and ECE respectively and energy confinement normalized to τITER-98y2. The two discharges enter I-mode at similar power, but the higher field case remains in I-mode to much higher power, thus reaching significantly higher pedestal temperature and normalized confinement.
Download figure:
Standard image High-resolution imageMotivated by these results, and a few observations of transient I-modes in earlier 8 T experiments, exploration of the I-mode regime in the 7.8–8 T range was carried out in the 2015 and 2016 campaigns. At this field the D(He3) ICRH scenario (where D is the main ion species and the species in parenthesis is a small minority fraction) is used to heat the discharges. This has lower single pass absorption than the D(H) scenario most often used at lower fields, leading to overall heating efficiency which is reduced and more difficult to quantify accurately; analysis of threshold power and energy confinement is therefore more uncertain. Based on analysis of stored energy changes at RF steps, we estimate ηRF = 70 ± 15%. Absorption is expected to increase with core Te, thus is generally likely to be higher in hot I-modes than in L-modes, and will vary with He3 fraction. An example of an I-mode at 7.8 T, 1.35 MA, with 4.8 MW ICRH is shown in figure 4. This shows the same characteristic features as lower field I-modes, namely increases in temperature and stored energy and the development of a strong T pedestal, with near constant density. The slow density rise is due to external fueling. Assuming an RF absorption of 80%, which is on the high end of estimates and thus conservative, the normalized confinement H98,y2 reaches 1.0 for many confinement times. Reduction of pedestal turbulence is seen in the range 50–200 kHz or higher, and an edge Weakly Coherent Mode appears. Typical WCM frequencies are higher at the increased field and current, 350 kHz in this example and up to 450 kHz at higher Ip.
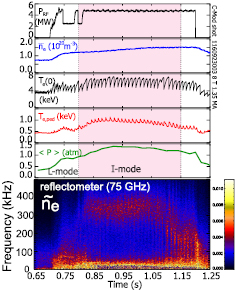
Figure 4. Example of I-mode phase in recent discharge 1160923003 at 8 T, 1.35 MA, q95 = 3.7. Stored energy WMHD reaches 180 kJ and average pressure 1.4 atm. H98,y2 exceeds1.0 assuming 80% ICRF absorption, and may be higher. The bottom panel shows frequency spectra from an o-mode reflectometer which is sensitive to density fluctuations at nc = 7 × 10¹⁹ m−3, which is within the pedestal region.
Download figure:
Standard image High-resolution imagePedestal profiles from the discharge preceding the one presented in figure 4, which is comparable, are shown in figure 5. Pedestal Ti (c, from CXRS [16]), as well as Te (a) exceeds 1 keV, with strong gradients (140 keV m−1) in the region r/a 0.97–0.99. The Ti and Te profiles overlay closely in the steep gradient region, and agree inboard of the pedestal within respective uncertainties. For comparison, electron profiles for an Enhanced Dα (EDA) H-mode discharge, also with BT = 7.8 T and similar current and power, show the typical strong density pedestal and a lower temperature pedestal. CXRS also shows a strong Er well, with a depth of 100 kV m−1, and Er,min −50 kV m−1. These values are comparable to those in many EDA H-modes in the 5.4 T ranges [17, 18] and greatly exceed the Er well typical of 2.8 T I-modes. An example from a lower field discharge similar to that in figure 3(a) is shown for comparison. It is striking, and poses an interesting test for transition models, that no transitions to H-mode, with a particle barrier and turbulence suppression, occurred despite the strong Er shear in these high B I-mode discharges. The E × B velocity in the Er well minimum (approx. 10–15 km s−1) and its shear in the outer region of the pedestal, are however quite close in the low and high field examples. We note that Er wells in C-Mod ELMy and especially in ELM-free H-mode discharges can be still deeper, up to 250 kV m−1 [17].
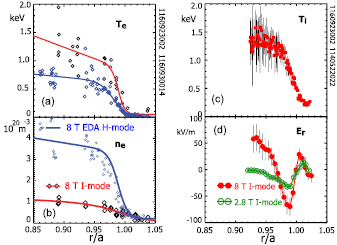
Figure 5. Pedestal profiles (red + black diamonds) in a very similar discharge to that of figure 4 (1160923002). Pedestal Te (a) reaches 1 keV, while ne (b), remains at L-mode values. Measurements are from Edge Thomson Scattering. For comparison, an EDA H-mode discharge at comparable field and current (blue) has a strong density pedestal but lower Te,ped. Pedestal Ti (c) from CXRS [16] is comparable to Te. A strong Er well (d) develops in the pedestal region. For comparison, an I-mode discharge at 2.8 T has much weaker Er shear (green). The lower B discharge is similar to that in figure 3(a), and has lower Ip (0.55 MA) and input power (1.5 MA) than the 8 T case due to the lower I–H threshold.
Download figure:
Standard image High-resolution imageAn overview of the power range versus magnetic field for C-Mod I-modes and L–I transitions is shown in figure 6. Here ηRF = 70% is assumed for the D(He3) scenario; error bars on the L–I transitions (green) represent a power range of ±15%. We take ηRF = 80% for the other, more efficient scenarios. In order to compare powers at different densities, based on earlier results of increasing P(L–I) with density [19], power is normalized to ne and to surface area S for comparison with other tokamaks [6]. The L–I threshold power has at most a weak dependence on magnetic field. A regression fit using equal weightings gives P(L–I)/(neS), ~B0.26±0.03. This result is consistent with recent AUG experiments which reported a dependence PL–I/ne proportional to  over the range 1.8–3.0 T [11]. As noted, different ICRH scenarios lead to significant uncertainties; propagating the larger uncertainties in the relatively few 8 T discharges would allow for even weaker BT dependence. Importantly, no transitions to H-mode were observed in any 7.8–8 T discharges, up to the maximum available RF power of 5 MW. This indicates that the power range for I-mode does further increase at higher field, and that the plasma pressure could have been further increased with more input power. The upper line represents a B0.8 dependence as has been found in ITPA scalings for L–H transitions with 'favourable' drift direction [15], which would be consistent with the upper bound of I-mode powers. However, as discussed further in section 4, the conditions for I–H transitions are more complicated, depending on density as well as power, so the curve does not represent well the experimental I–H threshold.
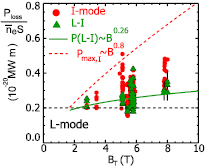
Figure 6. Loss power at L–I transition (green triangles) and in I-modes (red circles), normalized by density and surface area, restricted to densities above minimum power threshold and with q95 = 3–5. Solid green line represents the regression fit, P/(neS) = 0.162 B0.26.
Download figure:
Standard image High-resolution image3. Particle and energy confinement in the I-mode regime
Perhaps the biggest advantage of the I-mode regime versus H-mode, in addition to the lack of ELMs, is the much lower particle confinement. Main species confinement appears essentially the same as L-mode, based on unchanged density profiles and little or no change in Dα. More quantitative assessments, over a wide range of I-mode parameters, have been made of impurity confinement time, using injected impurities from a Laser Blowoff Injection system and time resolved spectroscopic measurements of the decay time [20]. Figure 7 shows that τP (for Ca) is indeed at the levels of L-mode, typically 15–40 ms, and can be nearly an order of magnitude below that of even EDA H-mode which is a relatively low particle confinement H-mode regime. ELM-free H-modes can have confinement times over 1 s. τP for Mo in I-mode is very similar to that of Ca. This is important since accumulation of high Z impurities, a known serious issue for H-modes with metal PFCs [21] and thus a concern for ITER, is avoided. Frequent boronization, which is essential for high confinement H-modes on C-Mod, is not needed or used for I-mode experiments. Fueling efficiency and main species particle transport are more difficult to quantify, since following initial gas puffing the source is typically dominated by wall fueling, which varies with machine conditions and heating, in both I-mode and H-mode. In some discharges D2 or He puffs are added to enable CXRS or gas puff imaging (GPI) diagnostic measurements. In H-mode, as documented by Hughes [22], the density following the L–H transition is largely fixed by the strong particle barrier. It responds only weakly to additional puffing or pumping, particularly at high current. I-mode density control is more similar to L-mode, such that a range of densities can be achieved for given Ip [23].

Figure 7. Particle confinement time of injected Ca, versus normalized energy confinement time H98,y2, for a subset of C-Mod L, I and EDA H-mode discharges. Reproduced courtesy of IAEA. Figure from [20]. Copyright 2015 IAEA.
Download figure:
Standard image High-resolution imageFigure 7 also shows that the normalized energy confinement τE is significantly higher than L-mode and comparable to EDA H-mode; H98,y,2 often exceeds 1.0. The range of values indicates however that the τE scaling is somewhat different than τ98,y2 [24]. One important difference is that degradation with input power is much weaker; stored energy continues to increase near linearly with input power as shown in figure 8. τ98,y2, in contrast, scales as P−0.7, so that H98 values in I-mode increase with input power. For example in the set of discharges shown it is about 0.8 for the lowest power discharges, just above the L–I threshold, and up to 1.15 at the highest powers. Pedestal temperatures and pressures scale similarly with power. This lack of saturation with power is consistent with the pedestal MHD stability, as discussed further in the following section, and with stiff temperature profiles.
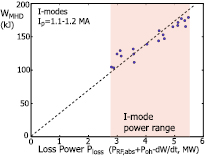
Figure 8. Stored energy versus loss power for a set of I-mode discharges with near-constant field (5–6 T) and current (1.1–1.2 MA).
Download figure:
Standard image High-resolution imageGiven that I-mode is a distinct confinement regime, it is likely that other dependences (e.g. on density, current, field) are also somewhat different. An initial regression on a large I-mode dataset, mainly at BT = 4–6 T, gave τE,Imode = 0.014  (Ip in MA, BT in T,
  in 1020 m−3, P in MW) [25]. However, given the variations in power to access the I-mode, it is possible that correlations between these parameters (e.g. power and field) bias these results. Very recent experiments have been conducted to scan separately each parameter, as well as key dimensionless parameters, and determine the τE dependence. Some results from these dimensional scans are shown in figure 9. A density scan, at BT = 5.8 T, Ip = 1.1 MA and with 3.0 MW ICRF (Ploss = 2.95 ± 0.1 MW) gave τE(s) = 0.047 ± 0.001 (
 )0.41±0.13 (figure 9(a), where nref = 1.41 × 10²⁰ m−3), significantly stronger than the prior scaling. A limited current scan at the same field and RF power, with fixed
  = 1020 m−3, resulted in τE(s) = 0.038 ± 0.02 Ip (MA)0.36±0.2 (figure 9(b)). In this case Ploss varied from 2.8 to 3.3 MW due to the change in ohmic power. This current dependence is somewhat weaker than was found from the large dataset. Such discrepancies could result for example from the correlation of density and current in our dataset; as with other confinement regimes, natural operating density tends to increase with current in I-mode. With ICRF heating at fixed frequency, scanning the toroidal field requires varying the heating scheme and/or location. The differences in absorption efficiency with minority species discussed above could lead to large systematic uncertainty in confinement scaling with BT. A limited BT scan from 4.8 T to 5.8 T, varying D(H) heating location from high field side to low field side, suggests quite weak or no dependence (figure 9(c)). However, the narrow range and uncertainties make a regression not statistically meaningful. Initial studies of I-mode confinement on ASDEX Upgrade, expressed in terms of the H98 scaling, have recently been reported by Ryter [12]. This also finds a positive dependence on density, and a weak power degradation in the case of steady I-mode; it is noted however that some AUG I-modes evolve at constant power. Given the importance of confinement scaling to predict the performance of I-mode on other devices, including ITER, it is clear that a carefully constructed and analysed dataset, across devices, will be valuable. This will also enable derivation of size scalings, which is not straightforward from a single tokamak. Such an activity is now beginning, through the Transport and Confinement ITPA group. Another approach being pursued is to analyse C-Mod experiments which attempted to vary key dimensionless parameters ρ*, ν* and β independently, keeping other variables fixed. If one assumes that confinement depends only on such parameters, size scalings can be inferred from Kadomtsev constraints [26]. Such analysis is more complex and will be reported separately.

Figure 9. Dependences of energy confinement time in single parameter scans, all at near constant input power (3 MW ICRH). (a) Density scan, at Ip = 1.1 MA, BT = 5.8 T. (b), current scan, at ne = 1020 m−3, BT = 5.8 T. (c) Toroidal field scan, at ne = 1020 m−3, 1.1 MA.
Download figure:
Standard image High-resolution imageThe C-Mod team is also investigating core turbulence and transport in I-mode, comparing to L-mode and H-mode, and to gyrokinetic simulations with the GYRO code. Linear simulations find that ITG is dominant in both L-mode and I-mode, across the bulk of the core plasma. Across some L-I transitions, there is a reduction in the linear growth rate in the core plasma with little change in E × B shearing rate [27]. In other cases, comparing L-mode and I-mode core plasmas, linear growth rates can be similar [28, 29], with E × B shear higher in I-mode, and of course, the linear growth rates and E × B shearing rates vary with radius as well. Observations thus far suggest that E × B shear suppression of core turbulence in I-mode plays a role in the measured reduction of long-wavelength density and temperature fluctuation amplitudes, by 30–70% [27]. Core electron thermal diffusivity from power balance can also decrease in I-mode by about a factor of two. Recent results from nonlinear GYRO simulations and new measurements of the perturbative electron thermal diffusivity [30] suggest that high-k electron-scale ETG turbulence and multiscale effects are important in the core of I-mode plasmas, as has been shown for L-mode plasmas [31]. Transport is found to be more 'stiff' in I-mode than L-mode, resembling the situation in H-mode plasmas. Ion scale nonlinear GYRO simulations are able to match ion heat flux, but for most radii underpredict electron heat flux, electron temperature fluctuations and perturbative thermal diffusivity [29]. These results can help to unify the observed changes in core turbulence and transport, but further core transport validation studies are needed to understand better the changes in transport, including the particle transport, which is currently under active investigation using turbulent transport models.
4. Pedestal and transition physics
Given the core profile stiffness, the pedestal in I-mode is critical to determining the improved core confinement, as is also the case for H-mode. Steep temperature pedestals form at the L–I transition in both Te and Ti. Consistent with, and likely causing, the stored energy increase, Tped also increases nearly linearly with input power. For BT in the 5–8 T range, Tped, taken typically at 95% poloidal flux, can be over 1 keV at high current and power, which is higher than typical for steady H-modes on C-Mod. Pressure pedestal widths, determined by tanh fits, are however somewhat larger than in H-modes, up to 5% of the minor radius and exceeding the  scaling which has been widely determined for the Type I ELM regime on several tokamaks [23, 32]. This, combined with the lack of an increased density pedestal, gives lower pressure gradients for given Tped. Stability analysis using ELITE shows the pedestal to be well below the peeling-ballooning stability boundary, even considering transient steepening due to sawtooth heat pulses [23]. In contrast, ELMy H-modes are typically near the stability boundary, and pedestal pressure increases only weakly with increased input power. The MHD stability in I-mode is consistent with the lack of such saturation in pedestal and global pressure at high powers and with the absence of ELMs, which are two of the key benefits of the I-mode regime. With sufficient power, it should be possible to further increase pedestal pressure until a stability limit is reached. Pedestals are also away from expected kinetic ballooning mode (KBM) thresholds, and other turbulent modes may well dominate the transport. The pedestal scalings of the EPED model thus should not be expected to apply to the I-mode regime.
Good progress is also being made on understanding the pedestal physics of the I-mode regime, through detailed measurements of fluctuations and flows and using simulations. Gas puff imaging (GPI) measurements show that both fluctuating flows at the GAM frequency and a broad high frequency fluctuation termed the Weakly Coherent Mode exist simultaneously in I-modes, usually appearing as the pedestal Te increases at the L–I transition [9]. The two modes interact strongly and exchange energy, with the GAM apparently helping to broaden the WCM spectrum. It is possible that they also play a role in the reduction of turbulence at other frequencies, though this is less clear. The WCM had previously been documented on several other diagnostics of density, Te and magnetics [1, 7, 8]. Recent measurements utilizing both GPI and CXRS data localize the WCM to the outer shear layer of the Er well [33]. Recent observations on AUG are generally consistent [10], though in this case the GAM occurs also in L-mode. Given that the GAM and WCM appear to be integral to the I-mode regime, conditions for both are likely related to local threshold conditions for the L–I threshold. The WCM has been observed to correlate with particle transport [34]. A pure GAM, as a radial electrostatic mode causing a velocity fluctuation on a flux surface, would not be expected to directly cause transport but might modulate turbulent fluxes. Fluctuations at about the GAM frequency have also been observed on reflectometry, GPI and Langmuir probes. Further investigation of the physics and roles of both the WCM and GAM-like fluctuations will be important in understanding the I-mode regime.
To this end, simulations of a fully developed C-Mod I-mode pedestal have been undertaken with the BOUT++ code [35, 36], using a six-field two-fluid model, for a relatively high density case with BT = 5.8 T. Simulations show the pedestal is linearly unstable to both drift Alfven waves (DAW) and resistive ballooning modes. Nonlinear BOUT++ predictions are in agreement with many observed features of the WCM [37, 38]. A broad peak in density fluctuations is predicted in the electron diamagnetic direction, at about the same central frequency (in this case 350 kHz) and pedestal location as reflectometer measurements. Importantly, simulations predict lower thermal diffusivity than particle diffusivity, consistent with the key feature of I-mode. Extensions to include zonal flows and GAMs are in progress.
Prior work, again using GPI measurements, has shown that transfer of energy from turbulence to zonal flows is a key component in transitions from L-mode to H-mode [39]. Consistent results have been reported on several other devices [40–42]. An exciting new result is that this transfer rate varies with ion B × ∇B drift direction and is roughly a factor of two lower in the configuration with drifts away from the x-point [43]. This difference may help explain the higher power threshold, and the window for I-mode, in this 'unfavourable' configuration.
Perhaps the most important, and poorly understood, issue for I-mode transition physics is the conditions and mechanism for transition from an I-mode to an H-mode, with full suppression of turbulence and prompt development of a particle transport barrier. I–H transitions set the operational limits for the I-mode regime. While they often occur when power is increased beyond a certain limit (see examples in figure 3), I–H transitions can also occur when density is increased. An example is shown in figure 10. In this case an L–I transition was triggered at 0.74 s, at line average density 1.45 × 10²⁰ m−3, and a high pressure and confinement I-mode with 1 keV edge pedestal was heated with 4.5 MW ICRH. The density was then increased by external gas fueling to 2 × 10²⁰ m−3, beyond the range for which L–I transitions typically occur. However, an I–H transition occurred at 1.13 s, in this case preceded by a decrease in ICRF power and pedestal temperature. In other cases I–H transitions have occurred at constant power. Density and power scans have found that the upper limit to I-mode density increases with input power, as shown in figure 11. For these high density cases a 'power threshold' does not adequately represent the I–H transition conditions. An initial assessment of local conditions suggests that pedestal collisionality  plays a role, with lower
  plasmas reaching higher pedestal pressure in I-mode prior to a transition. If confirmed over a wider set of discharges, this would be a positive result for burning plasmas, which are expected to have very low ν*. Analysis of the details of pedestal flows and fluctuations should also give insight into the physics mechanisms of I–H transitions, as it has previously for L–H transitions.
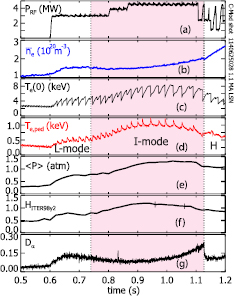
Figure 10. Time traces for a discharge (1140625028) similar to figure 1 but with gas fuelling during I-mode. Density (b) is increased 30% while maintaining core pressure (e) and high confinement (f). An I–H transition, evidenced by sharply increasing ne and drop in Dα(g) occurs at 1.13 s, following a decrease in ICRH power (a).
Download figure:
Standard image High-resolution image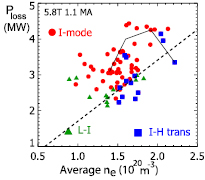
Figure 11. Loss power versus density for a set of I-mode discharges with BT = 5.8 T, Ip = 1.1 MA. I–H transitions (blue squares) tend to occur at higher density for given input power, and are often not at maximum input power for given density. The time trajectory of the fuelled I-mode in figure 10 is shown.
Download figure:
Standard image High-resolution image5. Magnetic balance and divertor power handling
Perhaps the greatest challenge for future fusion devices, in any transport regime, is integration with divertor solutions. While elimination of transients due to ELMs and lack of impurity accumulation with I-mode are major advantages, stationary SOL heat flux can still be high. When operating in significantly unbalanced configurations with ion B × ∇B drift away from the active X-point, heat flux tends to be largest on the inner divertor leg, with typically a 70:30 in:out power sharing [44]. Recent experiments have explored the response to changing dRsep, the difference between upper and lower X-points when mapped to the outer midplane. For operation with reversed BT and Ip, negative dRsep corresponds to drifts away from the X-point. It was found that dRsep ⩽ −3 mm was required to reliably produce L–I (instead of L–H) transitions. However once I-mode is accessed, it is possible to maintain the regime in near-DN configurations, with dRsep as small as −1 mm; values closer to zero (double null) reproducibly resulted in I–H transitions, or in some cases back transitions to L-mode. H-modes following such transitions tend to have exceptionally high confinement, with H98 often >2, but are ELM-free and transient, accumulating impurities. An example of a steady I-mode with dRsep = −2.5 mm is shown in figure 12. We note that the SOL heat flux scale length λq is typically 1–2 mm on C-Mod [45].
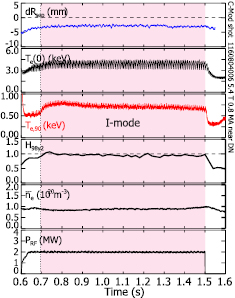
Figure 12. Example of a steady I-mode discharge close to double null, with Ip = 0.8 MA and BT = 5.4 T. dRsep (top panel) is −2.5 mm.
Download figure:
Standard image High-resolution imageFigure 13, for a set of similar I-mode discharges, shows that in these near-DN configurations, the in–out balance of integrated thermal flux shifts predominantly to the outer legs. As dRsep approaches zero, the up–down balance becomes more evenly shared; at dRsep = −1 mm approximately 60% of the power flux is on the lower outer leg and 30% on the upper, with the remaining 10% on the inner strike points. Compared to larger dRsep, the significantly reduced power flux to the inner divertor may ease the power handling challenge; the outer divertor targets are at a larger major radius, giving a larger total area to spread the power, and have much more room for implementing promising advanced divertor concepts. The challenge for reactors is, however, likely to remain great. While low Z impurity seeding (N2 or Ne) has been demonstrated to reduce heat flux and divertor temperatures, experiments have not yet succeeded in obtaining divertor detachment without an I–L transition. Details of these seeding studies, and comparisons to divertor power flux in other regimes, will be reported separately. Recent simulations which have shown that, for device parameters and plasma profiles quite similar to C-Mod I-modes, advanced divertor concepts can more readily attain a stable X-point detached divertor condition while not affecting pedestal conditions are encouraging, and suggest a potential solution for this key issue [46].
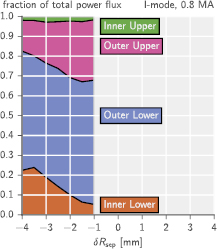
Figure 13. Relative fractions of power flux to the four divertor legs (inner, outer, upper, lower) for a set of I-mode discharges with Ip = 0.8 MA and BT = 5.4 T. These measurements of sheath heat flux were made by divertor Langmuir probes.
Download figure:
Standard image High-resolution image6. Extrapolation to future fusion devices
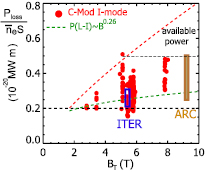
In many respects I-mode, with its low particle confinement, high energy confinement and lack of ELMs, is the ideal regime for a fusion reactor, if it can be obtained robustly in the needed conditions, and sustained without transitions to H-mode or L-mode. The C-Mod team has thus been exploring prospects for extrapolation to larger fusion devices, including ITER. Prior intermachine studies indicated that the size scaling of L–I thresholds is at most linear with surface area S (see figure 16 in [6]). Scaling C-Mod values of Ploss/( S), which are also consistent with thresholds on AUG and DIII-D at ~2 T [6], we predict ITER at 5.3 T, with S = 700 m2, would need about 70 MW to enter I-mode at 5 × 10¹⁹ m−3. This is marginal with respect to planned heating, however if size dependence proves weaker, as would also be consistent with the current data, or there is a reduction with atomic mass as for the L–H scaling, P(L–I) could be lower. The results presented here show that the power ranges increases with magnetic field, or a closely related parameter; we note that dimensionless parameters on AUG were quite similar to those on C-Mod [6] so would not readily explain the narrower power range. Figure 14 compares the expected power range for ITER to the demonstrated I-mode operating space on C-Mod, which includes the same magnetic field and higher normalized power. If I-mode is accessed, it should be possible to remain in I-mode without transition to H-mode and to achieve and remain in I-mode at the full design fusion power, provided that density can be sufficiently increased. As noted above, fueling during I-modes has been demonstrated on C-Mod but a limit in density exists which is not well understood. The upper bound of the blue square would correspond to a total power of 150 MW (including Pα = 100 MW), at 0.7 × 10²⁰ m−3. While initial projections including alpha-heating indicated a trajectory for such discharges (see figure 8 of [47]), more complete time dependent simulations should be carried out to establish a route to such an operating point. Given the weak BT dependence of the L–I threshold, I-mode may be more difficult to access in the reduced BT non-nuclear operating phases of ITER, when less heating power is planned and α power will not contribute.
Figure 14. Loss power, normalized by density and surface area, for future burning plasma experiments ITER (blue) and ARC (brown), compared to the demonstrated operating space for C-Mod I-modes.
Download figure:
Standard image High-resolution image
Accessibility for proposed compact, high B fusion reactors such as ARC [14], which has design BT = 9.2 T and R = 3.3 m, is even more favorable. In this case projected P(L–I) is 46 MW at 5 × 10¹⁹ m−3. The brown rectangle in figure 14 shows that maintaining the target Pfus (525 MW) at ne ~1.3 × 10²⁰ m−3 would be within the power range of I-modes demonstrated at 8 T, which did not encounter any I–H transitions. Further experiments on other devices are of course required to confirm the size and parameter scalings for I-mode, as discussed below.
7. Conclusions and needs for future research
The I-mode regime of confinement has now been established on Alcator C-Mod as extremely robust and reliable. In recent campaigns a significant fraction of our operation has been in this regime, with I-modes established over nearly all of the magnetic fields and currents possible in C-Mod (Ip 0.55–1.7 MA, BT 2.8–8 T) using a configuration with B × ∇B drift away from the X-point. The threshold power to access I-mode is found to have at most a weak dependence on magnetic field. In contrast, the power range for maintaining I-mode increases with magnetic field. While at 2.8 T small increases in power lead to I–H transitions, many discharges at 5–6 T remain in I-mode at our maximum heating of 5 MW ICRF, and at 8 T no transitions to H-mode have been observed in this configuration. Particle confinement is at L-mode levels, leading to steady conditions without impurity accumulation in this metal walled device. In contrast to H-mode, frequent boronization is not required to obtain steady conditions and q95 can be as low as 2.4. These features make I-mode an attractive regime for future devices. Energy confinement is generally high, and can exceed H-mode scalings. Importantly, τE does not degrade strongly with input power. Parameter scans have recently been conducted. Taking C-Mod data together with results from other tokamaks, it should be possible to establish a new I-mode confinement scaling for extrapolation to future devices. An I-mode database is planned as an ITPA activity, following up on recent multidevice studies [6]. I-modes on larger devices such as JET and JT60-SA would be particularly valuable to establish a size scaling for τE. Planned experiments on WEST, MAST-U and NSTX-U will provide information on aspect ratio dependences, which are currently unknown. Similarly, multi-device studies of L–I and I–H threshold conditions are needed to confirm conditions for access; the I–H transition is complex and has interrelated dependencies on both power and density. While it is clear that increased BT is advantageous for I-mode, experiments with different sizes and parameters would help distinguish between dependences on absolute magnetic field and related dimensionless parameters.
Good progress has also been made in documenting and understanding pedestal and core transport physics at the transitions between regimes, and in the I-mode, using detailed profile, turbulence and flow diagnostics. Pedestals are found to be robustly stable to peeling-ballooning modes, consistent with the observed lack of ELMs which is another highly attractive feature of the regime. Both a broad, high frequency 'weakly coherent mode' and a GAM fluctuation coexist in the pedestal and exchange energy [9]. Nonlinear simulations of an I-mode pedestal with BOUT++ reproduce many features of the WCM [38]. Very consistent results are observed on ASDEX-Upgrade [10], and it will be important to study this complex physics on other tokamaks and using multiple simulation codes; collaborative efforts in both regards are planned. Comparison of predicted turbulence growth rates with the high measured E × B shearing rates will be of particular interest. The I-mode regime also provides an interesting test of core transport models, with observed and modelled stiffness similar to the H-mode regime and a reduction in core turbulence. More work is needed for a complete picture of particle transport; simulations for other tokamaks with different parameters would again be valuable.
Another important challenge is understanding and ameliorating the divertor heat flux in the I-mode regime. Here the lack of ELMs, which eliminates transient heat pulses, is an advantage over H-mode, and the recent demonstration of I-modes in near-balanced configuration enables better sharing of power fluxes. Further work is needed on seeding and detachment. Simulations of integration of I-mode with advanced divertors are promising.
In summary, the I-mode research on Alcator C-Mod in the past few years has significantly improved the prospects and experimental basis for considering this operating regime for future fusion devices. While experimental operations on C-Mod ended in September 2016, a wealth of detailed measurements was obtained which the Alcator team will be analysing for some time. Our goal is to also obtain a more complete understanding of the physics which enables the intriguing, and in many respects advantageous, separation of particle and energy transport.
Acknowledgments
The efforts of the entire Alcator C-Mod operation team were essential to this work and are greatly appreciated. Supported by the U.S. Department of Energy, Office of Science, Office of Fusion Energy Sciences, using User Facility Alcator C-Mod, under Award Number DE-FC02-99ER54512-CMOD and by National Natural Science Foundation of China Grant No. 11405217.