
Abstract
The clinical efficacy of deep brain stimulation (DBS) for the treatment of movement disorders depends on the identification of appropriate stimulation parameters. Since the mechanisms of action of DBS remain unclear, programming sessions can be time consuming, costly and result in sub-optimal outcomes. Measurement of electrically evoked compound action potentials (ECAPs) during DBS, generated by activated neurons in the vicinity of the stimulating electrode, could offer insight into the type and spatial extent of neural element activation and provide a potential feedback signal for the rational selection of stimulation parameters and closed-loop DBS. However, recording ECAPs presents a significant technical challenge due to the large stimulus artefact, which can saturate recording amplifiers and distort short latency ECAP signals. We developed DBS-ECAP recording instrumentation combining commercial amplifiers and circuit elements in a serial configuration to reduce the stimulus artefact and enable high fidelity recording. We used an electrical circuit equivalent model of the instrumentation to understand better the sources of the stimulus artefact and the mechanisms of artefact reduction by the circuit elements. In vitro testing validated the capability of the instrumentation to suppress the stimulus artefact and increase gain by a factor of 1000 to 5000 compared to a conventional biopotential amplifier. The distortion of mock ECAP (mECAP) signals was measured across stimulation parameters, and the instrumentation enabled high fidelity recording of mECAPs with latencies of only 0.5 ms for DBS pulse widths of 50 to 100 µs/phase. Subsequently, the instrumentation was used to record in vivo ECAPs, without contamination by the stimulus artefact, during thalamic DBS in an anesthetized cat. The characteristics of the physiological ECAP were dependent on stimulation parameters. The novel instrumentation enables high fidelity ECAP recording and advances the potential use of the ECAP as a feedback signal for the tuning of DBS parameters.
Export citation and abstract BibTeX RIS
1. Introduction
Deep brain stimulation (DBS) is a surgical therapy to treat medically refractory movement disorders, such as essential tremor (ET) [1, 2] and Parkinson's disease (PD) [3], as well as other neurological disorders including epilepsy [4]. The DBS electrode is implanted in the ventral intermediate (Vim) nucleus of the thalamus for tremor and the subthalamic nucleus (STN) or internal segment of the globus pallidus (GPi) for PD. An implantable pulse generator (IPG) is connected to the electrode via a subcutaneous wire and delivers high frequency stimulation to the targeted brain region. Following implantation, the parameters of stimulation, including voltage, frequency and pulse width are selected to produce symptom suppression [5].
Current approaches to the selection of stimulation parameters are a significant clinical burden and improper programming may deprive patients of the optimal benefits of DBS. There are over 25 000 available combinations of stimulation voltage, frequency and pulse width in a typical IPG (Medtronic Soletra 7426), but few data describing the relationships between stimulation parameters and clinical outcomes [5]. Furthermore, because symptoms do not respond immediately or uniformly to DBS [6], it is not feasible to measure the steady-state symptom response to a wide range of stimulation parameters, as required to identify the most effective settings. The time course of response to DBS is on the order of seconds for tremor [7], but minutes for bradykinesia [6], making programming more challenging for the latter. Moreover, it is unclear how to select parameters when there are no immediate or overt responses to stimulation, such as for epilepsy. Consequently, there are typically a large number of parameter adjustments necessary at follow-up visits, making programming time consuming and costly [8], and many patients spend appreciable time with sub-optimal DBS treatment [9, 10].
Measuring neural activity during DBS may provide a means for rational selection of stimulation parameters. One strategy records ongoing EEG-like brain rhythms known as local field potentials (LFPs), which are µV-level signals reflecting synchronized neural activity [11]. For example, elevated theta oscillations (4–7 Hz) are observed within the thalamus of ET subjects at the characteristic frequency of pathological tremor [12], and elevated beta frequency power (13–35 Hz) is present within the STN and GPi of PD subjects [13]. LFPs are modulated following treatment with DBS, suggesting that clinical efficacy is dependent on the disruption of pathological synchronization [14, 15]. However, a direct causal link between the LFP activity measured during DBS and the corresponding motor symptoms has not yet been identified [13].
We propose to record electrically evoked compound action potentials (ECAPs) during DBS, providing insight into the activity of neurons directly affected by stimulation. Each DBS pulse activates an ensemble of neurons near the electrode. Transmembrane currents generated during activation of individual neural elements create voltages that can be recorded from non-stimulating contacts on the DBS electrode. The characteristics of the ECAP are expected to depend on the type and spatial extent of neural element activation during DBS. The ECAP could thus provide signatures of clinical effectiveness that correspond to sufficient activation of the appropriate type(s) of neural elements [16] and could be used to tune stimulation parameters during DBS programming sessions. An analogous ECAP recording strategy has been used during cochlear nerve stimulation as a feedback signal for programming cochlear implants [17, 18]. The ECAP could also be used as a feedback control signal in closed-loop DBS systems that provide automated, periodic tuning of stimulation parameters to respond to patient needs.
The purpose of this study was to develop and evaluate instrumentation to record ECAPs during DBS. Recording the ECAP is challenging due to the large stimulus artefact that can cause amplifier saturation and mask the ECAP signal [19, 20]. Available techniques to remove the stimulus artefact are inadequate for ECAP recording during DBS. Several techniques rely on signal-processing strategies, including curve fitting [21], template subtraction [22], polarity averaging [23] and masker-probe paradigms [24]. Although several of these strategies have been used with some success in cochlear nerve ECAP recordings [24–26], they are performed after the amplification stage and thus limit the gain that can be used without amplifier saturation. Hardware methods are also used to reduce the artefact, including signal filtering for DBS LFP recordings [19], but this requires separation of the artefact and physiological signal in the frequency domain. Alternatively, sample-and-hold amplifiers [27] have enabled artefact-free recording from stimulating electrodes within 2 ms after the stimulation pulse [28, 29], though have exhibited inconsistent performance [30].
We sought to develop instrumentation that could reduce the artefact during the amplification stage and thereby enable high gain recording of ECAPs. The performance of this instrumentation was assessed through in vitro experiments, in which mock ECAPs (mECAPs) were recorded in the presence of a stimulus artefact to characterize the input–output fidelity of the system. The instrumentation was then used to demonstrate that ECAPs could be recorded in vivo from the thalamus of the cat, with signal characteristics dependent on stimulation parameters. Finally, an electrical circuit equivalent model was developed to determine both the sources of the stimulus artefact recorded during the in vitro and in vivo experiments and the mechanisms of artefact reduction by the instrumentation. Preliminary results of this study were presented in a conference paper [31].
2. Methods
The design objective for the instrumentation was to make high fidelity ECAP recordings in the presence of a stimulus artefact. We used differential recordings from non-stimulating contacts on the DBS electrode to eliminate the need for additional recording electrodes and ensure that the recording contacts were near the neurons activated by stimulation. We sought to limit the artefact magnitude such that sufficient amplifier gain could be used without saturation, and to limit the artefact duration to avoid distorting short latency ECAPs. The instrumentation combined battery-powered biopotential amplifiers in a serial configuration with diode clamps, amplifier blanking and a relay at the stimulator. In vitro and in vivo experiments were conducted to characterize the ability to limit the size of the stimulus artefact, enable higher gains without amplifier saturation and record ECAPs with high fidelity.
2.1. In vitro experimental setup
We used an in vitro setup to reproduce the experimental conditions of the DBS electrode within the brain (figure 1(a)) [19]. A DBS electrode was immersed in a saline bath (137 mM NaCl) and was used to deliver monopolar or bipolar stimulation, with two of the non-stimulating contacts connected to the recording system. Two DBS electrodes were tested: a clinical DBS electrode (Model 3387, Medtronic) and a custom mini DBS electrode (NuMed). The clinical DBS electrode had a lead body diameter of 1.27 mm, and four contacts of 1.5 mm height separated by 1.5 mm spacing. The mini DBS electrode, which was also used in the subsequent in vivo experiment, had a lead body diameter of 0.625 mm, and four contacts of 0.5 mm height separated by 0.5 mm spacing. Each DBS pulse triggered generation of a mECAP, synthesized by a waveform generator (Model 33120A, Agilent) as a single cycle of sinusoidal current and delivered by a pair of tungsten microelectrodes near the DBS electrode. Given that the bulk of the power in the physiological ECAP frequency spectrum is in the 100Hz to 4 kHz band, we used a 4 kHz mECAP sinusoid (0.25 ms duration), which would be most challenging to record with high fidelity due to the short signal duration. A helical stainless steel wire was used as the counter electrode for monopolar stimulation configurations, and a Ag/AgCl electrode (Model RE-5B, BASi) was used as the recording circuit reference. A custom program written in LabView (National Instruments) controlled delivery of DBS pulses, trigger pulses for the mECAP, timing of digital outputs to operate components in the recording instrumentation and sampling of the signal (80 kHz sampling rate).

Figure 1. Schematic of the experimental setups used to record ECAPs during DBS. (a) For in vitro testing, the DBS electrode, tungsten microelectrodes, Ag/AgCl recording circuit reference electrode and counter electrode were immersed in a saline bath. The microelectrodes were positioned on either side of the DBS electrode to deliver the mECAP. (b) For in vivo testing, the mini DBS electrode was implanted through a guide tube into the VL nucleus of the thalamus in an anesthetized cat. We used a stainless steel retractor placed in the ipsilateral chest muscle as the counter electrode, and a Ag/AgCl electrode placed on the back of the neck as the recording circuit reference.
Download figure:
Standard image2.2. Testing artefact reduction and recording fidelity
Using the in vitro setup, we recorded the mECAP signal in the presence of a stimulus artefact across various stimulation parameters, DBS contact configurations and recording system configurations. Charge-balanced, biphasic DBS was applied with clinically relevant stimulation parameters of 1–3 V amplitude, 50–500 µs/phase pulse width (symmetric and asymmetric pulses), 100 Hz frequency and cathodic-phase first polarity. Three different contact configurations were used for stimulation and recording, with contacts designated 0-1-2-3 in the ventral-to-dorsal direction: monopolar stimulation with either symmetrical recording contacts (monopolar symmetric: 1+ stimulation, 0+/2− recording) or asymmetrical recording contacts (monopolar asymmetric: 0+ stimulation, 1+/2− recording), as well as bipolar stimulation (bipolar: 1+/2− stimulation, 0+/3− recording). The parameters for the mECAP were 0.1 to 2 ms latency and 0.1 to 0.5 mA peak-to-peak (P–P) input amplitude, which generated recorded amplitudes of 0.18–0.88 mVP–P in the monopolar symmetric configuration. We recorded these signals both with and without the circuit components used to suppress the artefact, as well as with a single commercial biopotential amplifier (SR560, Stanford Research Systems). The extent of artefact reduction between recording systems was quantified by the change in amplifier gain that could be achieved without amplifier saturation and by distortion of the mECAP signal.
The signals recorded across these stimulation and recording conditions were analysed to quantify mECAP distortion. For each trial, we collected a raw data set consisting of stimulus artefact and mECAP measurements for 10 s. Due to the small magnitude of the mECAPs, stimulus-triggered averaging was applied 64 times to improve the signal-to-noise ratio. The distortion of the recorded mECAP sinusoid was measured against an ideal sinusoidal voltage with the same duration and latency (accounting for phase shift) and with the ideal sinusoid magnitude fit using a least-squares approach. The sampling frequency of the ideal sinusoid was matched to that of the recorded sinusoid so that pointwise analysis could be performed. The magnitudes of both the ideal and recorded sinusoids were then normalized to the amplitude of the ideal sinusoid to avoid bias against larger magnitude mECAPs. Finally, distortion was measured as the root-mean square error between the magnitude-normalized recorded and ideal sinusoids. This value was divided by the number of samples in the sine wave to obtain an average distortion per sample (DPS) value.
2.3. In vivo experimental setup and ECAP recording
We investigated the feasibility of recording in vivo ECAPs during thalamic DBS in an adult cat (figure 1(b)). Animal care and experimental procedures were reviewed and approved by the Institutional Animal Care and Use Committee of Duke University. The animal was initially anesthetized with ketamine HCl (35 mg kg−1 i.m.) and maintained with alpha chloralose (65 mg kg−1 i.v. supplemented at 15 mg kg−1 as needed). Artificial respiration maintained end tidal CO2 at 3–4%, the core temperature was maintained at 38 °C with heating pads, the arterial blood pressure was monitored with a catheter in the carotid artery, and fluids were continuously administered (10–15 ml kg−1 h−1).
The ventrolateral (VL) nucleus of the thalamus was targeted for implantation of the mini DBS electrode. The VL thalamus is the feline homologue of the Vim thalamus in primates [32]. The anesthetized cat lay prone with the head fixed in a stereotactic frame. Following a craniotomy, the VL thalamus was located using the stereotactic technique [32, 33] in conjunction with single-unit microelectrode recordings. Neurons in the dorsal region of the VL thalamus exhibited increased activity in response to passive movement of the contralateral hindlimb [32]. Once the location of the VL thalamus was identified, a guide tube was inserted vertically into the brain using a micromanipulator, and the mini DBS electrode was inserted through the guide tube into the VL thalamus. To confirm that the electrode was correctly placed in the VL thalamus, we recorded evoked responses from two contacts on the DBS electrode (0+/2−) during electrical stimulation of the contralateral sciatic nerve (biphasic pulses of 1 mA amplitude, 7 Hz frequency and 50 µs pulse width).
The ECAP generated in vivo by DBS was measured across a range of clinically relevant stimulation parameters. Charge-balanced, biphasic DBS was applied at 1–3 V amplitude, 10 or 100 Hz frequency, 50 or 100 µs/phase pulse width and both cathodic- and anodic-phase first polarities. The two contact configurations tested were monopolar symmetric (1+ stimulation, 0+/2− recording) and monopolar asymmetric (3+ stimulation, 2+/1− recording). A stainless steel retractor placed in the ipsilateral chest muscle acted as the counter electrode and a Ag/AgCl electrode (Model EL504, Biopac Systems) placed on the back of the neck was used as the reference electrode. To evaluate the performance of the instrumentation in vivo, we recorded ECAPs both with and without the circuit components used to suppress the artefact, and with the conventional amplifier. The animal was killed by intravenous injection of Euthasol (Virbac), and postmortem recordings were made at several time points to confirm the biological origin of the antemortem ECAPs. During all trials, ECAPs were recorded for 10 s, with trials separated by 10 s, and stimulus-triggered averaging was applied 64 times.
2.4. Histology
Following completion of ECAP recording, the anatomical location of the mini DBS electrode was determined. The electrode was removed and the animal was immediately perfused transcardially with saline followed by 10% formalin. The hemisphere of the brain containing the electrode path was excised and post-fixed in 10% formalin for 24 h at 4 °C. Subsequently, the tissue sample was placed in 30% sucrose at 4 °C until it sank, cryoprotected with optimal cutting temperature compound (Tissue-Tek, Sakura) and frozen at −80 °C [34]. The sample was cryosectioned into 50 µm coronal sections and mounted on glass slides. The sections were defatted and Nissl stained with 0.1% cresyl violet. Finally, the electrode track and nuclei of interest were identified at 2.5× magnification, such that the location of the electrode could be registered to a stereotactic atlas of the cat brain [33].
2.5. Computational model of the stimulus artefact
An electrical circuit equivalent model was developed, using PSpice (Cadence) and Comsol Script 1.2 (COMSOL) finite-element modelling software, to study the sources of the stimulus artefact and mechanisms of artefact reduction by the recording instrumentation. The model included circuit representations of the DBS contact interface, saline or neural tissue medium, DBS voltage source and components of the recording instrumentation (figure 2). The monopolar symmetric configuration was modelled in the electrical circuit equivalent simulations, with biphasic DBS delivered between contact 1 and a return electrode, and contacts 0 and 2 serving as inputs to the recording amplifier. The ac-coupled amplifier had a 100 MΩ, 25 pF parallel input impedance in series with a 0.1 µF capacitor at each input. The electrode–tissue interface at each DBS contact was represented as a parallel capacitance and resistance with values derived from the literature [35], assuming biphasic DBS pulses of 1 mA amplitude.
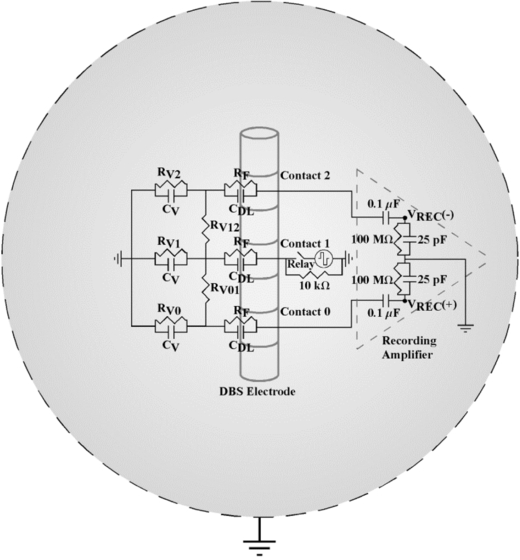
Figure 2. Electrical circuit equivalent model used to calculate the stimulus artefact generated by DBS applied between contact 1 and a spherical return electrode, with differential recordings made from contacts 0 and 2 (monopolar symmetric configuration). The electrode–tissue interface was composed of a parallel double-layer capacitance (CDL) and charge transfer Faradaic resistance (RF). The volume conductor included both the resistance between contacts (RV01 and RV12) and the resistance between each contact and the return electrode (RV0, RV1 and RV2). The capacitance of the volume conductor (CV) was parallel to the resistance between contacts and the return electrode. The input impedance of the recording amplifier was represented in the model, and the model output was the recorded differential voltage (VREC) across the amplifier impedance.
Download figure:
Standard imageThe DBS contacts and return electrode were electrically interconnected by impedance representations of the saline or neural tissue medium. To calculate the bulk resistance of the medium, a three-dimensional model of the DBS electrode within a spherical volume conductor was developed in Comsol Script. The volume of the spherical conductor matched the approximate volume of the saline bath or cat skull, 3502 or 524 cm3, respectively. The saline and neural tissue volume conductors were assumed to be homogenous, represented with conductivities (σV) of 2 [36] and 0.3 S m−1 [37], respectively. The clinical or the mini DBS electrode was represented in the model with the appropriate geometrical dimensions, with contact 1 placed at the centre of the volume conductor, and the conductivities of the DBS contacts and insulated shaft were 5×10⁶ and 1×10⁻¹³ S m−1, respectively [38]. A 1 V boundary condition was specified at one contact surface and the exterior boundary of the volume conductor was grounded. Comsol Script created a variable resolution mesh and solved the Poisson equation using the conjugate gradients method. The resistance was calculated using Ohm's law (R = 1 V/Inorm), where Inorm was determined by integrating the normal current density over the contact surface. The resistance between two DBS contacts was calculated in a similar fashion, with the two contacts of interest set to ±0.5 V and the normal current density integrated across the contact surface.
The permittivity of the medium was incorporated into the circuit model by placing capacitors between the DBS contacts and return electrode, parallel to the volume conductor resistance [39]. Saline and neural tissue permittivity values were estimated from previous studies, having dielectric constants (K) of 75 (for 137 mM NaCl at dc) [40] and 1×10⁴–1×10⁶ (at frequencies below 1 kHz) [41, 42], respectively. The permittivity (ε) was calculated as

where ε0 is the permittivity of free space (8.85×10⁻¹² F m−1). Subsequently, the bulk capacitance was calculated by assuming that the geometry of the DBS contact within the volume conductor was one of two concentric spherical conducting shells. The capacitance of this spherical capacitor was then calculated as

where ra and rb are the radii of the DBS contact and volume conductor, respectively [43]. The radius used for the DBS contact was set such that the surface area of the spherical contact and actual cylindrical contact were matched, and the radius of the volume conductor was identical to that used in the Comsol Script model.
The circuit model was used to solve for the stimulus artefact voltage, measured across the amplifier inputs, resulting from DBS pulses of 3 V amplitude, 100 Hz frequency, 50 µs/phase pulse width and cathodic-phase first polarity. Three models were constructed, in accord with the experimental studies: (i) an in vitro model, with the clinical DBS electrode in the saline bath, and (ii) an in vivo model, with the mini DBS electrode in neural tissue, and (iii) a postmortem in vivo model, with the mini DBS electrode in dead neural tissue. For the postmortem in vivo model, the dielectric constant K was reduced from the antemortem model by 2.7% [44], and the conductivity σV was reduced by 28% [45].
3. Results
We developed an instrumentation system to record ECAPs during DBS, evaluated the performance of the system through in vitro and in vivo experiments, and conducted analysis of an electrical circuit equivalent model to analyse the source of the stimulus artefacts and their reduction by the elements of the instrumentation.
3.1. Instrumentation design
The DBS-ECAP instrumentation used three stages of series amplification and several circuit components to limit the stimulus artefact and enable high fidelity recording of short latency, small amplitude ECAP signals (figure 3(i)). Differential recordings were made from two non-stimulating contacts on the DBS electrode to reduce common-mode noise and served as inputs to a battery-powered preamplifier (A1, SR560), which provided gain and high input impedance. Two additional amplifier stages (A2 and A3, SR560) were placed in series to increase gain further and to filter the signal with a 10 Hz to 10 kHz passband. Anti-parallel diode clamps (1N4154, Fairchild Semiconductor) were placed at the inputs of A2 and A3 to ground the line if the input voltage exceeded approximately ±0.7 V, thereby selectively clipping the stimulus artefact and enabling increased gain without saturation. To achieve further increases in gain, the signal paths in amplifiers A2 and A3 were internally grounded through an opto-isolated CMOS multiplexer (74HC4053), blanking the output for the duration of each stimulus pulse and the subsequent 60 µs. The rapid turn-off time of this CMOS switch (10 µs) ensured that short latency ECAP responses could still be recorded. In addition, a low-resistance, rapid-response PhotoMOS relay (AQV212(A), Panasonic) was used to disconnect the stimulating electrodes between DBS pulses. This limited capacitive discharge from the electrode–tissue interface through the stimulator after each pulse, and thereby reduced the duration of the stimulus artefact [20]. A 10 kΩ parallel resistor was placed across the stimulating electrodes to allow accumulated charge on the stimulating contacts to discharge between pulses. Furthermore, this resistor enabled near-critical damping of the signal recovery from artefact to baseline. The digital pulse controlling the closing of the stimulator relay was turned off 40 µs before the end of the DBS pulse to account for the intrinsic delay of the relay. The digital pulses controlling the amplifier blanking and closing of the stimulator relay were turned on 2 ms before each DBS pulse to account for turn on delays and to discharge any charge remaining on the stimulating electrodes.
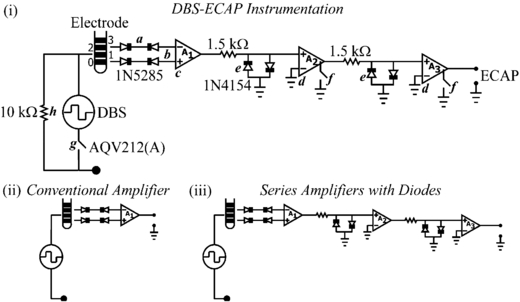
Figure 3. (i) Diagram of the DBS-ECAP instrumentation used for stimulus artefact reduction and ECAP recording during DBS. (a) Anti-series, current-limiting diodes (1N5285) were connected to the DBS lead prior to the amplification stages. (b) Differential recordings were made from two DBS contacts and (c) served as inputs to the preamplifier (A1). (d) Two additional series amplifier stages (A2 and A3) further increased the gain and filtered the signal with a 10 Hz to 10 kHz passband. (e) Anti-parallel diodes (1N4154) were placed at the inputs of A2 and A3. (f) During each stimulus pulse, an opto-isolated CMOS multiplexer (74HC4053) internally grounded the signal path in amplifiers A2 and A3. (g) A PhotoMOS relay (AQV212(A)) disconnected the stimulating electrodes in-between DBS pulses. (h) The parallel resistance enabled any accumulated charge on the stimulating electrodes to discharge between pulses, and enabled near-critical damping of the signal recovery from artefact to baseline. Diagrams of the (ii) conventional amplifier, and (iii) series amplifiers with (anti-parallel) diodes are also provided. Two additional setups that were tested include the series amplifiers without diodes and the series amplifiers with diodes and stimulator relay (not shown).
Download figure:
Standard imageSeveral strategies were implemented to reduce the risk of inadvertent electrical injury to the subject. The front end of each amplifier stage was ac-coupled to prevent exposure to dc voltages. Furthermore, anti-series, current-limiting diodes (1N5285, Central Semiconductor) were placed between the DBS leads and each input to the preamplifier to limit current to less than 0.3 mA in the event of an instrumentation malfunction. Finally, DBS generated by the LabView controller was applied through an optically isolated stimulator (bp isolator, FHC) [46, 47].
3.2. In vitro evaluation of the DBS-ECAP instrumentation
In vitro experiments were conducted to characterize the capability of the DBS-ECAP instrumentation to reduce the stimulus artefact and record mECAPs with high fidelity. Compared to a conventional amplifier (figure 3(ii)), the series amplifier with diodes (figure 3(iii)) reduced the magnitude of the stimulus artefact (figure 4(a)) and enabled an increase in gain by a factor of 25 (table 1). Conversely, the series amplifiers without diodes saturated at the equivalent gain (figure 4(b)). Even with the use of the series amplifiers with diodes, there remained a relatively large amplitude, long duration stimulus artefact with a triphasic waveform shape (figure 4(c)). The use of the series amplifiers with diodes and stimulator relay reduced the magnitude and duration of the third phase of the artefact by limiting capacitive discharge through the stimulator after each pulse. Subsequent addition of amplifier blanking, completing the DBS-ECAP instrumentation, suppressed the first two phases of the artefact (corresponding to the two phases of the DBS pulse). Compared to the conventional amplifier, use of the DBS-ECAP instrumentation enabled an increase in gain by a factor of 1000 to 5000, depending on the contact configuration (table 1). However, the maximum gain used with the DBS-ECAP instrumentation during mECAP recording was limited to that of the series amplifiers with diodes (table 1) to avoid diode clipping of the mECAP and to enable comparison of these two recording system configurations at equal gain.
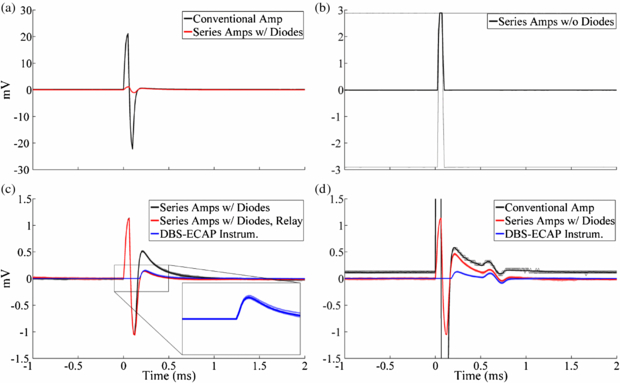
Figure 4. In vitro stimulus artefact waveforms measured with the different recording system configurations. DBS was applied at time 0 with 3 V amplitude, 100 Hz frequency, 50 µs pulse width and cathodic-phase first polarity using the monopolar symmetric configuration. The stimulus-triggered average waveform (bold traces) and single trials (light traces) are shown. (a) Comparison of artefacts recorded with the conventional amplifier and series amplifiers with diodes. (b) Using the series amplifiers without diodes, the amplifiers saturated at the equivalent gain used for the series amplifiers with diodes. This resulted in clipping of the signal at the positive and negative voltage supply rails, and distortion of the stimulus artefact waveform due to the nonlinearity of the amplifier output. Some single trial traces are obscured by overlapping traces. (c) Comparison of artefacts recorded with the series amplifiers with diodes, series amplifiers with diodes and stimulator relay, and DBS-ECAP instrumentation. The inset shows a zoomed view of the stimulus artefact waveform for the DBS-ECAP instrumentation. (d) Comparison of artefacts and mECAPs recorded with the conventional amplifier, series amplifiers with diodes and DBS-ECAP instrumentation. Each DBS pulse triggered a 4 kHz sinusoidal mECAP with 0.18 mVP–P amplitude (0.1 mAP–P input amplitude) and 0.5 ms latency.
Download figure:
Standard imageTable 1. Maximum gain (G) possible without saturation for the different recording system configurations and contact configurations tested in vitro. DBS was applied with 3 V amplitude, 100 Hz frequency, 50 µs pulse width and cathodic-phase first polarity. The gain is also provided at each amplifier stage for recording system configurations with multiple stages, and the total gain is reported in bold.
| Recording System | Monopolar Symmetric | Monopolar Asymmetric | Bipolar |
|---|---|---|---|
| Conventional Amplifier | 100 | 20 | 10 |
| Series Amplifiers | 2500 | 500 | 250 |
| With Diodes | G1 = 100, G2 = 5, G3 = 5 | G1 = 20, G2 = 5, G3 = 5 | G1 = 10, G2 = 5, G3 = 5 |
| DBS-ECAP | 100 000 | 40 000 | 50 000 |
| Instrumentation | G1 = 100, G2 = 200, G3 = 5 | G1 = 20, G2 = 200, G3 = 10 | G1 = 10, G2 = 500, G3 = 10 |
The recording fidelity of the DBS-ECAP instrumentation was examined through the analysis of the distortion of mECAP signals generated by applying a single cycle of a sinusoidal current between two microelectrodes (figure 4(d)). The higher gains enabled by the series amplifiers with diodes provided higher fidelity recording compared to the conventional amplifier. Furthermore, the DBS-ECAP instrumentation limited the magnitude and duration of the third phase of the artefact, thereby reducing the temporal overlap of the artefact with short latency mECAPs and further increasing fidelity. Additional distortion analysis across DBS and mECAP parameters, contact configurations and recording system configurations is provided in the appendix. Use of the mini DBS electrode during in vitro testing generated similar stimulus artefact and mECAP waveforms to those recorded with the clinical DBS electrode (data not shown).
3.3. In vivo ECAP recording
The mini DBS electrode (figure 5(a)) was implanted in the VL nucleus of the cat thalamus for in vivo ECAP recording. The VL thalamus was identified by recording single thalamic neurons that exhibited increased activity during passive contralateral hindlimb movement (figure 5(b)). Accurate implantation of the DBS electrode into the VL thalamus was confirmed subsequently by recording evoked responses from the DBS electrode during electrical stimulation of the contralateral sciatic nerve (figure 5(c)). Postmortem histology confirmed the position of the implanted electrode in the VL thalamus (figure 5(d)).
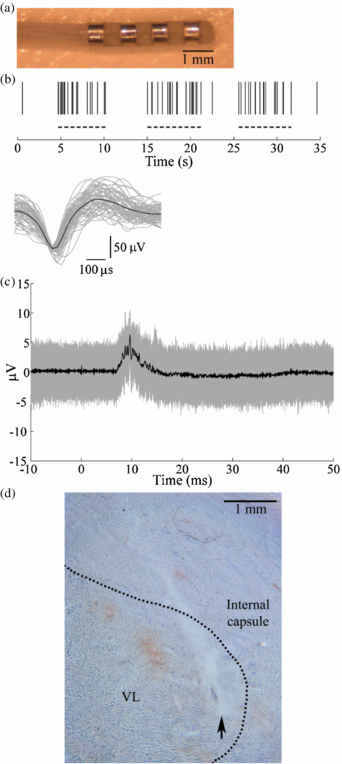
Figure 5. The DBS electrode was implanted in the VL thalamus in an anesthetized cat. (a) A mini DBS electrode was used for in vivo ECAP recording during thalamic DBS. (b) The location of the VL thalamus was identified by recording the activity of single thalamic neurons with a microelectrode during stereotactic surgery. (Top) Raster plot of spiking in a neuron showing increased activity during passive contralateral hindlimb movement (dashed lines). (Bottom) Waveforms of 61 discriminated spike waveforms recorded from the neuron (grey traces) and average waveform across all spikes (black trace). (c) Accurate implantation into the VL thalamus was verified by recording the evoked response from the DBS electrode during contralateral sciatic nerve stimulation, applied at time 0. The stimulus-triggered average (black trace) and single trials (grey traces) are shown. (d) Postmortem histology confirmed the location of the DBS electrode within the VL thalamus, with the nuclear boundary indicated by the dashed line. The arrow indicates the location of the ventral tip of the electrode.
Download figure:
Standard imageThe in vivo ECAP response was recorded using the different recording system configurations to examine the relative performance of the DBS-ECAP instrumentation (figure 6). Comparing responses to cathodic- and anodic-phase first stimulation enables one to distinguish the physiological ECAP signal, which is similar for symmetric, biphasic pulses [48], from the stimulus artefact, which is inverted for opposite polarities. The stimulus artefact recorded with the conventional amplifier was reduced in magnitude with the use of the series amplifiers with diodes, enabling higher gains (figures 6(a) and (b)), but the long duration of the artefact distorted the physiological ECAP. In contrast, the DBS-ECAP instrumentation suppressed the stimulus artefact and enabled high fidelity recording of ECAPs (figure 6(c)).
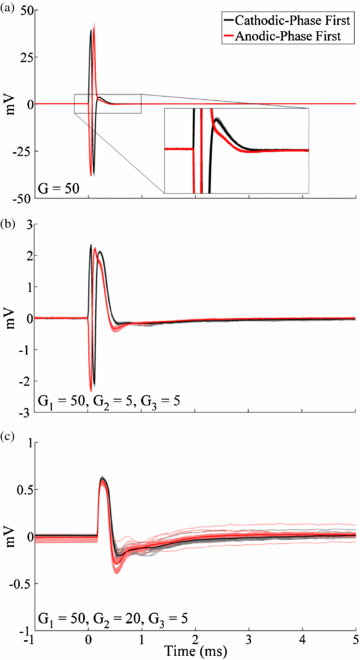
Figure 6. The stimulus artefact and ECAP during in vivo recording using the monopolar symmetric configuration with (a) the conventional amplifier, (b) series amplifiers with diodes and (c) DBS-ECAP instrumentation. The gains (G) used at the amplification stages of each recording system configuration are shown at the lower left of each graph. DBS was applied at time 0 with 3 V amplitude, 100 Hz frequency and 50 µs pulse width, with both cathodic- and anodic-phase first polarities. The stimulus-triggered average waveform (bold traces) and single trials (light traces) are shown.
Download figure:
Standard imageWe examined how the ECAP characteristics were dependent on stimulation parameters (figure 7). In the monopolar symmetric configuration, ECAPs had an early positive (P1) phase followed by a later negative (N1) phase (figure 7(a)). The magnitude and duration of these phases generally increased with DBS pulse width and amplitude (figures 7(a) and (b)), and the N1 phase was absent with low amplitude (1 V) DBS. Secondary positive (P2) and negative (N2) phases were observed at 10 Hz DBS (figure 7(a)). While these secondary phases were also present at the beginning of the stimulus train during 100 Hz DBS, their amplitudes progressively decayed during the stimulus train and were not present in the average waveform. ECAPs recorded using the monopolar asymmetric configuration exhibited an early negative (N1') phase and later positive (P1') phase (figure 7(c)).
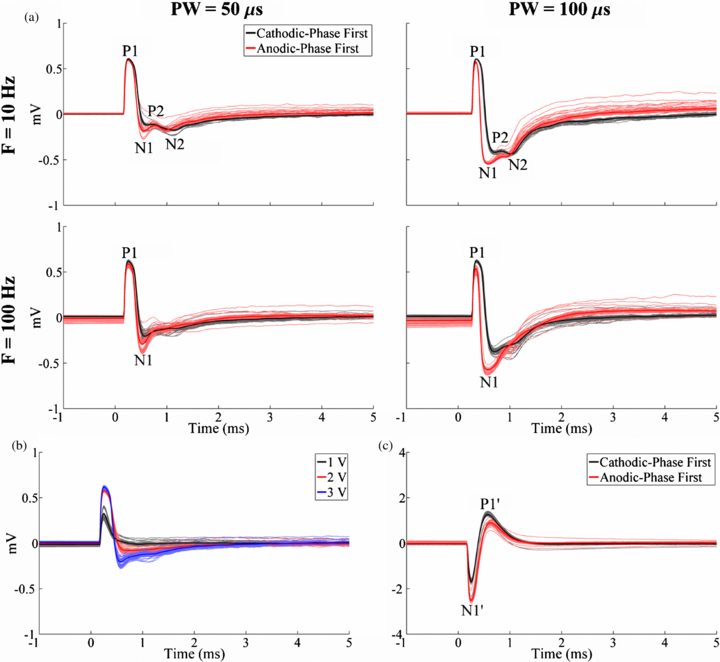
Figure 7. Effect of stimulation parameters on the in vivo ECAP response recorded with the DBS-ECAP instrumentation. DBS was applied at time 0. (a) ECAPs recorded using the monopolar symmetric configuration across DBS pulse widths (PW) and frequencies (F) at a 3 V amplitude. The results for cathodic- and anodic-phase first polarities are shown. (b) ECAPs recorded using the monopolar symmetric configuration across DBS amplitudes at 100 Hz frequency and 50 µs pulse width, and with cathodic-phase first polarity. (c) ECAPs recorded using the monopolar asymmetric configuration with 3 V amplitude, 100 Hz frequency and 50 µs pulse width. The results for cathodic- and anodic-phase first polarities are shown. For all figures, the stimulus-triggered average waveform (bold traces) and single trials (light traces) are shown. The amplifier gains used for the monopolar symmetric and asymmetric configurations were 5000 and 2500, respectively.
Download figure:
Standard imageWe measured the ECAP at multiple time points following euthanasia to confirm that the ECAP was a biological signal. While phases P1 and N1 were both still evident at 1 min following euthanasia (figure 8(a)), the latter was lost at 3 min (figure 8(b)). Postmortem recording at 5 min resulted only in a stimulus artefact, with inverted waveforms for opposite stimulation polarities, rather than a physiological ECAP response (figure 8(c)).
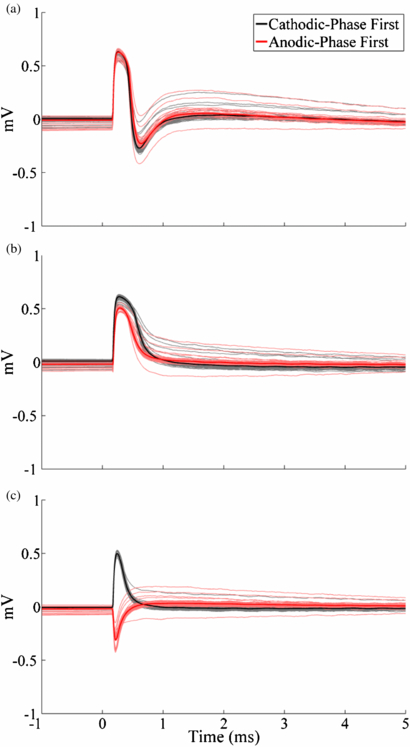
Figure 8. Postmortem in vivo ECAPs at (a) 1, (b) 3 and (c) 5 min after euthanasia recorded with the DBS-ECAP instrumentation using the monopolar symmetric configuration. DBS was applied at time 0 with 3 V amplitude, 100 Hz frequency, 50 µs pulse width and both cathodic- and anodic-phase first polarities. The stimulus-triggered average waveform (bold traces) and single trials (light traces) are shown.
Download figure:
Standard image3.4. Computational analysis of stimulus artefact sources and components for artefact reduction
An electrical circuit equivalent model was used to analyse the sources of the stimulus artefact recorded in vitro and in vivo, and to understand better the mechanism of artefact rejection by the stimulator relay of the DBS-ECAP instrumentation. The parameter values used in the circuit models are provided in table 2. The stimulus artefact was calculated as the differential voltage across the recording amplifier inputs, with and without use of the AQV212(A) stimulator relay, which had a 0.83 Ω on resistance and operational timing matching that used experimentally.
Table 2. Electrical circuit equivalent model parameters used for in vitro and in vivo models. The in vivo model used two sets of parameters to calculate the stimulus artefact in antemortem and postmortem recordings. The volume capacitance values shown for the in vivo models were calculated for dielectric constants of 3×10⁵ and 2.92×10⁵ for antemortem and postmortem, respectively. The resistance values of the volume conductor were calculated for conductivities of 0.3 and 0.216 S m−1, respectively.
| Parameter | In vitro | In vivo (antemortem) | In vivo (postmortem) |
|---|---|---|---|
| Interface double-layer capacitance (CDL) | 2.22 µF | 1.56 µF | 1.56 µF |
| Interface Faradaic resistance (RF) | 0.96 kΩ | 1.50 kΩ | 1.50 kΩ |
| Volume resistance between contacts 0 and 1 (RV01) | 200.11 Ω | 3208.69 Ω | 4469.48 Ω |
| contacts 1 and 2 (RV12) | 199.80 Ω | 3270.33 Ω | 4546.37 Ω |
| contact 0 and return (RV0) | 127.26 Ω | 2141.15 Ω | 2980.29 Ω |
| contact 1 and return (RV1) | 126.90 Ω | 2184.88 Ω | 3044.96 Ω |
| contact 2 and return (RV2) | 128.34 Ω | 2183.59 Ω | 3071.81 Ω |
| Volume capacitance between contacts and return (CV) | 5.80 pF | 9.38 nF | 9.13 nF |
The artefact calculated with the in vitro model (figure 9(a)) had a waveform shape similar to that recorded experimentally with the clinical DBS electrode in the saline bath using the conventional amplifier (figure 9(b)). The peak-to-peak magnitude of the model and experimental artefacts were approximately 16 and 49 mV, respectively, and this difference likely resulted from errors associated with model assumptions. Addition of the stimulator relay in the in vitro experiment reduced, but did not eliminate, the third phase of the artefact observed with the conventional amplifier (figure 9(b)). Conversely, results from the circuit model indicated that turning the stimulator relay off immediately after the DBS pulse prevented capacitive discharging from the electrode–tissue interface and eliminated the third artefact phase (figure 9(a)). However, when a short (25 µs) turn-off delay was added to the stimulator relay after the end of the DBS pulse, the model reproduced the reduced-magnitude third artefact phase seen experimentally. Although the digital pulse controlling the stimulator relay was turned off 40 µs before the end of the DBS pulse to account for this turn-off delay in the in vitro experiment, the typical measured delay for the AQV212(A) relay is longer than 40 µs and may have contributed to this observed post-stimulus delay time. The 25 µs turn-off delay was used for subsequent model trials with the stimulator relay.
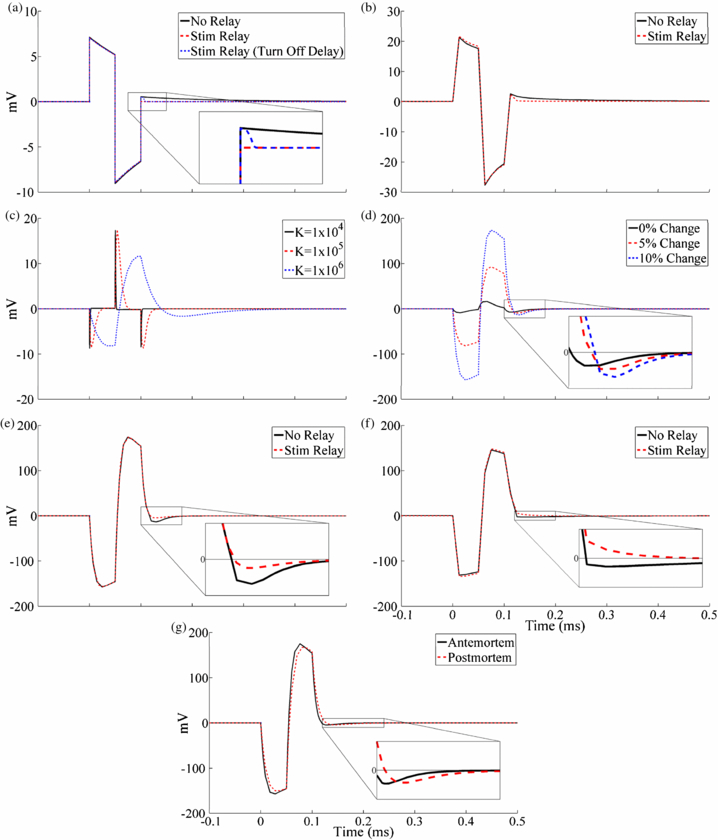
Figure 9. Stimulus artefact waveforms calculated with the in vitro and in vivo electrical circuit equivalent models and comparison to experimentally recorded artefacts using the monopolar symmetric configuration. DBS was applied at time 0 with 3 V amplitude, 100 Hz frequency, 50 µs pulse width and cathodic-phase first polarity. (a) In vitro circuit model artefacts calculated without the stimulator relay, and with the relay either turned off immediately after the pulse or with a 25 µs turn-off delay. (b) Stimulus-triggered average artefact waveforms from the in vitro experiment recorded with a conventional amplifier without signal filtering, with the stimulator relay absent and present. (c) The sensitivity analysis of in vivo circuit model artefact to dielectric constant (K) values between 1×10⁴ and 1×10⁶. A dielectric constant of 3×10⁵ was used for the subsequent circuit model analysis. (d) The sensitivity analysis of in vivo circuit model artefact to changes in the bulk tissue resistance. The resistance was increased between contacts 0 and 1, and decreased between contacts 1 and 2, by the indicated value. A 10% bulk conductivity change was used for subsequent circuit model analysis. (e) In vivo circuit model artefacts calculated with and without the stimulator relay. (f) Stimulus-triggered average artefact waveforms from a postmortem in vivo cat experiment. Recordings were made with a conventional amplifier without signal filtering, both with and without the stimulator relay. (g) Comparison of circuit model artefact waveforms calculated using parameter values from the original, antemortem and postmortem models. The stimulator relay was used for these data.
Download figure:
Standard imageWe next conducted sensitivity analysis to determine how the stimulus artefact calculated with the in vivo circuit model depended on the dielectric constant and conductivity of the tissue. The stimulus artefact was calculated for dielectric constant values of neural tissue from 1×10⁴ to 1×10⁶ (figure 9(c)). The variations in tissue capacitance led to substantial changes in the waveform shape of the artefact, since higher capacitances resulted in longer time constants for charging and discharging of the tissue. Using a dielectric constant value of 3×10⁵ resulted in an artefact (figure 9(d), solid trace) that best matched the experimental waveform shape (figure 9(f)). We next investigated the effect of inhomogeneity of tissue conductivity by decreasing the tissue resistance between contacts 0 and 1 by 5–10% and increasing that between contacts 1 and 2 by the same percentage (figure 9(d)). A greater degree of inhomogeneity increased the magnitude of the stimulus artefact, due to the larger differential voltage generated at the two recording contacts. A change in tissue resistance values of 10% produced a model artefact waveform with a magnitude similar to that observed experimentally and was used for subsequent artefact calculations. The presence of tissue inhomogeneities likely generated the larger stimulus artefact magnitudes in vivo compared to in vitro.
Discharging of the tissue capacitance following DBS pulses led to an increased duration of the third phase of the artefact in vivo. This phenomenon was observed experimentally (figure 9(f)) and was qualitatively reproduced with the circuit model (figure 9(e)). The stimulator relay did decrease capacitive discharging from the electrode–tissue interface and thereby reduce the magnitude of the third phase, but it did not prevent discharging of the tissue capacitance. The increase in artefact duration resulting from discharging of medium capacitance was only observed in vivo, since the permittivity of tissue is several orders of magnitude greater than that of saline.
The model was also used to investigate the increase in the stimulus artefact amplitude in postmortem in vivo recordings (figure 8). Decreases in tissue conductivity and permittivity, expected after euthanasia [44, 45], increased the duration of the third artefact phase in the model (figure 9(g)). Furthermore, local changes in brain conductivity that increased the extent of tissue inhomogeneity increased both the magnitude and duration of the artefact (figure 9(d)). These changes may explain the larger artefacts observed 5 min after euthanasia.
4. Discussion
We designed and evaluated the performance of instrumentation for high fidelity recording of ECAPs from the DBS electrode during stimulation. By reducing the magnitude and duration of the stimulus artefact, the DBS-ECAP instrumentation enabled recording of small amplitude, short latency mECAPs in vitro. The ability of the instrumentation to record physiological ECAPs was confirmed during in vivo DBS in the cat thalamus. The characteristics of the in vivo ECAP were dependent on stimulation parameters and may provide insight into the type and spatial extent of neural element activation during stimulation. Thus, the ECAP signal may be a suitable feedback control signal for tuning DBS parameters and in closed-loop DBS systems.
4.1. Design and evaluation of instrumentation
Several hardware-based strategies were used to limit the stimulus artefact. We employed multiple amplifier stages with anti-parallel diode clamps at the inputs to clip selectively the stimulus artefact and provide overvoltage protection. The magnitude of the artefact was reduced further by amplifier blanking, in which the signal paths in the second and third amplifier stages were grounded during each DBS pulse. To reduce the duration of the third phase of the artefact and to minimize the extent of temporal overlap with the ECAP, we used a stimulator relay to reduce capacitive discharge of the electrode–tissue interface immediately after each DBS pulse [20]. This relay disconnected the low impedance path available through the constant-voltage stimulator, thereby limiting the discharging current through the high impedance 10 kΩ parallel resistance. The accumulated charge was able to discharge between pulses through this parallel resistance and during the 2 ms pre-stimulus period in which the relay was closed. The parallel resistance also enabled near-critical damping of the signal recovery from artefact to baseline. Replacing the resistor with a potentiometer could enable rapid selection of a parallel resistance that achieved full critical damping of the system.
Other techniques used to suppress the stimulus artefact in neural recordings were not optimal for this application. Signal-processing techniques, such as curve fitting, template subtraction, polarity averaging, and masker-probe paradigms, are applied after the signal has been amplified and require lower gains to avoid saturation. Furthermore, the performance of the template subtraction and polarity averaging techniques suffers from the assumptions that the artefact shape is constant between stimulus pulses [21] and that the artefact perfectly follows the stimulus pulse in polarity [49], respectively. Signal filtering was not feasible due to overlapping frequency spectra of the ECAP signal and stimulus artefact. Alternatively, sample-and-hold amplifiers have not demonstrated the capacity to make artefact-free recordings of sub-millisecond latency neural activity, as required to capture physiological ECAPs, and have yielded inconsistent results.
Our novel DBS-ECAP instrumentation reduced the artefact magnitude and enabled a total in vitro gain of 40 000 to 100 000 without saturation during 3 V DBS, depending on the contact configuration. These gains far surpassed the conventional amplifier by a factor of 1000 to 5000. Furthermore, the reductions in artefact duration and use of high gains facilitated low distortion recording of physiologically realistic mECAPs at latencies as short as 0.5 ms and amplitudes as small as 0.11–0.30 mVP–P (see the appendix). This was the case for all contact configurations when using clinically relevant DBS parameters of 3 V amplitude, 100 Hz frequency and 50 µs pulse width. Conversely, the conventional amplifier recorded mECAPs with relatively high distortion. Long, asymmetric DBS pulses precluded low distortion recording of ECAPs with the DBS-ECAP instrumentation except at latencies of at least 1 ms. Since physiological ECAPs have latencies in the sub-millisecond range, it may not be feasible to use long, asymmetric pulses, such as those generated by the present clinical device [50], during ECAP recording.
The 4 kHz mECAP frequency used for in vitro validation was selected to examine the limits of instrumentation performance in recording physiological ECAPs. The bulk of the power of the in vivo ECAPs was in the 100 Hz to 4 kHz band. The DPS values were consistently lower for 1 kHz mECAPs compared to 4 kHz mECAPs when recorded with the DBS-ECAP instrumentation because any distortion influenced a shorter proportion of the longer 1 kHz signal, and the reported distortion values can be considered an upper bound.
We expect that the high recording fidelity of the DBS-ECAP instrumentation observed at 100 Hz DBS will translate across the entire range of clinical DBS frequencies. Increasing the DBS frequency from 100 to 180 Hz decreases the interpulse interval from 10 to 5.56 ms, but after accounting for the 2 ms pre-stimulus amplifier blanking period, this would still provide a recording window of 3.56 ms from the start of the stimulus pulse at 180 Hz DBS. Since the physiological ECAP signal returned to baseline by approximately 3 ms post-stimulus (figure 7), we do not anticipate increases in distortion, generated by temporal overlap of the ECAP signal with the subsequent amplifier blanking period, as the DBS frequency is increased to the high end of the clinical range. This was validated through in vitro testing of mECAPs at 180 Hz (data not shown).
The contact configurations used for stimulation and ECAP recording influenced the fidelity of the recording (see the appendix). The stimulus artefact magnitude was larger when the voltages generated during stimulation were not symmetrical at the recording contacts (i.e. the monopolar asymmetric and bipolar configurations). This required reductions in amplifier gain (table 1) and made it more challenging to record short latency mECAPs. Moreover, the recorded mECAP magnitude increased with the distance between recording contacts (maximal in the bipolar configuration), since the contacts measured a larger differential-mode signal. Collectively, this suggests that high fidelity recording is most challenging in the monopolar asymmetric configuration, due to the short distance between recording contacts and their non-symmetrical positioning about the stimulating contact. This was confirmed through the distortion analysis of mECAP recordings made in vitro across contact configurations.
The artefact waveforms calculated with the electrical circuit equivalent model were similar in magnitude and shape to the in vitro and in vivo artefacts, and provided insight into the origin of the artefact (figure 9). In the in vitro experiment, the only source of the third artefact phase was capacitive discharging from the electrode–tissue interface, which was limited with the use of the stimulator relay. However, the turn off delay of the relay, which was approximately 25 µs after the end of the DBS pulse, allowed some discharging. Consequently, the size of the third phase was reduced but not eliminated. This suggests that using a stimulator relay with a shorter turn off delay may improve the performance of this system. The model indicated that there were two sources of the third artefact phase observed in vivo: capacitive discharging after each DBS pulse of (1) the tissue capacitance and (2) the electrode–tissue interface. Previous computational [39, 51] and experimental [52] studies have also demonstrated that the tissue capacitance is charged during the DBS pulse (influencing the DBS waveform shape). The stimulator relay cannot suppress the artefact resulting from discharging of the tissue capacitance, and thus the third phase is larger in vivo than in vitro. We investigated a means to rapidly discharge the tissue capacitance by shorting the amplifier inputs with a PhotoMOS relay for 60 µs immediately after each pulse. However, this technique did not reduce the third phase of the in vivo artefact and electrical equivalent circuit modelling indicated that the lack of effect was caused by negligible current flow through the relay due to its internal impedance (data not shown). Finally, the peak-to-peak magnitude of the artefact recorded with the conventional amplifier was greater in vivo than in vitro, and results from the circuit model suggest that this may have been caused by inhomogeneities in the neural tissue, which were not present in the saline bath.
4.2. Insight provided by the physiological ECAP
The results from our in vivo experiment confirmed that physiological ECAPs could be recorded during thalamic DBS. The DBS-ECAP instrumentation enabled high gain recordings of ECAPs, uncontaminated by the stimulus artefact, during DBS of the VL thalamus. This could be performed using both the monopolar symmetric and asymmetric configurations (figure 7), of which the latter was revealed by the in vitro analysis to be the most challenging configuration for high fidelity recording. The similarity of ECAP waveform shapes recorded during the cathodic- and anodic-phase first polarity stimulation corroborated the neural origin of the signal, and the elimination of the ECAP response at 5 min after euthanasia (figure 8) further verified the biological origin of the recorded signal. The increase in the stimulus artefact magnitude observed after euthanasia could have been caused by decreases in bulk tissue conductivity and permittivity [44, 45] and/or local changes in brain conductivity that increased the extent of tissue inhomogeneity. Electrical circuit equivalent modelling indicated that these changes increased the magnitude and duration of the third phase of the artefact.
Measuring the ECAP across DBS parameters provided insight into the activation patterns during DBS. The magnitude and duration of the ECAP phases increased with the DBS amplitude and pulse width, as a result of activation of additional neural elements having higher stimulation thresholds [53]. ECAPs generated with the monopolar symmetric configuration had an early positive (P1) phase and later (N1) negative phase. To interpret this finding, we used results from the modelled cochlear ECAP response, in which a large negative phase, flanked on each side by small positive phases, corresponded to action potential propagation near the recording contact [54]. We propose that P1 was generated by early dorsal activity (near the negative recording contact), whereas N1 corresponded to later ventral activity (near the positive contact). Furthermore, we observed secondary positive (P2) and negative (N2) phases during low-frequency DBS, and at the beginning of the pulse train during high-frequency DBS. This suggests that the P2 and N2 phases corresponded to post-synaptic activity, and the loss of these phases at high stimulation frequencies corresponded to a reduction in post-synaptic activity [55]. Recording the ECAP with the monopolar asymmetric configuration revealed an early negative (N1') phase and later positive (P1') phase. These two phases likely corresponded to the dorsal-to-ventral propagation of action potentials, initiated in cells near the stimulating contact, and propagating first past the positive recording contact (N1') and subsequently past the negative contact (P1').
These findings suggest that the ECAP may provide signatures of clinical effectiveness and be a suitable feedback signal in closed-loop DBS systems. For example, the ECAP magnitude could indicate when there is sufficient neural activation for clinical efficacy. As the DBS amplitude is increased from 1 to 3 V, the in vivo ECAP increased in magnitude (figure 7(b)), and tremor decreases over the same range [16]. We therefore expect a correlation between ECAP magnitude and tremor that could be used to set the DBS amplitude in a closed-loop system. An analogous correlation has been established for cochlear implants between cochlear nerve ECAP magnitude and perceptional hearing levels [18].
4.3. Study limitations
The electrical circuit equivalent model provided insight into the sources of the stimulus artefact; however, there are several limitations that should be noted. First, calculations of medium resistance and capacitance assumed a spherical volume conductor surrounding the DBS electrode, with the return electrode at the volume conductor boundary. Furthermore, the medium capacitance calculations assumed that the DBS contacts were spherical. In the in vitro and in vivo experiments, the return electrode did not bound the DBS electrode, but rather was located at a single, distant position (figure 1). This model assumption may have resulted in underestimation of the medium resistance and overestimation of the medium capacitance between DBS contacts and the return electrode. Furthermore, neither the saline tank nor the DBS contacts were actually spherical, but these assumptions likely had a negligible effect on model results due to the large difference in size between the DBS contacts and the volume conductor, which would be expected to mitigate the effects of these geometric approximations.
The second limitation was an assumption in the circuit model that the mini DBS electrode had the same electrode–tissue interface properties as the clinical DBS electrode, for which the impedance values were measured [35]. However, when the interface resistance and capacitance values were modified to account for the smaller surface area of the mini DBS electrode, the effect on the artefact waveform was negligible (data not shown). Third, this model did not include capacitive coupling between stimulating and recording leads [20, 56], which was reasonable considering that this would generate a common-mode stimulus artefact and be rejected at the differential preamplifier stage. The fourth limitation was that we did not account for the frequency dependence of tissue permittivity [57] in calculating bulk volume capacitance, and it remains unclear which permittivity value best represents brain tissue [39]. However, under conditions of voltage-controlled stimulation in a homogenous medium, using a frequency-independent permittivity can closely approximate the solution of a fully dispersive model [58]. Fifth, the medium capacitance between two DBS contacts was not included in the circuit model.
The final major limitation of the circuit model was that changes in neural tissue properties measured after euthanasia in the literature were made in porcine [44] and bovine [45] brains, rather than the cat. Furthermore, the change in permittivity was measured at high frequencies (900 MHz), outside of the bandwidth of the DBS pulse [44]. Similarly, the change in conductivity was measured at a relatively high frequency (100 kHz) [45]. Therefore the tissue properties used in the postmortem in vivo circuit model were only approximations for impedance changes in the cat brain during DBS.
A limitation of the experimental methods used in this study was that a clinical DBS electrode was used for most of the in vitro testing, whereas a mini DBS electrode was used in the in vivo experiments. We chose to evaluate the in vitro performance of the DBS-ECAP instrumentation with the clinical DBS electrode since the ECAP recording technique is intended for clinical translation. Conversely, the mini DBS electrode was more appropriate for the size of the cat brain. Nevertheless, the stimulus artefact and mECAP waveforms recorded with the clinical DBS electrode were very similar to those recorded with the mini DBS electrode during in vitro testing, suggesting a small effect of DBS geometry on ECAP recordings.
5. Conclusions
We developed novel instrumentation and demonstrated high fidelity recordings of mECAPs in vitro and physiological ECAPs in vivo during DBS. The in vivo ECAP provided information about the spatiotemporal activation pattern (timing and polarity of ECAP phases), the spatial extent of this activation (ECAP magnitude) and the types of elements activated (i.e. post-synaptic cells). The presence of these signatures suggests that the ECAP could provide a suitable feedback control signal for the selection of stimulation parameters during clinical programming sessions or in closed-loop DBS systems that automatically adjust stimulation parameters as the disease progresses or the response to DBS changes over time [59].
Acknowledgments
The authors would like to thank Gilda Mills for animal care and surgical assistance and Thomas Jochum for reviewing the manuscript. This work was supported by NIH F31-NS070460 and the Duke University Department of Biomedical Engineering Robert Plonsey Fellowship.
: Appendix
Distortion values were calculated as the error between the recorded and the ideal mECAPs, and decreased as the DBS pulse width was reduced or mECAP latency increased (figure A1(a)). With 3 V DBS in the monopolar symmetric configuration, the DBS-ECAP instrumentation recorded small magnitude (0.18 mVP–P) mECAPs with relatively low DPS values in the range of 0.17 to 0.26 at latencies of only 0.5 ms after DBS pulses of 50 or 100 µs duration, or latencies of 1 ms after long, asymmetric DBS pulses with 50 µs first phase and 500 µs second phase (figure A1(a), filled bars). In cases where a very short latency mECAP was coupled with a relatively long DBS pulse width, the mECAP was masked by amplifier blanking. Using the series amplifiers with diodes, the mECAP was more distorted (figure A1(a), open bars) and masked by the artefact in some trials, while using the conventional amplifier resulted in a minimum DPS value of 1.26 across all combinations of DBS pulse widths and mECAP latencies tested.

Figure A1. DPS of the mECAP across DBS and mECAP stimulation parameters, measured in vitro with the monopolar symmetric configuration. (a) Effect of DBS pulse width and mECAP latency on distortion. DBS parameters were 3 V amplitude, 100 Hz frequency and cathodic-phase first polarity, and sinusoidal mECAP parameters were 0.18 mVP–P amplitude (0.1 mAP–P input amplitude) and 4 kHz frequency. The narrow, filled bars show distortion values for the DBS-ECAP instrumentation, whereas the wider, open bars show the distortion for the series amplifiers with diodes. For some trials, the mECAP was masked and these are marked by a white X when masked with series amplifiers with diodes, and a filled X when masked with both instrumentation systems. The inset shows mECAPs recorded with the DBS-ECAP instrumentation (solid trace) and ideal mECAP sinusoid (dashed trace) for a DBS pulse width of 50 µs and the denoted mECAP latency. (b) Effect of DBS and mECAP amplitudes on distortion. DBS parameters were 100 Hz frequency, 50 µs pulse width and cathodic-phase first polarity, and the sinusoidal mECAP parameters were 0.2 ms latency and 4 kHz frequency. Data presentation is otherwise identical to that in (a).
Download figure:
Standard imageDistortion decreased as the DBS amplitude was reduced or the mECAP amplitude was increased (figure A1(b)). Short latency mECAPs overlapped with the stimulus artefact, and larger mECAP amplitudes or smaller DBS amplitudes increased the relative magnitude of the mECAP signal over the artefact. Applying 50 µs DBS pulses with the monopolar symmetric configuration, the DBS-ECAP instrumentation recorded short latency (0.2 ms) mECAPs with relatively low DPS values under 0.35 at mECAPs amplitudes of only 0.18 mVP–P for 0 or 1 V DBS, and amplitudes of 0.53 mVP–P for 2 or 3 V DBS (figure A1(b), filled bars). Using the series amplifiers with diodes, distortion was larger (figure A1(b), open bars). The conventional amplifier could record mECAPs with DPS values under 0.5 at a DBS amplitude of 1 V, only with a large mECAP amplitude of 0.88 mVP–P.
Compared to the monopolar symmetric configuration, the minimum mECAP latencies and amplitudes necessary for low distortion recording were generally equivalent for the bipolar configuration and greater for the monopolar asymmetric configuration with the DBS-ECAP instrumentation. This disparity across contact configurations was generated by differences in the magnitude of the stimulus artefacts and of the recorded mECAPs for a given input amplitude. For example, a mECAP with 0.1 mAP–P input amplitude corresponded to a recorded amplitude of 0.18, 0.11 and 0.30 mVP–P for the monopolar symmetric, monopolar asymmetric and bipolar configurations, respectively. Furthermore, the artefact magnitude increased from monopolar symmetric to asymmetric configurations and from monopolar asymmetric to bipolar configurations (figures 4(c) and A2), which decreased the amplifier gain possible without saturation (table 1). Moreover, the relative magnitude of the stimulus artefact and mECAP has a critical influence on the recording fidelity (figure A1(b)), and likely also contributed to the differences in distortion observed between contact configurations.
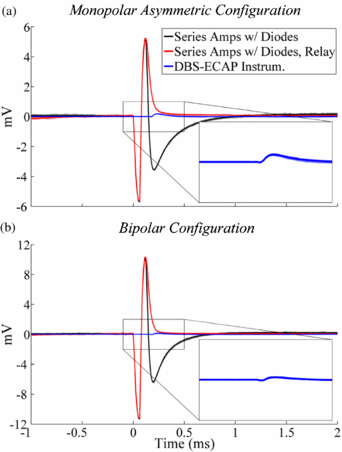
Figure A2. In vitro stimulus artefact waveforms measured with the monopolar asymmetric and bipolar contact configurations, using the series amplifiers with diodes, series amplifiers with diodes and stimulator relay and DBS-ECAP instrumentation. DBS was applied at time 0 with 3 V amplitude, 100 Hz frequency, 50 µs pulse width and cathodic-phase first polarity. The stimulus-triggered average waveform (bold traces) and single trials (light traces) are shown. The insets show a zoomed view of the stimulus artefact waveforms for the DBS-ECAP instrumentation.
Download figure:
Standard image