Abstract
Objective. Electrical stimulation of the spinal cord has potential applications following spinal cord injury for reanimating paralysed limbs and promoting neuroplastic changes that may facilitate motor rehabilitation. Here we systematically compare the efficacy, selectivity and frequency-dependence of different stimulation methods in the cervical enlargement of anaesthetized monkeys. Approach. Stimulating electrodes were positioned at multiple epidural and subdural sites on both dorsal and ventral surfaces, as well as at different depths within the spinal cord. Motor responses were recorded from arm, forearm and hand muscles. Main results. Stimulation efficacy increased from dorsal to ventral stimulation sites, with the exception of ventral epidural electrodes which had the highest recruitment thresholds. Compared to epidural and intraspinal methods, responses to subdural stimulation were more selective but also more similar between adjacent sites. Trains of stimuli delivered to ventral sites elicited consistent responses at all frequencies whereas from dorsal sites we observed a mixture of short-latency facilitation and long-latency suppression. Finally, paired stimuli delivered to dorsal surface and intraspinal sites exhibited symmetric facilitatory interactions at interstimulus intervals between 2–5 ms whereas on the ventral side interactions tended to be suppressive for near-simultaneous stimuli. Significance. We interpret these results in the context of differential activation of afferent and efferent roots and intraspinal circuit elements. In particular, we propose that distinct direct and indirect actions of spinal cord stimulation on motoneurons may be advantageous for different applications, and this should be taken into consideration when designing neuroprostheses for upper-limb function.
Export citation and abstract BibTeX RIS

Content from this work may be used under the terms of the Creative Commons Attribution 3.0 licence. Any further distribution of this work must maintain attribution to the author(s) and the title of the work, journal citation and DOI.
1. Introduction
Electrical stimulation of the spinal cord has become an established therapy for chronic pain (Epstein and Palmieri 2012, Compton et al 2012), and there is increasing interest in further applications for the rehabilitation of motor function after spinal cord injury (Edgerton and Roy 2012, Jackson and Zimmermann 2012). Stimulation delivered through epidural and penetrating intraspinal electrodes in the lumbosacral enlargement of rats and cats can produce weight-bearing standing and stepping (Tresch and Bizzi 1999, Mushahwar et al 2000, Ichiyama et al 2005, Barthélemy et al 2006), and trials of epidural stimulation in paraplegic human subjects are yielding promising results (Dimitrijevic et al 1998, Minassian et al 2004, Harkema et al 2011). Advantages of spinal stimulation over direct functional electrical stimulation (FES) of muscles include a more natural recruitment order (Bamford et al 2005), the activation of functional motor primitives incorporating multiple muscles from a single electrode (Giszter et al 1993, Guevremont et al 2006), and the possibility of activating all the muscles within a limb from a single array positioned within a relatively small and mechanically stable implant site. Moreover, the normalization of activity patterns within the spinal cord may provide further therapeutic benefits mediated by neuroplastic changes to spinal motor circuits (Harkema et al 2011, van den Brand et al 2012, Kasten et al 2013). In particular, the association of the intention to move with appropriate stimulus-evoked activity below the level of an incomplete injury promotes a reorganization of spinal circuitry that facilitates the influence of surviving descending pathways and provides a potential substrate for recovery of volitional motor function (van den Brand et al 2012, Jackson and Zimmermann 2012).
Restoration of arm and hand function is a high priority to quadriplegic patients (Anderson 2004), but the dexterity and descending corticospinal control of the upper-limb in human and non-human primates differs substantially to quadruped mammals (Lemon 2008). Previous work has shown that intraspinal stimulation of cervical segments in monkeys elicits electromyogram (EMG) responses in a variety of upper-limb muscles (Moritz et al 2007), and multiple intraspinal electrodes can be combined to produce functional reaching and grasping movements (Zimmermann et al 2011). Surface stimulation through either epidural or subdural electrodes may provide a less invasive means to reanimate upper-limb muscles, but to our knowledge the motor effects of surface stimulation of the cervical spinal cord have not been studied in primates. Therefore we systematically compared the efficacy, selectivity and frequency-dependence of EMG responses to epidural, subdural and intraspinal stimulation of the cervical enlargement in anaesthetized monkeys. In addition, since a ventral approach to the cervical cord is surgically feasible and used routinely for other spinal procedures (Slin'ko and Al-Qashgish 2004), we also compared motor responses from ventral and dorsal surfaces. Finally, we assessed concurrent activation of spinal circuitry by examining the interaction between pairs of subdural surface and intraspinal stimuli. Although muscles could be activated by all stimulation methods, the differing nature of these responses revealed distinct direct and indirect mechanisms by which motoneurons were activated. Consideration of these mechanisms, as well as the efficacy and selectivity of different methods, should inform the design of spinal cord neuroprostheses to restore upper-limb function following injury.
2. Methods
2.1. Subjects
Experiments were performed using four female rhesus monkeys (maccaca mullata): subject F (age 11 years, weight 9.4 kg), subject G (11 years, 8.2 kg), subject K (12 years, 9.6 kg), and subject T (4 years, 4.4 kg). Procedures were approved by the local ethics committee at Newcastle University and performed under appropriate UK Home Office licenses in accordance with the Animals (Scientific Procedures) Act 1986.
2.2. Surgical procedures
Surgical dissection to expose the spinal cord was performed under sevoflurane anaesthesia (minimal alveolar concentration 1.8–1.9%), after which a ketamine/alfentanil infusion (0.1–0.6 mg kg−1 h−1 and 0.2 µg kg−1 min−1 respectively) was used for stimulation experiments since inhalation anaesthetics are known to depress spinal excitability (Rampil and King1996).
Pairs of stainless steel wires were inserted percutaneously into 14 muscles ipsilateral to spinal stimulation sites (the left arm of subject F and right arms of subjects G, K and T) including four upper arm muscles: deltoid, triceps brachii, biceps brachii and brachioradialis; seven forearm muscles: extensor carpi ulnaris, extensor digitorum communis, extensor carpi radialis longus, extensor digitorum second and third tendons, flexor carpi radialis, flexor carpi ulnaris and flexor digitorum superficialis; and three intrinsic hand muscles: abductor pollicis brevis, abductor digiti minimi and first dorsal interosseous. Correct positioning was verified by observing movements elicited by electrical stimulation of the wires. EMG was amplified with a gain of 1000, band-pass filtered from 100 to 1000 Hz (Model 1700, A-M Systems, Carlsborg, US) and sampled at 5 kHz (Micro1401, CED, Cambridge, UK).
In two animals (F and G) we used a dorsal approach to the spinal cord with the animals positioned prone. The C5, C6 and C7 cervical lamina were removed and the ligamentum flavum was dissected to expose the dura mater overlying the spinal cord. The animals were positioned in a spinal frame that was clamped at the first thoracic vertebra and at an exposed lumbar vertebra. In a further two animals (K and T) we used a ventral approach to the spinal cord with the animals positioned supine. A vertical incision was made 1 cm lateral to the midline. The carotid artery, internal jugular vein, oesophagus and trachea were retracted and the strap muscles were dissected. The vertebral bodies were then removed using a dental burr to expose the dura mater.
A ∼1 mm diameter silver ball electrode (with typical impedance of electrode-tissue interface between 10–100 KΩ at 1 kHz) was used to stimulate different epidural sites, after which the dura was resected and (subdural) stimulation was applied to the pia at the same sites. A 16-channel linear probe (typical impedance 100–800 kΩ at 1 kHz, interelectrode separation 0.1 mm, Neuronexus part# A1x16–10 mm-100–703) was then inserted for intraspinal stimulation at depths between 2.0 to 3.5 mm (figure 1(a)). Stimuli were delivered using a DS4 (Digitimer, Hertfordshire, UK; intensity series) and two Model 2100 stimulators (A-M Systems, Carlsborg, US; train and paired stimulation). A monitoring circuit was used to check that the stimulators could deliver sufficient current to the high impedance electrodes.
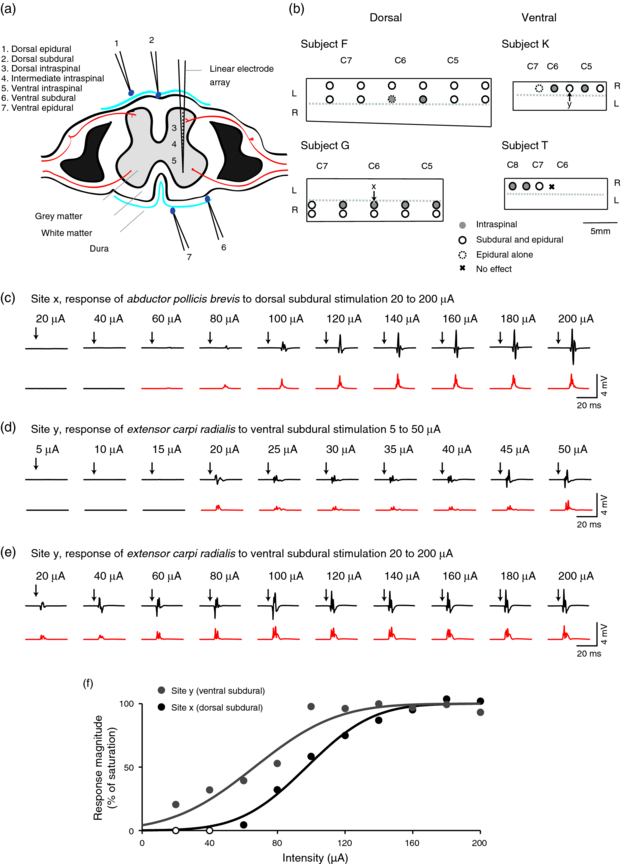
Figure 1. Stimulation methods, sites and example intensity series. (a) Cross-section of the spinal cord to show locations of epidural, subdural and intraspinal stimulation. (b) View of the spinal cord surface exposed by laminectomy in each animal. Circles indicate locations of stimulation sites. For dorsal approaches, locations of spinous processes (C5 to C7) are indicated. For ventral approaches, the locations of spinal roots are indicated. Dashed lines indicate approximate midline of the spinal cord. (c) Top row shows example EMG responses to single dorsal subdural stimuli (site x in panel b) at intensities between 20 to 200 µA. Bottom row shows mean, rectified response to 20 stimuli. Red traces indicate a significant effect of stimulation. (d) Example responses to ventral subdural stimuli (site y) at intensities between 5 to 50 µA. (e) Example responses to ventral subdural stimuli (site y) at intensities between 20 to 200 µA. (f) Response functions for example stimulation sites, normalized to the saturation level. Filled circles indicate significant responses. Lines show cumulative normal distribution fit.
Download figure:
Standard image High-resolution image2.3. Stimulation protocols
2.3.1. Single pulse stimulation
Single biphasic stimulus pulses (cathode leading, 0.2 ms per phase) were delivered in a pseudorandomized intensity series (0.5 s interstimulus interval). 20 repetitions of current intensities from 20 to 200 µA (20 µA increments) were delivered at each site. If no response was seen in any muscle at 200 µA the site was abandoned and excluded from analysis. Where thresholds were towards the low or high limits of the initial intensity range, additional series of 5 to 50 µA, or 50 to 500 µA were used as appropriate to better characterize recruitment curves. For intraspinal stimulation sites, intensity series were delivered at all 16 different depths of the electrode array.
2.3.2. Train stimulation
Trains of 15 pulses in frequencies of 10 to 120 Hz were delivered in a pseudorandomized order (2 s inter-train interval; 20 repetitions). The stimulus intensity (50–600 µA) was chosen to be sufficient to elicit EMG responses in at least two muscles. For intraspinal stimulation sites, train stimulation was performed for channels 1, 9 and 16, corresponding to the deepest, middle and most superficial electrodes of the array.
2.3.3. Paired stimulation
Pairs of stimuli were delivered to subdural (surface) and intraspinal sites with interstimulus intervals between ±10 ms. The subdural electrode was positioned in either medio-lateral or rostro-caudal alignment to the intraspinal electrode, separated by ∼2 mm from where it penetrated the pia. Each subdural (surface) site was paired with stimuli delivered to channels 1, 9 and 16 of the intraspinal array.
2.4. Analysis methods
2.4.1. Recruitment curves
EMG responses were rectified and averaged over a 10 ms time-window beginning in most cases 5 ms after the stimulus (though this was increased as appropriate for some intrinsic muscles with long response latencies). The absolute magnitude of EMG responses depends on various factors (e.g. muscle size, electrode position) so cannot be directly compared across different muscles. Therefore we determined the presence or absence of a statistically significant response by comparing against a comparable pre-stimulus time-window using a two-tailed, unpaired t-test with a threshold of P < 0.05. Recruitment curves were compiled from the proportion of muscles (P) in which a significant response was observed at stimulation intensity (I). Assuming a normal distribution (N) of muscle thresholds with mean (µP) and variance ( ), then the shape of this recruitment curve can be described by a cumulative density function:

Best fit values for the two free parameters µP and  were obtained by least-squares regression. An advantage of this parametric model is that unbiased muscle thresholds can be calculated from any intensity series, so the appropriate current range was used for each stimulation site. Note however that the mean threshold obtained by this method can nevertheless exceed the maximum intensity in the series.
In addition, we defined a measure of stimulation efficacy, based on a single current range. Efficacy was calculated as the proportion of muscles in which a significant response was observed, averaged across all intensities tested in the range from 20–200 µA (in 20 µA increments). A stimulation method with a low threshold for activating multiple muscles would therefore have a high stimulation efficacy according to this definition.
Muscle threshold distributions and stimulation efficacies were first calculated for each stimulation site combining all muscles. In addition, thresholds and efficacies were calculated separately for each of three muscle groups (arm, forearm and intrinsic hand) to assess stimulation selectivity (section 2.4.3). Finally, stimulation efficacy was calculated for each muscle individually to yield a response pattern that was used to assess the similarity of stimulation effects across different sites (section 2.4.4).
2.4.2. Graded recruitment of muscles
To explore the range of stimulus intensities over which graded muscle responses could be obtained, we fitted the magnitude of response (R; defined as the mean rectified EMG over the 10 ms time-window minus the pre-stimulus baseline) with a cumulative normal distribution with three free parameters, Rsat, µR and  :
:

We defined the gradation range as the difference between the intensities that elicit 5% and 95% of the saturation response:

Gradation ranges were only calculated for muscles in which a significant response was elicited by at least three stimulus intensities to ensure meaningful fit parameters could be obtained.
2.4.3. Stimulation selectivity
If stimulation selectively activates a specific muscle group (e.g. arm versus forearm or hand) then the mean threshold for the preferred muscle group should be much lower than the others. More precisely, the variance of the mean threshold across groups should be large compared to the within group threshold variance. Therefore we defined a selectivity index based on the fit parameters obtained from the cumulative distribution model (equation (1)):

where the variance (of the mean) and mean (of the variance) are calculated over three muscle groups (arm, forearm and intrinsic hand). To validate the results obtained from the parametric description of recruitment curves using a non-parametric method we also calculated a second measure of selectivity based on the normalized difference between the highest and lowest stimulation efficacy of the three muscle groups:

In addition, we calculated selectivity indices for the forearm muscles alone, grouped functionally into extensors and flexors.
2.4.4. Response similarity
We defined the response pattern as the proportion of significant responses across the 20–200 µA range for each of the 14 muscles individually, yielding 14 values for each site and method of stimulation. The similarity between any two response patterns was measured by the Pearson's correlation coefficient, allowing us to construct a similarity matrix between all pairs of stimulation sites. For pairs of intraspinal sites within a single penetration of the electrode array, we compiled average similarity as a function of increasing (depth) separation between sites, and compared this against equivalent calculations of similarity across two penetrations at different sites. For surface stimulation, we calculated average similarity as a function of increasing rostro-caudal separation between sites.
2.4.5. Train stimulation
The mean rectified response to each pulse in a stimulus train was calculated over an 8 ms window (to avoid overlap at the highest stimulation frequencies). Because we wanted to assess both facilitation and suppression following multiple stimulus pulses, we analysed only muscles that exhibited a significant response to the first stimulus in the train (assessed as for recruitment curves). The response magnitude to subsequent stimuli was normalized by the first response. To quantify the strength of facilitation and suppression on subsequent responses, we used a simple model in which the modulatory influences from all previous stimuli sum linearly (Zimmermann et al 2011). These influences comprised distinct facilitatory and suppressive components which declined exponentially over time with decay constants that were determined by least-squares regression over the entire dataset (for facilitation: τf = 4 ms; for suppression: τs = 100 ms). The response to the Nth stimulus in the train, RN, is given by:
where Δ is the interstimulus interval. The overall strength of facilitation, Af, and suppression, As, were determined individually for each stimulation site and muscle using least-squares regression.
2.4.6. Paired stimulation
We wished to determine whether the muscle response to a pair of stimuli delivered at two sites (one subdural and one intraspinal) was greater or less than the combined response to each stimulus delivered alone. However, since rectification introduces a nonlinearity, we cannot directly compare the mean, rectified EMG response to paired stimulation against the sum of the mean, rectified responses to individual stimuli. Instead we generated a prediction based on linear summation of unrectified EMG responses with the appropriate interstimulus interval (Baker et al 1998). This prediction overestimates the background EMG level (since two backgrounds are combined in the sum), so we added an additional background (a section of pre-stimulus recording) to the real paired response to allow unbiased comparison. The mean, rectified, background-corrected response to paired stimulation was compared with the prediction from linear summation over a 10 ms window following the second of the two stimuli using a paired t-test with a significance level of 0.05, Bonferroni corrected to adjust for multiple comparisons over the 14 muscles and 13 different interstimulus intervals. Each interaction was classified as supra-linear or sub-linear, according to whether the response to paired stimulation was greater or less than the expected linear summation.
All analyses were performed using custom software written in Matlab (Mathworks Inc.).
3. Results
3.1. Dataset
We report data from four monkeys (two using a dorsal approach and two using a ventral approach). In total, stimulation was delivered to 31 epidural sites (22 dorsal, 9 ventral), 28 subdural sites (21 dorsal, 7 ventral) as well as 10 intraspinal penetrations using the 16-channel array (6 from dorsal side and 4 from ventral side). All sites elicited a response in at least one muscle following stimulation at 200 µA, except for one ventral epidural site which was excluded from further analysis (figure 1(b)).
3.2. Example muscle responses to different stimulation methods
Figure 1(c) shows example EMG traces and average rectified responses in abductor pollicis brevis to an intensity series from 20 to 200 µA delivered to a dorsal subdural site. This muscle had the lowest threshold at this site (60 µA) and exhibited a graded response up to around 140 µA. Figure 1(d) shows responses in extensor carpi radialis to a 5 to 50 µA series of ventral subdural stimuli. In this case, the minimum threshold for a significant response was 20 µA and the response saturated at around 100 µA (figure 1(e)). Figure 1(f) shows the response magnitude for these example sites at different intensities of stimulation, fitted by a cumulative normal distribution (equation (2)).
3.3. Efficacy of muscle activation by different stimulation methods
As has been reported previously (Moritz et al 2007), close to threshold we typically observed responses in multiple muscles. We used the presence or absence of a significant effect of stimulation in each muscle at each intensity to derive recruitment curves and response patterns (figure 2(a)). Figure 2(b) shows average recruitment curves for each method of stimulation, reflecting the proportion of muscles that exhibited a significant response at each intensity. Mean muscle thresholds were determined by fitting a cumulative distribution function to the recruitment curve for each stimulation site. Figure 2(c) shows that ventral subdural stimulation had the lowest mean (± standard error) muscle recruitment threshold of 21 ± 6 µA, followed by intraspinal, dorsal epidural and dorsal subdural sites at 114 ± 19 µA, 187 ± 25 µA and 227 ± 48 µA respectively. Surprisingly, ventral epidural stimulation had the highest threshold at 278±50 µA. A single factor ANOVA confirmed the significant effect of stimulation method (F4,82 = 4.9; P = 0.001).

Figure 2. Efficacy of muscle activation by different spinal cord stimulation methods. (a) Summary of significant muscle responses for different intensities of stimulation delivered to an example dorsal subdural stimulation site (site x in figure 1(b)). Also shown is the recruitment curve (below) obtained by averaging across muscles, and response pattern (right) obtained by averaging across intensities. Muscle groups are shaded according to most preferred (black), intermediate (dark grey) and least preferred (light grey). (b) Average recruitment curves for different stimulation methods. Shading indicates standard error of mean. (c) Mean threshold for muscle recruitment by different stimulation methods. (d) Proportion of significant muscle responses averaged over the range 20–200 µA for different stimulation methods. (e) Average intensity range over which graded muscle responses could be obtained (from 5% to 95% of saturation level) for different stimulation methods. Bars indicate standard error of mean. (f) Mean response function fit for each method of stimulation, normalized to the level at which the response saturated.
Download figure:
Standard image High-resolution imageIntraspinal sites were further subdivided into superficial, intermediate and deepest channels within the array, corresponding approximately to dorsal, intermediate and ventral regions of the spinal cord after taking into account the direction of penetration. The mean (± standard error) threshold increased from ventral to intermediate to dorsal intraspinal sites (66 ± 20 µA, 147 ± 36 µA and 163 ± 38 µA respectively). This did not reach significance with a single factor ANOVA (F2,27 = 2.6; P = 0.09), although an unpaired t-test revealed a significant difference between ventral and dorsal thresholds (t18 = 2.3; P = 0.04).
Stimulation efficacy was also assessed by averaging the proportion of muscle responses over the intensity range 20–200 µA. Consistent with the threshold results, figure 2(d) shows that ventral subdural was the most effective stimulation method, activating an average (± standard error) of 72 ± 3% of muscles. This was followed by intraspinal then dorsal subdural and dorsal epidural stimulation, activating 51 ± 4%, 29 ± 3% and 23 ± 3% respectively. Ventral epidural was the least effective method, activating only 12 ± 4% of muscles. A single factor ANOVA showed a significant effect of stimulation method (F4,83 = 19.6, P < 0.001). Subdivision of intraspinal channels revealed an increasing efficacy from dorsal (38 ± 7%) to intermediate (43 ± 6%) to ventral sites (59 ± 6%) which reached significance on a single factor ANOVA (F2,27 = 3.4, P = 0.048).
In summary, both measures suggest a general trend for increasing efficacy as the stimulation site moves from dorsal to ventral. This is likely due to greater proximity to motoneurons and motor axons in the ventral regions of the spinal cord. The surprising exception to this trend is the poor efficacy of ventral epidural stimulation.
3.4. Graded muscle responses to different stimulation methods
In general, all stimulation sites produced EMG responses that increased with stimulation current up to a saturation level, similar to the examples shown in figures 1(c)–(e). For each muscle (with at least three significant responses), we fitted a cumulative normal distribution (equation (2)) to the response magnitude at each stimulus intensity. From the fit parameters, we determined the range of currents over which graded responses could be obtained (equation (3)). Figure 2(e) shows that this range was highest for ventral intraspinal stimulation (222 ± 24 µA) while for most other stimulation methods it was around 150 µA. A one-factor ANOVA revealed a significant effect of stimulation method on gradation range (F6,648 = 4.4, P = 0.0002). Figure 2(f) shows the mean response function fit for each method of stimulation. Note that although the response to ventral subdural and ventral intraspinal stimulation begins at a similar threshold, the former saturates quickly, while the latter elicits a graded response across the entire intensity range.
3.5. Selectivity of muscle responses to different stimulation methods
Although a somatotopic organization of motor responses is weak or absent in the primate cervical cord (Moritz et al 2007), there is often some proximal-distal preference in the pattern of muscle responses from individual stimulation sites. For example, the muscles recruited at the lowest threshold from the site shown in figure 2(a) were all intrinsic hand muscles. To explore the extent to which stimulation selectively recruited arm, forearm or intrinsic hand muscle groups, we ordered these as most, intermediate and least preferred for each site according to their relative recruitment efficacy. Figure 3(a) shows average recruitment curves for each muscle group, divided according to preference. A wide divergence between these curves would indicate highly selective recruitment of the preferred muscle group.

Figure 3. Selectivity of muscle responses to different stimulation methods. (a) Average recruitment curves for most preferred, intermediate and least preferred groups of muscles (arm, forearm and intrinsic hand). Dashed line indicates best-fit cumulative normal distribution. (b) Mean parametric selectivity, defined as ratio of across group variance to within group variance. (c) Mean non-parametric selectivity index, defined as normalized difference in efficacy between most preferred and least preferred muscle groups. (d)–(f) Equivalent analyses for forearm muscles grouped according to flexors and extensors. Bars indicate standard error of mean.
Download figure:
Standard image High-resolution imageTo compare the selectivity of different stimulation methods we defined two measures (see methods). The first was based on parametric fits of recruitment curves (equation (1)) for each muscle group and represented the ratio of across group to within group threshold variance (equation (4)). Figure 3(b) shows that subdural stimulation had the highest parametric selectivity indices (3.1 ± 0.7 and 2.8 ± 0.8 for dorsal and ventral respectively), followed by intraspinal (1.8 ± 0.4) and then epidural stimulation (1.1 ± 0.3 for both dorsal and ventral). A second, non-parametric selectivity index was defined as the normalized difference in efficacy between most and least preferred muscle groups (equation (5)). This index showed a similar pattern (figure 3(c)), with highest selectivity for subdural sites (0.65 ± 0.05 and 0.71 ± 0.13 for dorsal and ventral respectively) followed by intraspinal (0.49 ± 0.06) and then epidural stimulation (0.45 ± 0.06 and 0.44 ± 0.05 for dorsal and ventral respectively). Single factor ANOVAs showed the effect of stimulation method on both measures was borderline significant (parametric: F4,61 = 2.4, P = 0.06; non-parametric: F4,61 = 2.5, P = 0.05) while post-hoc t-tests revealed a robust difference between epidural and subdural methods (parametric: t39 = 3.4, P = 0.002; non-parametric: t28 = 3.3, P = 0.003). Sub-analysis of the intraspinal sites showed no significant difference in similarity measures between the three intraspinal depths (parametric: F2,21 = 0.2, P = 0.8; non-parametric: F2,21 = 0.1, P = 0.9).
We further analysed the ability of stimulation methods to selectively activate forearm muscles divided functionally according to flexors and extensor (figures 3(d), (e)). Selectivity indices were generally lower, reflecting the fact that organization at this level was not as pronounced as for the proximal-distal groupings. Both parametric and non-parametric selectivity indices were lowest for ventral subdural stimulation (0.19 ± 0.11 and 0.040 ± 0.014 respectively). Single factor ANOVAs revealed a significant effect of stimulation method on non-parametric (F4,61 = 2.6, P = 0.04) but not parametric (F4,61 = 0.6, P = 0.7) measures. In neither case was the effect of intraspinal depth significant (parametric: F2,21 = 0.9, P = 0.4; non-parametric: F2,21 = 0.4, P = 0.7).
3.6. Similarity of response patterns from different stimulation sites
The correlation coefficients between patterns of muscle response from different stimulation sites were used to compile similarity matrices for different stimulation methods (figure 4(a)). Figure 4(b) shows how the average similarity between responses to surface stimulation changes with increasing rostro-caudal separation between sites. There is a trend for the response correlation to decrease with increasing separation, and for the overall similarity between pairs of subdural sites to be higher than for pairs of epidural sites. Multiple linear regression confirmed the significance of both these factors (R2 = 0.74; slope: −0.017 ± 0.004 mm−1, t = 9.5, P < 0.001; subdural-epidural difference: 0.43 ± 0.05, t = 4.1, P < 0.001) but not the side of stimulation (dorsal-ventral difference: 0.03 ± 0.06, t = 0.4, P = 0.7).
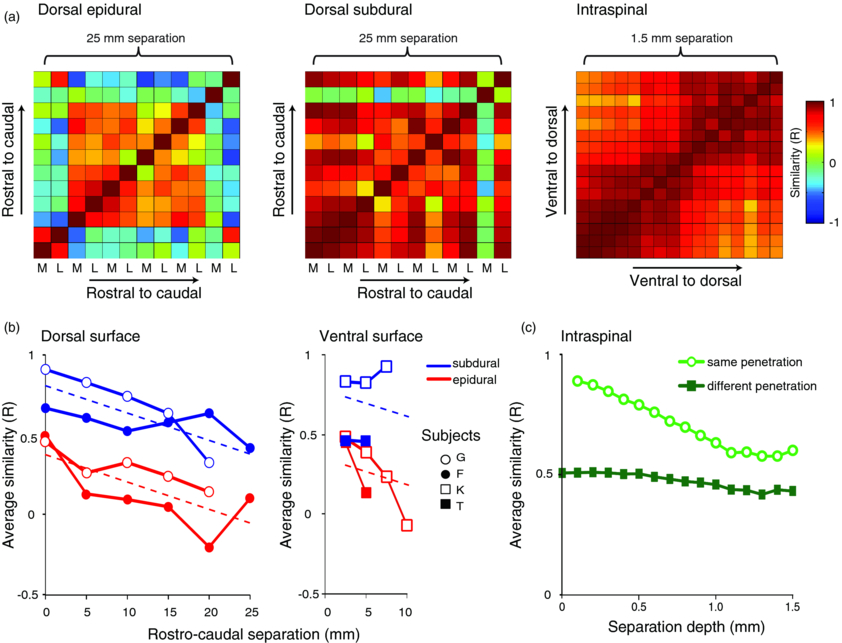
Figure 4. Dependence of similarity between muscle response patterns on electrode separation for different stimulation methods. (a) Example similarity matrices for different stimulation methods, showing the correlation coefficient between response patterns evoked from pairs of stimulation sites. For surface stimulation, similarity is calculated between medial (M) and lateral (L) sites at different rostro-caudal locations separated by up to 25 mm. For intraspinal stimulation, similarity is calculated between all electrode positions within a single array penetration separated by up to 1.5 mm. (b) Average similarity for surface stimulation as a function of increasing rostro-caudal separation. Dashed lines indicate fit of linear regression with three explanatory variables: separation, side (dorsal/ventral) and method (epidural/subdural). (c) Average similarity for intraspinal stimulation as a function of increasing depth separation between electrodes within the linear array (open circles). Also shown is similarity between comparable electrode sites across different electrode penetrations (filled squares; mean electrode track separation 7 mm, range 2.5–15 mm).
Download figure:
Standard image High-resolution imageFigure 4(c) shows how the similarity between patterns of responses to intraspinal stimulation changes with increasing depth separation between electrode sites in the array. The mean correlation between response patterns is high (0.89) for neighbouring electrodes (separated by 0.1 mm) but falls rapidly with increasing interelectrode separation along the penetration track (R2 = 0.95; slope: −0.25 ± 0.02 mm−1). Note that the dependence of response similarity on interelectrode separation for intraspinal stimulation is approximately 15 times steeper than that obtained for surface stimulation, suggesting relatively focal activation of the tissue by penetrating electrodes. Also shown in figure 4(c) is the similarity between response patterns for equivalent pairs of electrodes, but compared across different rostro-caudal penetration sites (mean separation 7 mm; range 2.5–15 mm). Since we made intraspinal penetrations at fewer locations than were used for surface stimulation we cannot directly compare how similarity declines with increasing rostro-caudal separation. However, between different tracks the similarity of response patterns was comparable to that seen between neighbouring epidural stimulation sites (∼0.5), which may reflect underlying organization of the spinal cord. Interestingly, the similarity between neighbouring subdural sites is significantly higher (0.7–0.8), which may seem at odds with the proximal-distal selectivity results from the previous section. Note however that selectivity and similarity are measuring different aspects of the responses. To summarize, subdural stimulation of either the dorsal or ventral surface of the spinal cord recruits muscles in a more selective manner than epidural stimulation, but that the pattern of responses are more similar across subdural stimulation sites. One possibility is that the motor effects of subdural stimulation are mediated by activation of dorsal/ventral roots and/or descending pathways. We suggest that these fibre tracts may exhibit greater proximal-distal organization than the underlying grey matter, but that their activation may be less sensitive to the precise rostro-caudal site of stimulation.
3.7. Muscle responses to stimulation trains
Figure 5(a) shows example EMG responses to trains of stimulation delivered to a dorsal subdural site at 10, 50 and 100 Hz. At low frequency, a muscle response is elicited from every stimulus although the response is progressively attenuated. For the intermediate frequency, this attenuation is more pronounced, while at the high frequency there is an initial facilitation of the response to the second stimulus followed by a suppression of subsequent responses. By contrast, EMG responses to ventral surface stimulation were more consistent and followed even high frequency trains (figure 5(b)). In order to quantify these differences, we analysed those muscles that exhibited a significant response to the first stimulus (across 56 stimulation sites n = 575/784 or 73.3% of site–muscle combinations) and normalized subsequent responses by its magnitude. The colour plots in figure 6(a) show the relative magnitude of responses to subsequent stimuli in trains at frequencies between 10 to 120 Hz for the different stimulation methods. For dorsal surface sites, there was strong suppression at most frequencies, although the first few responses to high frequency trains were facilitated. By contrast, the response to ventral stimulation sites was more consistent throughout the train.
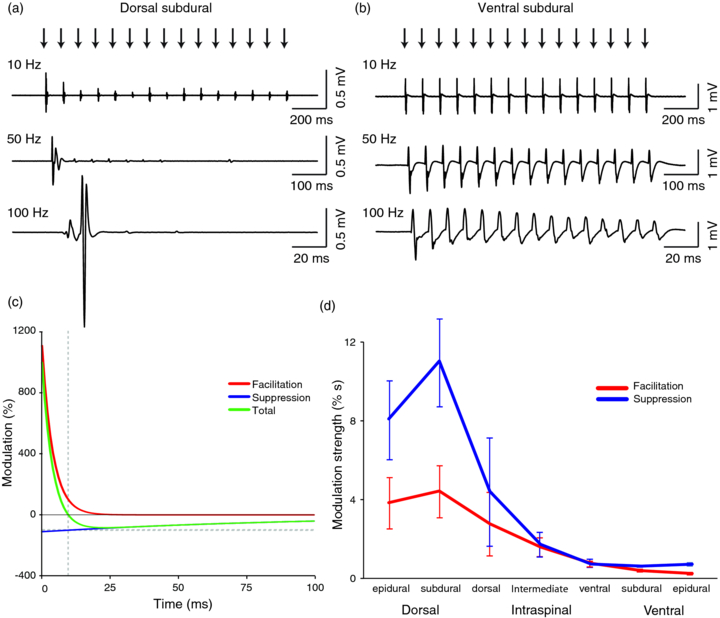
Figure 5. Muscle responses to stimulation trains. (a) Example EMG response in abductor pollicis brevis to trains of 15 stimuli delivered to a dorsal subdural site at 10, 50 and 100 Hz. Note the difference in time-base between traces such that stimuli appear equally spaced. (b) Example EMG response in flexor carpi radialis to trains of stimuli delivered to a ventral subdural site. (c) Time-course of modelled facilitatory (red) and suppressive (blue) influences of a preceding stimulus on subsequent responses. Green line indicates the resultant effect which changes from facilitatory (left of vertical dashed line) to suppressive (right of vertical dashed line). Responses below the horizontal dashed line are set to zero. (d) The strength (amplitude multiplied by time constant) of facilitation and suppression for different stimulation sites determined by model fit. Bars indicate standard error of mean.
Download figure:
Standard image High-resolution image
Figure 6. Average train responses and model fits for different stimulation methods. (a) Colour maps showing the magnitude of response to each pulse in trains of different frequencies, normalized by the response to the first stimulus. Each plot is the average of all the muscle-stimulation site combinations for which there was a significant response to the first stimulus. (b) Average model fit for the same muscle-stimulation site combinations.
Download figure:
Standard image High-resolution imageWe fitted a simple cumulative model in which strong, fast-decaying facilitatory and weaker, slowly-decaying suppressive influences of all previous stimuli add linearly to modulate subsequent responses (figure 5(c)). We used the same time constants (facilitation: 4 ms, suppression: 100 ms) and varied only the strengths of the two components (equivalent to the areas under the curves in figure 5(d)). In this way we were able to capture well the temporal profile of responses to trains of each stimulation method (figure 6(b)). Figure 5(d) shows how the average strength of facilitation and suppression varied with stimulation method. Both components show a similar trend of decreasing strength from dorsal to ventral sites. Single factor ANOVAs showed that the effect of stimulation method was significant in both cases (Facilitation: F6,568 = 2.6, P = 0.02; Suppression: F6,568 = 5.1, P < 0.001).
If the temporal modulation were due to factors intrinsic to the motoneurons, we would expect to see the same pattern irrespective of stimulation method. These results suggest instead that the effects of dorsal surface stimulation are mediated (at least in part) by synaptic influences onto motoneurons which at short intervals facilitate recruitment but are at longer intervals inhibitory. By contrast, stimulation of ventral sites recruits motoneurons directly with less concurrent activation of modulatory spinal circuitry. This distinction is explored further in the next section.
3.8. Interactions between pairs of surface and intraspinal stimuli
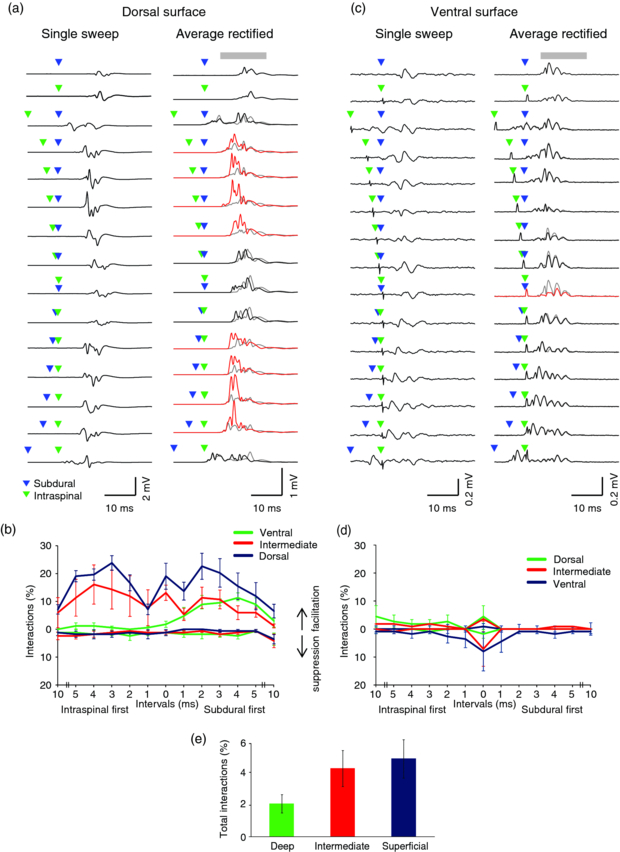
Figure 7(a) shows single sweeps and average rectified EMG responses to stimulation of a pair of dorsal subdural and intraspinal sites at intervals between ±10 ms. Compared against what would be expected from linear summation of the (unrectified) responses to single stimuli, responses to paired stimuli were enhanced for interstimulus intervals between 2–5 ms, irrespective of the order of stimuli. This symmetric bimodal facilitation was the dominant pattern observed when intraspinal stimulation was paired with dorsal surface stimulation (figure 7(b)). The exception was when the intraspinal stimulus was delivered to the deepest electrode in the array (corresponding to the most ventral intraspinal site). In this case, the pattern of interaction was asymmetric, with facilitation occurring only when surface stimulation preceded intraspinal stimulation.
Figure 7. Interactions between paired subdural and intraspinal stimulation. (a) Example EMG recordings (left) and average rectified responses (right) from first dorsal interosseous muscle, in response to individual dorsal subdural and dorsal intraspinal stimuli as well as paired stimuli with 13 different time intervals. Grey bar represents the time window for assessing nonlinear EMG response. Grey lines indicate response predicted by linear summation of responses to individual stimuli. Black lines show actual responses that do not differ significantly from the linear prediction. Red lines show actual responses that are significantly greater than the linear prediction. (b) The proportion of supra- and sub-linear interactions between dorsal subdural and intraspinal sites for different interstimulus intervals. (c) Example responses from flexor carpi radialis to paired ventral subdural and ventral intraspinal stimuli. Red line shows a response that is significantly less than the linear prediction. (d) The proportion of supra- and sub-linear interactions between ventral subdural and intraspinal sites for different interstimulus intervals. Note that panels b and d are colour-coded according to depth of intraspinal electrode relative to the surface that was stimulated (blue: superficial, red: intermediate, green: deep). (e) Average proportion of significant interactions (supra- and sub-linear) across all time intervals and sides (dorsal and ventral) divided according to the depth of intraspinal electrode relative to the surface that was stimulated. Bars indicate standard error of mean.
Download figure:
Standard image High-resolution image
A very different pattern was observed when stimulation was applied to the ventral subdural surface (figures 7(c), (d)). In this case we did not see strong facilitatory interactions with intraspinal stimuli. Instead we saw a suppression of the combined response for interstimulus intervals between ±1 ms. For both dorsal and ventral surface stimulation, there was a trend for nonlinear interactions to become more pronounced when paired with the superficial electrode in the intraspinal array (figure 7(e)). This trend did not reach significance using a single factor ANOVA (F2,27 = 2.59, P = 0.10) although a paired t-test yielded a significant difference between the deepest and most superficial electrodes (t19 = 2.37, P = 0.028).
These results support our hypothesis that dorsal stimulation influences motoneurons in part through indirect mechanisms mediated by spinal circuitry. We suggest that due to synaptic delays, the excitatory influence arrives at the motorneurons approximately 2–3 ms after stimulation, bringing them closer to threshold and thus easier to activate directly with the second stimulus. This indirect excitation is absent when stimulation is delivered to either ventral intraspinal or ventral surface sites. By contrast the suppression seen following near-simultaneous stimulation of these sites is likely caused by refractory motoneurons or axons, for example if an orthodromic action potential arising from intraspinal stimulation collides with and is abolished by an antidromic action potential following stimulation of the same motor roots by ventral surface stimulation.
4. Discussion
We have examined upper-limb muscle responses to different methods of electrical stimulation of the cervical spinal cord. We consider first the different mechanisms of dorsal and ventral stimulation before comparing epidural, subdural and intraspinal methods. We conclude with a discussion of the implications of our work for neuroprosthetics applications in spinal cord injury.
4.1. Ventral and dorsal stimulation act on the upper-limb through different mechanisms
Our results suggest that the motor effects of stimulation are mediated by both direct (non-synaptic) activation of motoneurons, and indirect (trans-synaptic) excitation mediated by descending projections, afferent inputs and/or local spinal interneuron circuits. The relative contribution of these two mechanisms varies from predominantly direct effects at the ventral surface towards increasing indirect activation from more dorsal sites. Direct stimulation elicited consistent responses to trains of stimulation across a wide frequency range whereas indirect stimulation was characterized by facilitation at short intervals combined with longer latency suppression. Facilitation could be a straightforward consequence of synaptic integration whereby several sub-threshold inputs to a motoneuron in quick succession are sufficient to bring it to threshold, although we do not discount the possibility of additional short-latency facilitatory mechanisms known to act at motoneuron synapses (Jackson et al 2006). Strong, short-latency facilitation could also be related to the common observation of doublet firing in motoneurons at the beginning of contractions (Bawa and Calancie 1983). The subsequent suppression could arise from either pre- or post-synaptic inhibition mediated by interneurons (Rudomin and Schmidt 1999, Jankowska 2001). It is interesting to note that despite several orders of magnitude difference in the time-course and magnitude of facilitatory and suppressive influences, the strength of each (defined as magnitude multiplied by time constant, equivalent to the area under the curves in figure 5(c)) was comparable for all stimulation methods (figure 5(d)), suggesting an overall balance between excitation and inhibition within spinal cord circuitry.
Our dual mechanism hypothesis is further supported by the effects of paired stimulation. Since ventral surface stimulation activated motoneurons directly, we saw no facilitation of a subsequent intraspinal stimulus. By contrast, dorsal stimulation sites recruited indirect pathways which brought motoneurons close to threshold and thus facilitated the response to an intraspinal stimulus delivered several ms later. Since the interaction between dorsal surface and intraspinal stimulation was temporally symmetric, we can conclude that each caused both direct and indirect activation, with the exception of our most ventral intraspinal electrode site which did not influence responses to subsequent surface stimuli.
4.2. Epidural versus subdural stimulation
For both dorsal and ventral approaches, subdural stimulation elicited patterns of muscle response that were more selective (in terms of preferential activation of arm, forearm or intrinsic hand muscles) than intraspinal electrodes, and also more similar between different rostro-caudal stimulation sites. We interpret these differences as reflecting greater activation of dorsal and ventral roots directly beneath the epidural electrodes, which may exhibit more somatotopic organization than the deeper grey matter. Activation of afferent projections has been shown to influence motoneurons up to several segments from the site of stimulation (Gaunt et al 2006), and therefore responses mediated by roots may be less dependent on precise location of stimulating electrodes. When selectivity was analysed at the level of functional groups (flexors versus extensors) within the forearm, a different pattern emerged with the lowest selectivity observed for ventral subdural stimulation. The nerves innervating forearm flexors and extensors are mixed within the cervical roots which may explain the lack of functional segregation in ventral subdural responses. The higher selectivity between flexors and extensors seen with dorsal surface and intraspinal stimulation may reflect the greater functional organization of reflex and intraspinal circuits (Perlmutter et al 1998, Illert and Kümmel 1999).
Interestingly, epidural stimulation resembled intraspinal stimulation in both selectivity and rostro-caudal similarity, suggesting that the efficacy of root stimulation declines sharply as a consequence of the intervening dura and cerebrospinal fluid. Such an interpretation could in part explain the surprisingly poor efficacy of ventral epidural stimulation, which required the highest current of all our methods to activate muscles. It is interesting that the difference in efficacy between subdural and epidural stimulation was most pronounced on the ventral side, and did not appear to be due to obvious differences in the thickness of dura or the size of subdural space. Indeed the ventral dura may actually be thinner than on the dorsal side in primates (Kimani et al 1984). One possible explanation is that since responses from dorsal side are mediated by indirect pathways, diffuse and weak activation of a large volume of tissue may converge and summate at motoneuron synapses. By contrast, direct stimulation from the ventral side cannot exploit synaptic integration and thus higher currents are required to bring motoneuron cell bodies and axons to threshold.
4.3. Implications for spinal cord neuroprostheses
Several caveats should be made before generalizing conclusions from our current study. The results reported here were obtained under anaesthesia, using acutely positioned stimulating electrodes. Although previous studies have reported differences in responses to intraspinal stimulation between anaesthetized and decerebrate states (Aoyagi et al 2004), we find that responses to intraspinal stimulation using chronic implants in awake animals are generally similar in terms of thresholds and evoked movements to those seen under our acute preparations (Zimmermann and Jackson 2011). More significant could be plastic changes to spinal cord circuitry following injury, which were not modelled in our study and may alter the responses to stimulation. However a recent study in rodents has reported comparable stimulation responses to intraspinal stimulation in both healthy and chronic spinal cord-injured animals (Sunshine et al 2013).
The distinct mechanisms of action we describe suggest different stimulation methods may have different applications following spinal cord injury. Stimulation of the ventral surface produces reliable responses mediated by direct activation of motoneurons, which may be advantageous for FES applications. It should be noted that in both animals in which the ventral surface was exposed, bleeding from spinal arteries upon resection of the dura limited our access to the underlying spinal cord, suggesting that such subdural implantation may prove surgically challenging for chronic electrodes. Ventral epidural electrodes may be more feasible, as have been proposed for inspiratory muscle pacing by thoracic cord stimulation (DiMarco and Kowalski 2009). Low efficacy is a disadvantage of the ventral epidural locations, although higher stimulation currents can nevertheless produce robust and reliable motor responses.
The movements generated by trains of stimulation delivered to the ventral surface, especially at high frequency, were considerable and could readily lift the monkey's arm off the table against gravity. However, the range of intensities over which graded responses could be obtained was smaller than for ventral intraspinal stimulation, possibly due to recruitment of large motoneurons at low threshold. An unnatural recruitment order could also lead to rapid fatigue, although interleaved stimulation of multiple sites may alleviate this to some extent (Normann et al 2012). Evidence from the rat suggests that trans-synaptic activation of motoneurons by intraspinal stimulation leads to a preferential recruitment of fatigue-resistant fibres (Bamford et al 2005). However, the temporal facilitation and suppression resulting from indirect activation presents a different challenge for precise control of the upper-limb. Previously we described a method to compensate for temporal interactions in order to produce graded force output by frequency-modulated trains (Zimmermann et al 2011). The movements resulting from trains of intraspinal stimulation in the present study were similar to those described in detail in our previous study. By contrast, movements resulting from trains of dorsal surface stimulation were often limited to brief twitches as the muscle response was abolished before the end of the train, particularly at higher frequencies (e.g. figure 5(a)). It may therefore prove difficult to generate sustained, fused contractions from the dorsal surface without interleaved stimulation of multiple electrodes.
Another issue for FES applications of spinal cord stimulation is the selectivity with which particular movements can be produced. Even close to threshold we found that multiple muscles were recruited by all stimulation methods, as has been described previously for intraspinal stimulation of the cervical enlargement (Moritz et al 2007). These response patterns exhibited more proximal-distal organization when stimulation was subdural (although with less functional selectivity on the ventral side) which we speculate reflects the organization of afferent and efferent roots. Nevertheless, our selectivity measure is relatively crude, and does not fully take into account the diversity and distributed nature of muscle co-ordination during natural limb use. It is possible that the more distributed responses to intraspinal stimulation reflect activation of interneurons that co-ordinate functional synergies (Perlmutter et al 1998). Previously we described functional movements including reaching and grasping produced by intraspinal stimulation of just one or two electrodes (Zimmermann et al 2011). However, it remains to be seen whether these distributed patterns represent true functional synergies or simply current spread across unrelated neural elements.
Since ventral stimulation activates motoneurons directly with little or no concurrent effect on intraspinal circuitry, it may be less successful in driving beneficial neuroplastic changes within these circuits. Therefore dorsal surface stimulation appears more suited for use in rehabilitation of voluntary movements following incomplete injuries. On the dorsal side, there does not seem to be much benefit to subdural over epidural electrode sites, and the less invasive approach may have a further advantage for chronic arrays in that activity patterns recruited from adjacent electrode sites are less similar to one another. Finally, stimulation patterns should be designed to exploit temporal modulation and maximize the efficacy of each stimulus, for example alternating between long and short interstimulus intervals to exploit temporal summation while minimizing inhibitory effects of intermediate intervals (Zimmermann et al 2011).
5. Conclusions
Stimulation of the primate cervical spinal cord activates upper-limb motoneurons through different mechanisms. The relative contribution of these varies systematically across ventral and dorsal surface and intraspinal sites, leading to differences in efficacy, selectivity and frequency-dependence of muscle recruitment. Consideration of these differences will be important in optimizing the design of neuroprostheses to facilitate neurorehabilitation and restore upper-limb movement following spinal cord injury.
Acknowledgments
We thank TM Hall and J Tulip for technical assistance. This work was supported by the Wellcome Trust [086561].