
Abstract
Objective. Brain-computer interfaces (BCIs) have the potential to reinstate lost communication faculties. Results from speech decoding studies indicate that a usable speech BCI based on activity in the sensorimotor cortex (SMC) can be achieved using subdurally implanted electrodes. However, the optimal characteristics for a successful speech implant are largely unknown. We address this topic in a high field blood oxygenation level dependent functional magnetic resonance imaging (fMRI) study, by assessing the decodability of spoken words as a function of hemisphere, gyrus, sulcal depth, and position along the ventral/dorsal-axis. Approach. Twelve subjects conducted a 7T fMRI experiment in which they pronounced 6 different pseudo-words over 6 runs. We divided the SMC by hemisphere, gyrus, sulcal depth, and position along the ventral/dorsal axis. Classification was performed on in these SMC areas using multiclass support vector machine (SVM). Main results. Significant classification was possible from the SMC, but no preference for the left or right hemisphere, nor for the precentral or postcentral gyrus for optimal word classification was detected. Classification while using information from the cortical surface was slightly better than when using information from deep in the central sulcus and was highest within the ventral 50% of SMC. Confusion matrices where highly similar across the entire SMC. An SVM-searchlight analysis revealed significant classification in the superior temporal gyrus and left planum temporale in addition to the SMC. Significance. The current results support a unilateral implant using surface electrodes, covering the ventral 50% of the SMC. The added value of depth electrodes is unclear. We did not observe evidence for variations in the qualitative nature of information across SMC. The current results need to be confirmed in paralyzed patients performing attempted speech.
Export citation and abstract BibTeX RIS

Original content from this work may be used under the terms of the Creative Commons Attribution 4.0 license. Any further distribution of this work must maintain attribution to the author(s) and the title of the work, journal citation and DOI.
1. Introduction
Communication is at the core of human interaction, allowing one's expression of ideas, opinions and needs, whether spoken, written or through non-verbal expressions. The inability to express oneself fully, especially via the means of language, is to suffer a level of exclusion in society [1–3]. Communicative capabilities can be severely diminished by either inexistence of muscle coordination [4–6] (in cases of trauma or developmental disorders, such as Cerebral Palsy), or total paralysis (in cases of trauma, stroke or neurodegenerative diseases such as amyotrophic lateral sclerosis [7, 8]). In the most severe cases, individuals are cognitively intact, however, unable to move and communicate: a condition known as locked-in-syndrome (LIS) [9].
Over the past years, Brain-computer interfaces (BCIs) have shown the potential to reinstate lost communication faculties, by allowing users to instruct computers using their recorded brain signals [10–16]. Nevertheless, BCI is not yet regarded as a standard procedure for reinstating communication loss.
Most widely used strategies in BCI focus on the decoding of neuronal activity in the hand-knob area of the sensorimotor cortex (SMC) provoked by attempted hand movements [17]. However, the most intuitive way of communication would entail the direct translation of the neural activity induced by a message that users wish to transmit, into textual or auditory output via a speech-computer interface. This would represent the optimal BCI communication device as long as the patient's language faculties are intact. While speech decoding directly from language related brain areas has not been shown to be feasible, various studies have indicated that the SMC might be a more suitable target area [18–22]. In fact, SMC activity recordings using electrocorticography (ECoG), multi-unit arrays or functional magnetic resonance (fMRI) have been used to successfully classify mouth movements [23, 24], phonemes [19, 20, 22, 25, 26], words [18], and even full sentences [21].
Recent speech decoding studies suggest that a viable usable speech BCI based on activity in the SMC can be achieved using subdurally implanted ECoG electrodes [27]. However, the optimal location and extent of coverage, have not yet been systematically investigated. In this study, we address these topics by assessing the decodability of spoken words based on BOLD responses in the SMC using 7T fMRI. Having a-priori knowledge on discriminative activity across the SMC during production of different words can help to guide to the implant in locked in patients, for whom fMRI procedures are often practically limited to defining activity hotspots with basic on-off block-desings. Several key features need to be determined for a viable for an ECoG-based BCI implant. First, the choice of hemisphere. It is currently unknown whether there is lateralization for speech production at the level of the SMC, which would designate an optimal hemisphere for an implant. Second, position of electrodes around the central sulcus. Speech production includes both guiding the articulators and their sensory feedback, being represented in the precentral and postcentral gyrus respectively. It is unknown which of the two is best suited for speech decoding. Third, the position of electrodes along the ventral/dorsal axis matters. While it is well known that the ventral portion of the SMC contains representations of the mouth, larynx, and tongue [28], it is yet unclear if the location of the representations of word production correspond to this area. Fourth, given that part of the SMC is folded inward along the central sulcus, depth matters. While lower band synchronous activity can be picked up from depths, speech-based BCI's typically focus on high-frequency broadband signal power (HFB, 65–125 Hz) [29]. This spectral part of the signal has been shown to contain the necessary details to allow discriminating spoken words [30, 31] due to its temporal and spatial specificity [32, 33]. Yet, it may be more difficult to capture signal from tissue along the sulcus with surface electrodes [28]. Vermaas et al has shown that the amplitude of measured brain potentials rapidly declines with distance from the source, which could be especially problematic for measuring non-synchronous sources at distance [34]. This factor will thus determine if depth electrodes are necessary for optimal decoding.
This study aimed to elucidate the four features by decoding overtly spoken words based on 7 T fMRI data. In addition, we establish how variations in these characteristics qualitatively affect the decoding results by estimating the similarity of confusion matrices, and investigate potential implant locations outside the SMC.
2. Methods
2.1. Participants
Twelve healthy subjects (average age 28 ± 3 years; 5 male; 1 left-handed) participated in the current study. Prior to scanning, all subjects gave written informed consent in agreement with the Declaration of Helsinki (World Medical Association, 2013) and the study was approved by the medical-ethical committee of the University Medical Center Utrecht. The sample size was chosen based on results of previous experiments classifying gestures [31, 35] and mouth movements [23] using activity in SMC.
2.2. Data acquisition
All MRI and fMRI measurements were performed on a whole-body 7T Philips Achieva MR system (Philips Healthcare, Best, The Netherlands), using a volume transmit/32-channel receive head-coil (Nova Medical, MA, USA). For tB0 shimming, a 3D B0 map (3D gradient echo, echo time (TE) = 1.56 ms, repetition time (TR) = 4 ms, field of view (FOV) = 240 (AP) × 180 (RL) × 112 (FH) mm, voxel size = 3.75 mm isotropic, flip angle (FA) = 10°, acquisition time = 11.4 s) was acquired. First- (linear) and second-order shim settings were optimized using the MR Code software (TeslaDC, Zaltbommel, The Netherlands). Anatomical T1-weighted MP2RAGE [36] images (3D gradient echo, TE = 2.2 ms, TR = 6.2 ms,, FOV = 240 (AP) × 163 (RL) × 240 (FH), voxel size = 0.8 mm isotropic, FA = 5°, 5 min and 13.5 s duration) of whole-brain were acquired in sagittal orientation.
During the fMRI experiment, the functional data was recorded in transverse orientation using an EPI-sequence with the following parameters: TE = 25 ms, TR = 1400 ms, FOV = 226 (AP) × 184 (RL) × 52 (FH) mm, voxel size = 1.75 mm isotropic, FA = 60°, number of slices = 30, interleaved slice acquisition order, anterior-posterior phase encoding direction and the slice stack was angulated in order to have the FOV accommodating both the left and right ventral portion of the pre- and postcentral gyrus. A total of 1806 functional volumes were acquired for each subject in 6 runs. At the start of the fMRI acquisition, a single functional volume with identical parameters except for a reversed phase-encoding blip was acquired for unwarping during image preprocessing. The subjects used prism glasses and a mirror to visualize the stimuli that were projected through a waveguide on a 27 × 9.5 cm screen by a projector (Benq W6000) outside the scanner room and were instructed to articulate words while restricting other movements during the task.
2.3. Task design
In order to select the words to be overtly spoken during the language task, seven articulator positions in the mouth cavity were tracked using DeepLabCut (version 2.2rc3) [37–39] on a whole-brain anatomical movie (10 frames per second) created from a mid-sagittal MRI of the brain (T1-weighted Fast Field Echo, TE = 1.5 ms, TR = 3.2 ms,, FOV = 248 (AP) × 200 (RL) × 10 (FH), FA = 1°, 5 min and 31 s duration) in which a healthy participant (age 27, male) articulated 49 (Dutch) words and pseudo words previously used in four language paradigms within our research group. We manually labelled 200 frames of which 95% was used for training. A ResNet-50-based neural network was used with 500.000 training iterations in order to label the remainder of the frames. From the seven articulator positions tracked, seven articulator features were created which allowed us to profile every spoken word. Affinity propagation [40] was performed on the word profiles to cluster the words repeated on the scanner in six clusters, with each cluster being represented by an exemplar. All six exemplars were selected as the words used in the language task during the fMRI experiment (KOE, MOEMA, ZIEZOE, ZOEZA, KAKOE, MI). For a more detailed description of this method, refer to the supplement 2.
The subjects were instructed to overtly pronounce the 6 different pseudo, which have no established meaning according to the Dutch or English dictionary. Words were pronounced in isolation (KOE, MOEMA, ZIEZOE, ZOEZA, KAKOE, MI) as soon as each one, presented in random order, was displayed on the screen during the fMRI task.
The interval between stimuli was 14 s (acquisition time of 10 volumes; figure 1), allowing the BOLD response to return to baseline. In each run of the fMRI experiment each word was repeated 5 times, totalling 30 stimuli per class. The same randomized order of stimuli was used for all participants.
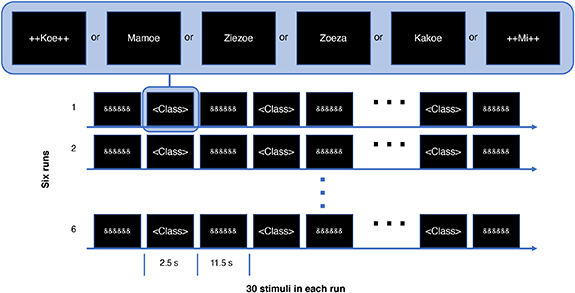
Figure 1. Schematic of the task paradigm presented to the participants during the fMRI acquisitions. Each participant performed the task over 6 runs, with each run consisting of 30 stimuli. Every word was pronounced as soon as displayed in the screen. The '&&&&&&' between word presentations and the padding with '++' symbol for some of the pseudo-words was done to minimize variation in visual input during the task.
Download figure:
Standard image High-resolution image2.4. Data pre-processing
The fMRI data was pre-processed using SPM12 (www.fil.ion.ucl.ac.uk/spm/) and custom scripts in MATLAB R2021a (The Mathworks Inc., Natick, MA). Preprocessing included slice time correction, realignment and unwarping of the functional images. FSL 6.0 [41] (https://fsl.fmrib.ox.ac.uk/fsl/fslwiki/FSL) top-up [42] was used, in combination with the functional volume acquired with reversed phase encoding blip, to correct for susceptibility-induced distortions. The resulting functional images were subsequently co-registered to the anatomical image. Timeseries where then high-pass filtered using a kernel with a cut-off at 70 s and the mean was subtracted from the timeseries for each run.
Subsequently, FreeSurfer 7.0 [43] (https://surfer.nmr.mgh.harvard.edu) was used to reconstruct the cortical surface based on the acquired anatomical images. The FreeSurfer parcellation according to the Desikan-Killiany atlas [44] was used to define the precentral and postcentral gyrus of both hemispheres. An additional ROI was defined that included the eroded cerebral white matter. This ROI served as control area for assessing confounding effects through motion artefacts resulting from the mouth movements (see section (1) confounding effects of motion).
2.5. Classification
For classification, the volumetric pre-processed functional data of each run was mapped to the cortical surface (see Data pre-processing section) while using an enclosing voxel algorithm, and sampled at a fractional distance of 0.7 times the grey matter thickness from the white matter surface. When a single voxel enclosed multiple vertices in the surface, these were condensed into a single value to avoid biased weighting of single voxels in the subsequent analysis. Machine learning classification was thus performed on only vertices with unique values, while using a multiclass support-vector machine (SVM). A leave-one-run out cross-validation scheme (LORO-CV) was implemented to avoid dependencies between the training and testing datasets. For each one of the six runs, the following steps were performed, whereby for each iteration, a different run was left out for training and later used to test the model: (1) a general linear model (GLM) [45] was fitted on the training data using one regressor per class plus six head movement parameters, and subsequently generating a single t-map for each class; (2) for each ROI, a mask was created including a pre-specified number of vertices with the highest t-value across the six t-maps. This number of included vertices was based on a previously observed optimum when classifying based on activity in SMC [31]. Note that the voxel selection could vary slightly between iterations of the LORO-CV, due to incomplete overlap datasets (80%); (3) the maximum raw BOLD signal of the 4th, 5th and 6th volume (4.9 s, 6.3 s, and 7.7 s) capturing the BOLD response after every stimulus onset while excluding scans containing speech-movement artifacts, was extracted for each selected vertex, which served as features for learning and testing; and (4) for each stimulus, the maximum signal over the included 4th, 5th and 6th volumes after stimulus onset was used as the feature for training and testing the SVM. The SVM procedure was repeated several times in each subject for the analyses described below, while using different ROIs and slight variations in settings:
2.5.1. Confounding effects of motion
To monitor potential confounding of the results by motion artefacts due to overt speech production, we performed ten multiclass SVM classification. Instead of the peak of the BOLD response, we separately used each one the ten functional volumes following the onset of each stimulus during task as feature. This was performed for both the entire SMC, as well as the cerebral white-matter mask.
2.5.2. Testing the effect of hemisphere and gyrus
For this analysis, we defined nine ROI clusters, consisting of several compositions of the left and right hemispheres, and the precentral and postcentral gyrus (i.e. left precentral, right precentral, left postcentral, right postcentral, left precentral & postcentral, right precentral & postcentral, left & right precentral, left & right postcentral, left & right precentral & postcentral). Each segment of an ROI cluster (i.e. left precentral, right precentral, left postcentral, right postcentral) included the 200 voxels with the highest t-value. Group-wise results were analysed using a repeated measures GLM with 2 within-subject factors, including gyrus (3 layers; precentral/postcentral/combined) and hemisphere (3 layers; left/right/combined).
2.5.3. Testing the effect of sulcal depth
For establishing the effect of sulcal depth, a total of 45 ROIs were defined, which consisted of the 9 ROI clusters described in the previous paragraph, divided along 5 sulcal depths. In this analysis, for each segment of an ROI cluster (i.e. left precentral, right precentral, left postcentral, right postcentral), vertices were sorted in five equally sized groups based on their sulcal depth as established during the FreeSurfer surface reconstruction [44, 46, 47], and from each group the 40 vertices with the highest t-values were selected. Group-wise results were analyzed using a repeated measures GLM with 3 within-subject factors, including gyrus (3 layers; precentral/postcentral/combined), hemisphere (3 layers; left/right/combined), and sulcal depth (5 layers; i.e. the 5 depths). To establish the potential benefits of supplementing gyral with sulcal information, the analysis was repeated with an incremental inclusion of vertices along sulcal depth, with the first ROI including depth 1, the second depth 1 and 2, the third depth 1, 2, and 3, etc.
2.5.4. Testing the effect of the position along the ventral-dorsal axis
To determine changes in classification accuracy along the ventral-dorsal axis of SMC, we again created 45 ROIs which were subdivisions of the nine ROI clusters that were described for the analyses for detecting effects of gyrus and hemisphere. To establish coordinates along the ventral-dorsal axis for all vertices in the SMC, the surface representations of the SMC were warped to a rectangular shape using the Cgrid-toolbox [48] (https://github.com/UMCU-RIBS/Cgrid). These coordinates were expressed in a percentage of the entire length of the SMC. For each segment of an ROI cluster (i.e. left precentral, right precentral, left postcentral, right postcentral), vertices were sorted in five equally sized groups based on these coordinates. From each group the 40 vertices with the highest t-values were selected. Note that as due to between-subject variation in brain-size and subsequent variation in the portion of SMC that was inside the FOV of the fMRI acquisition, the mean coordinate for each of the five subdivisions varied between subjects. The effect of position along the dorsal ventral axis was therefore estimated using a least squares (2nd order) polynomial fitting procedure instead of a repeated measures GLM.
2.5.5. Similarity of represented information
To assess potential differences in the nature of the represented information across the SMC, we estimated the coefficient of determination (R2) of the group-mean confusion matrices between hemispheres, across sulcal depth, between precentral and postcentral gyrus, and along the dorsal-ventral axis.
2.5.6. Classification outside the SMC
To test for the presence of brain areas outside the SMC that allow classification of speech production, a multivariate searchlight-analysis [49, 50], was performed. For each vertex, an SVM was trained and tested including the activity of the 200 most proximate vertices (with unique values) across the inflated surface. The classification procedure was otherwise similar to the one described above. This resulted in a classification accuracy for every vertex in the surface. For groupwise analysis, the single-subject results were registered to a symmetrical surface template [51], and a one-sided one-sample t-test in SPM12 was used for detecting vertices with accuracy above the theoretical chance level (p < 0.05; FWE corrected).
3. Results
We assessed the ability to discriminate between the six words based on the activity within the SMC. Chance level classification was set at 16.67%, which validity was confirmed using a permutation test (16.65% with 100 permutations).
3.1. Confounding effects of motion on classification
To guarantee that the analysis was not confounded by motion artifacts induced by overtly pronouncing the six pseudo-words in the scanner, we performed classification procedures for each one of the ten functional volumes following stimulus onset as feature in the SVM classification procedure (figure 2). We found enhanced classification in both SMC and white matter for the first 2 volumes acquired directly after stimulus onset, indicating that the overt production of words substantially impacted the signal. After the first two volumes, the classification rapidly declined in both ROIs and resembled a BOLD-response-like shape, indicating that the functional volumes we used for feature extraction, i.e. the 4th, 5th and 6th (covering the period between 4.9–7.7 s after each stimulus when taking slice timing correction into account) were not impacted by motor artefacts. The white matter classification remained close to the theoretical chance level within this period, with a mean classification of 19.63% (std = 4.1%; range = 16.1%–23.1%).
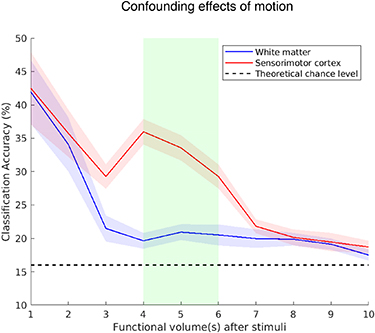
Figure 2. Group mean (n = 12) classification accuracy when choosing a particular functional volume post stimulus onset for feature selection in the cerebral white-matter (blue line) and the sensorimotor cortex (red line). The shaded area surrounding the mean reflects the standard error. The green area reflects the time-interval that was used for selecting the peak of the bold response, which was then used as feature in the classification procedure.
Download figure:
Standard image High-resolution image3.2. Testing the effect of hemisphere and gyrus on classification
For assessing the optimal hemisphere and gyrus for an implant, we performed a repeated measures GLM. There was a significant main effect of hemisphere (F1.2,13.2 = 10.08; p = 0.005) and ROI (F1.3,14.6 = 8.63; p = 0.007) (figure 3). Post hoc analysis revealed that these were caused by higher classification in pre-and postcentral combined, than in the pre-and postcentral gyrus separately (F1,11 = 52.35; p < 0.001), and by higher classification for both hemispheres combined, than for the separate hemispheres (F1,11 = 89.65; p < 0.001). There was no significant difference between the left and right hemisphere (F1,11 = 0.41; p = 0.54), and no significant difference between the precentral and postcentral gyrus (F = 0.35; p = 0.57).
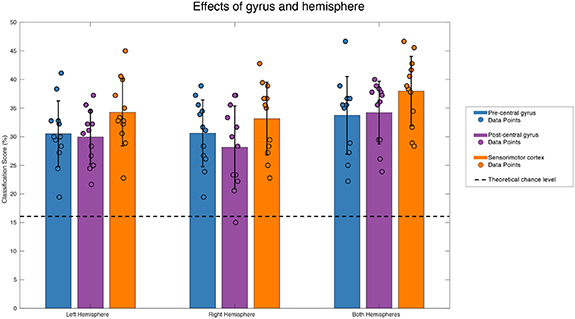
Figure 3. Group mean (n = 12) classification accuracy in percentage correct for the nine rois. Results of individual subjects are indicated by coloured dots. Bars indicate the standard-error of the mean. The theoretical chance level is represented by a dashed black line.
Download figure:
Standard image High-resolution image3.3. Testing the effect of sulcal depth on classification
To assess the optimal sulcal depth for a speech BCI, we performed classification while selecting features from across 5 depth intervals within 9 ROIs (figures 4(A)–(C)). There was a main effect of sulcal depth (F4,44 = 2.67; p = 0.044). This was caused by a quadratic trend (F1,11 = 9.78; p = 0.01), roughly describing better classification in gyral than sulcal areas. There was no interaction between sulcal depth and gyrus (F8,88 = 0.36; p = 0.829), or between sulcal depth and hemisphere (F8,88 = 1.28; p = 0.290). In line with the previous analysis, there was a main effect of hemisphere (F1.3,14.8 = 19.27; p < 0.001) and gyrus (F1.4,15.2 = 9.221; p = 0.005), both caused by better performance when combining hemispheres (F1,11 = 171.718; p< 0.001) or gyri (F1,11 = 51.608; p < 0.001), then when using a single hemisphere or gyrus.
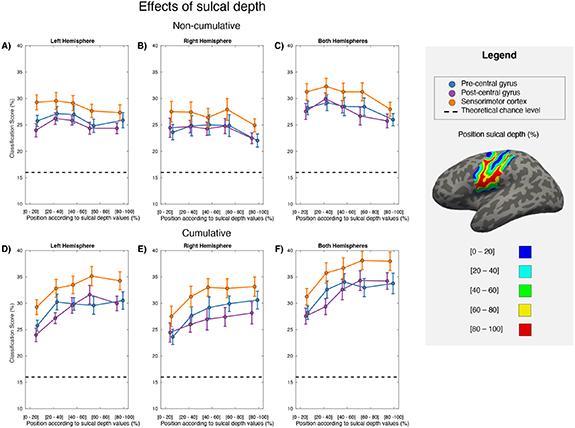
Figure 4. Group mean (n = 12) classification accuracy (in percentage) along the sulcal depth intervals for the left (A) & (D), right (B) & (E), and both hemispheres combined (C) & (F). The precentral, postcentral gyrus, and the combination of the two are indicated by different colours. Sulcal depth is represented in percentage measured from the surface of the cortex (0%) to the deepest vertex values (100%) present on the Freesurfer parcellation. The theoretical chance level is represented by a dashed black line.
Download figure:
Standard image High-resolution imageTo assess the value of supplementing gyral with sulcal information, we performed the analysis cumulatively, with the available depth intervals becoming broader with each layer included (figures 4(D)–(F)). There was a main effect of sulcal depth (F1.9,21.0 = 20.25; p< 0.001), consisting of a linear (F1,11 = 23.16; p < 0.001) and a quadratic trend (F1,11 = 25.85; p < 0.001), which in combination described improved classification when cumulatively adding sulcal information, but with diminished return. This analysis also included a significant main effect of gyrus (F1.3,14.8 = 14.79; p < 0.001 for cumulative) and hemisphere (F1.3,14.8 = 19.27; p < 0.001 for cumulative), explained by better classification when using both hemispheres (F1,11 = 103.60; p < 0.001 for cumulative), and both gyri (F1,11 = 79.72; p < 0.001).
3.4. Testing the effect of position along the ventral-dorsal axis on classification
To assess the optimal positioning of a speech-BCI implant in the SMC along the ventral-dorsal axis, we performed classification while selecting features from across 5 dorsal/ventral positions for each subject within 9 ROIs. A second-order polynomial was fitted for each ROI, explaining the classification accuracy as a function of the position along the ventral-dorsal axis (figure 5). Visual inspection revealed no differences between hemispheres and gyri (i.e. overlapping confidence intervals), but better performance when combining gyri and hemispheres, which is in line with the results from the previous analyses. To assess the extent of the coverage necessary to include the area of maximum classification, we determined the location of the peak of the polynomial fits. Subsequently we determined the 2 dorsal-ventral locations corresponding to the classification accuracy of its 95% confidence intervals. The peak locations and their intervals are displayed in table 1, where a relative large spread is observed due to the inexistence of a sole peak at a particular vertex. The peak and interval proportional distance when combining hemispheres and gyri was 28.88 ([5.04−52.72]).
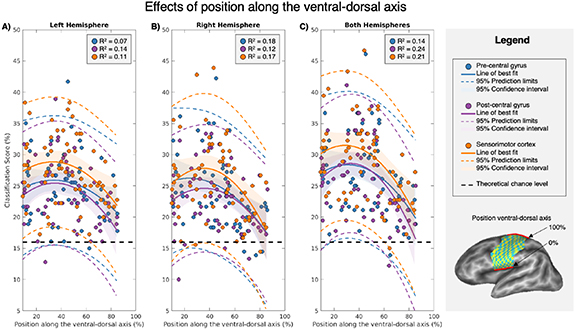
Figure 5. Group mean (n = 12) classification accuracy along the ventral-dorsal axis in percentage for the left (A), right (B), and both hemispheres (C). The position along the ventral-dorsal axis is represented in a percentage of the entire length of the SMC from its most ventral position (0%) to its most dorsal position (100%). The precentral gyrus, the postcentral gyrus, and the combination of the two are represented in different colours. Scores of individual subjects for each dorsal-ventral location are indicated by the coloured dots. All classification accuracies are surrounded by their respective 95% confidence intervals and the 95% prediction limits. The theoretical chance level is represented by a dashed black line.
Download figure:
Standard image High-resolution imageTable 1. Locations of peak classification along the ventral-dorsal axis for the different ROIs. The upper and lower bound correspond to the edges if the interval has to be enclosed to include the location of peak classification with a 95% certainty.
| Peak location | Lower bound | Upper bound | |
|---|---|---|---|
| Left precentral gyrus | 33.98 | 4.47 | 63.47 |
| Left postcentral gyrus | 34.82 | 11.05 | 58.58 |
| Left sensorimotor cortex | 33.13 | 7.24 | 59.04 |
| Right precentral gyrus | 23.87 | 0.00 | 54.15 |
| Right postcentral gyrus | 35.75 | 11.34 | 60.17 |
| Right sensorimotor cortex | 35.09 | 12.46 | 57.73 |
| Both precentral gyri | 31.00 | 4.89 | 57.12 |
| Both postcentral gyri | 33.33 | 12.85 | 53.82 |
| Both sensorimotor cortices | 28.88 | 5.04 | 52.72 |
3.5. Similarity of represented information
To get more detailed insight in the performance of the model, a mean confusion matrix across subjects was created (figure 6). The percentage of correctly classified trials for each word ranged from 33.3%–45.0%. Visual inspection of the confusion matrix revealed that most errors in classification occurred between similarly pronounced words (such as 'ZIEZOE' and 'ZOEZA', with the presence of 'Z'; and 'MOEMA' and 'KAKOE' with the presence of the diphthong 'OE') and, to a lesser extent, between words with the same number of syllables (such as 'KOE' and 'MI', with one syllable) (figure 6).
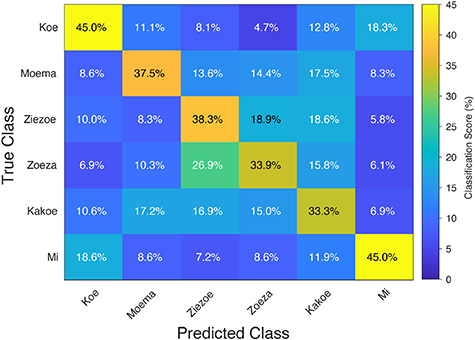
Figure 6. Group mean confusion matrix (n = 12) with classification accuracy in percentage for all words using the entire sensorimotor cortex (both hemispheres and both gyri). The vertical axis shows the actual label, the horizontal axis shows the predicted label. Perfect performance would amount to a 100% classification on the diagonal from upper left corner to the lower right corner.
Download figure:
Standard image High-resolution imageSubsequently, these confusion matrices were calculated for the two hemispheres, the two gyri (precentral/postcentral), the five depth intervals, and five positions along the ventral-dorsal axis in order to further grasp the nature of the information presented. Note that for the latter case (dorsal-ventral axis), all confusion matrices (60 in total) were sorted on five groups based on their ventral-dorsal location, and then an average confusion matrix was calculated for each group. The resulting 14 confusion matrices can be found in Supplement two. After creation of the mean confusion matrices, the R2 was calculated between the different hemispheres, gyri, sulcal depths, and positions along the dorsal ventral axis. These were 0.96 between the precentral and postcentral gyrus, and 0.88 between the precentral and postcentral gyrus. The R2 between different sulcal depths and between different positions along the ventral-dorsal axis are displayed in figure 7. The R2 values were all higher than 0.74, except between the most dorsal position in SMC and the more ventral positions. To test for evidence of differences in classification patterns between the areas, we fitted straight lines through the scatterplots comparing the values in the group-mean confusion matrices [52]. As standard deviations along the x and y-axis we used the standard errors of the mean. Then we calculated the χ2 and the probability that the calculated straight-line fit was not the correct model. For none of the fits this probability was larger than 5% (both with and without correction for multiple comparisons), meaning there is no evidence that the patterns of any of the compared group-mean confusion matrices were different.
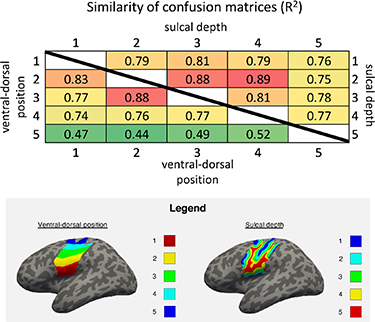
Figure 7. R2 between the group mean confusion matrices of different sulcal depths (upper right half) and ventral-dorsal positions (lower left half). Below, in the legend, we show an example for one of the volunteers of the topographic distribution of each layer: on the left, regions from 1 to 5 (coloured in red, yellow, green, cyan and blue respectively) show the several ventral-dorsal regions used in the analysis; on the right, regions from 1 to 5 (coloured in blue, cyan, green, yellow and red respectively) show the distinct sulcal depth regions used in the analysis.
Download figure:
Standard image High-resolution image3.6. Classification outside the SMC
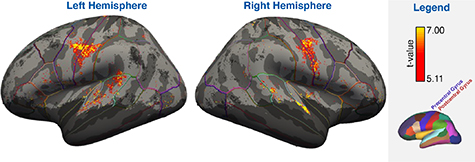
A searchlight SVM approach was used to identify areas potentially suited for word classification outside the SMC. The results of the one-sample t-test against the theoretical chance level shows significant performance of the SVM is in the superior temporal gyrus and left planum temporale, in addition to the ventral SMC (figure 8). Note that the pattern of inclusion highlighted with the light blue line in figure 8 is complex and fragmented due to the individual variations present in the curvature of the brain.
Figure 8. Significant groupwise (n = 12; p < 0.05; FWE-corrected at t ⩾ 5.11) searchlight classification results while including the pseudo-word trials, superimposed on the inflated surface template for the left and right hemispheres. The dark shaded portions of the surface were excluded from the groupwise analysis due to insufficient coverage. Additional lines of assorted colours demarcate the borders of the ROIs included in the DK-atlas of FreeSurfer.
Download figure:
Standard image High-resolution image
4. Discussion
In this study, we have explored word classification during overt speech using high field fMRI to infer preferred characteristics of an implantable speech-based BCI in the SMC. We investigated characteristics including the preferred gyrus, hemisphere, depth of the recording, and optimal position along the ventral/dorsal axis. For this purpose, we decoded spoken pseudo-words based on their BOLD response. We show that it is possible to classify six pseudo-words in isolation, based on BOLD responses in the SMC, with accuracies significantly above chance level in all subjects (figure 3). Neither a classification preference for the left or right hemisphere, nor for the precentral or postcentral gyrus was observed. Classification accuracy slightly decreased with sulcal depth, and the highest classification was within the ventral 50% of the SMC.
Previous fMRI experiments have demonstrated the feasibility of decoding mouth actuators from the SMC. Correia et al obtained significant classification based on BOLD activity during voiced and whispered phonatory gestures with lips, tongue and velum [26], and Bleichner et al used 7T fMRI BOLD responses to classify mouth movements [23]. The classification accuracies that these studies measured were higher than those we observed, which may be linked to the use of simpler linguistic components (phonemes and mouth movements versus words). Further proof for feasibility of predicting speech from SMC activity comes from ECoG measurements that successfully used high-band fluctuations (>50 Hz), to decode several linguistic components at different levels of complexity including phonemes [20, 22, 53], syllables [34], words [18, 54]), and sentences [27]. Accuracy of decoding based on ECoG tends to exceed that of fMRI, most likely because of the higher signal-to-noise ratios (SNR) and temporal resolution (capturing sequences of articulator movements), which leads us to believe that our classification results would have been higher if signals were obtained with subdural electrodes. The lower accuracies may however have affected our ability to detect the smaller variations in classification across brain areas, but the smaller variations are also less relevant for decision-making on where to implant electrodes.
We did not observe differences in classification between the left and right SMC, indicating no a-priori preference for a particular hemisphere for a speech implant. While left lateralization in language areas during speech production is well established [55–58], the issue is less evident for areas representing the direct motor output to the articulators. For example, Pulvermüller et al showed that mouth motor movements strongly activated the SMC bilaterally [59]. However, we observe that including both hemispheres for classification did improve performance relative to including a single hemisphere. This could in theory indicate that the nature of the information represented in the two hemispheres is supplemental instead of similar. However, the mean confusion matrices when classifying using only the left or right hemispheres were nearly identical (figure 6), which likely reflects that the movement representations are similar in nature. Including both hemispheres simultaneously might effectively enhance the SNR for the classifier, without actually tapping into qualitatively different additional information. It is thus unclear if for an implanted BCI, for which SNR and temporal resolution are substantially higher, a bilateral implant would be beneficial.
We found no performance differences when classifying separately based on the precentral or postcentral gyrus. Furthermore, the similarity of confusion matrices for the precentral and postcentral gyrus points to redundancy of information for speech decoding in the two gyri, indicating that an implant on either gyrus would suffice. However, while this shows that for the included healthy subject population there is no a-priori preference, the situation may be different for patients who are eligible for and implanted BCI, who have lost their ability to move. For these patients the BCI would be driven by attempted instead of executed movements, which could in theory decrease postcentral activity due to an absence of sensory feedback. Although it has been shown that postcentral activity can be used to classify attempted hand movements in patients with hand denervation due to arm amputation [41], so far, no studies have done so for attempted speech in paralyzed participants. While imagined movements in healthy subjects could be a theoretical substitute, these have shown to be more difficult to classify from the primary motor cortex [60], making it unclear to what extent their associated neuronal activity patterns resemble those of attempted movements in speech-disabled people [35, 61]. This issue should be further investigated in individuals with paralysis of the articulators or locked-in syndrome, such as late-stage ALS patients.
The decoding performance of the SMC varied depending on the position in the ventral-dorsal axis, with the highest performance within the ventral 50% (figure 5). This is consistent with studies that decoded speech based on direct neuronal recordings from the SMC [62, 63], and is also in line with the location of the representations of the articulators according to fMRI [64]. Note however that the similarity of the confusion matrices throughout the ventral portion of the SMC was high, without apparent variations between locations linked to different articulators.
This is surprising when assuming a topographic structure of articulator representations, e.g. such as proposed by the classical homunculus, with larynx, tongue and lips being sequentially represented when going from ventral to dorsal positions among the sensorimotor cortices. As the differential engagement of articulators varies between pairs of words, different portions of topographic motor cortex would vary in their ability to discriminate between particular words. This would induce systematic variations in confusion matrices along the ventral-dorsal axis, which were not observed.
This seems to imply that representations of word production are relatively widely distributed across the ventral SMC, and not mapped to the topographic representations of the individual articulators as described by Penfield and Boldery [65]. This is also in line with most current speech-BCI implants, where decoding is largely driven by the neuronal patterns across this area [27, 66]. Alternatively, the isolated articulator activity for different words could be unique enough to allow for significant word classification in any location in the ventral SMC.
We found that the gyral portions of the SMC performed slightly better for word classification than sulcal portions, which supports a preference using surface instead of depth recordings for an implantable speech BCI. While we did observe that supplementing the support vector machines (SVM). with sulcal in addition to gyral information did facilitate classification (figure 4), it is unclear if this implies the existence of neuronal sources deeper in the sulcus that provide unique information to the classification process. Similar as for the two hemispheres, there was minor variation in the confusion matrices across sulcal depth. Similar as for combining the two hemispheres, the improvement with combining information across sulcal depth may be the result of effectively enhancing SNR instead of including information of a qualitatively different nature. Note, however, that risks and invasiveness associated with the implantation of depth electrodes are far lower than for surface electrodes, meaning that they could still be viable alternatives under certain conditions [67, 68].
Using a searchlight analysis, we found that classification was also feasible from large portions of the superior temporal gyrus (figure 8). Whether the activity in the superior temporal gyrus could actually be used for a BCI based on attempted speech is unclear. The superior temporal gyrus has been implicated in several aspects of phonological processing [69–74]. Significant classification in this area might thus be caused by auditory feedback following word production e.g. through bone conduction (given the noise generated by the scanner), especially considering the existence of dedicated mechanisms in the superior temporal gyrus for recognizing speech in noisy environments [72, 74]. Alternatively, significant classification in the superior temporal gyrus may be the result of corollary discharge signals from the speech-production to the auditory system, which help to accurately predict the expected acoustic consequences of one's own movements [75]. Significant classification in the superior temporal gyrus thus needs to be replicated for attempted speech in paralysed patients. In addition, the searchlight analysis revealed significant classification performance within the left planum temporale, coinciding with a part of Wernicke's area. This area has amongst others been implicated in the retrieval of phonological forms [76], which could explain differential activity during word production. For this area as well, it needs to be established if its significant classification is based on the perception or the production of words. Note that the current experiment used pseudo words, which were optimized for differential activity in the SMC.
Other important issue in interpreting the current results is whether these fMRI findings can be generalizable to implantable speech BCIs, which would be driven by electrophysiological signals instead of the BOLD response. While there are obvious differences in the nature of underlying signals, previous experiments have shown a high correspondence in localization between 7T fMRI and small high-density ECoG signal measurements [32, 77–79]. Furthermore, our group has shown clear evidence on the benefits of using fMRI to predict implanted BCIs [17]. An additional issue is the potential confound of the fMRI signal by artifacts as a result of overt mouth movements inside the scanner [80]. While we observed that initial functional volumes after stimuli were very likely affected by this, the selection of functional volumes outside this initial interval allowed in principle for unconfounded feature extraction. We thus do not believe that our classification results are artificially boosted relative to those of a subdural implant. Note, however, that these speech related artifacts impose limits on the types of stimuli that can be investigated using fMRI, excluding e.g. sentences or continuous speech.
Furthermore, the used sparse event-related fMRI design substantially limits the number of trials and thus the number of different words that could be tested. The included set of (pseudo) words may thereby not be fully representative of normal spoken language. In fact, as words were chosen based on maximally differential articulator engagement, the chosen approach may relatively enhance classification in the SMC as opposed to other brain areas. That said, we believe that it is highly unlikely that this would have affected the patterns of differential classification within the SMC that we observed, as the included words combined did engage all the articulators.
Finally, the current experiment used a dedicated speech decoding task, and the number of included subjects was relatively low, albeit not by fMRI standards. Nevertheless, we found significant (variations in) classification of produced words across several areas of the SMC. These effects were all observed using 2nd-level statistics, thereby guaranteeing generalizability and reproducibility in other subjects. Increasing the sample size would theoretically enhance the sensitivity in establishing the smaller variations in decodability between the areas in the SMC. However, these smaller differences are also less clinically relevant in the guidance of where an intracranial BCI should be implanted, as they either less impact the performance of the BCI or are less consistent across subjects.
The findings of this study can directly help the guide implantation for a speech BCI. While ideally the optimal implantation location would be determined for every patient individually prior to implantation using fMRI, this is impossible due to the limited time that patients who are locked-in can lie supine in the scanner (which also serves to assess patients' ability to comply with simple task instructions), need for MRI compatible ventilation systems, stress level of patients and difficulty of ascertaining task compliance due to severely limited communication via eye tracker or letter board [81]. In most cases the fMRI procedure prior to implantation is thereby restricted to a basic on/off block designs. The resulting activity maps provide subject-specific activity foci serving to guide surgical grid implantation [82], but do not provide direct information on which brain areas provide discriminative information. However, supplementing the activity maps of a blocked design with the results from the current study (serving as a standardized atlas of informativity) will help to determine which of the activated voxels are likely to provide the best information for discriminating words.
5. Conclusion
We explored word classification to infer recommendations for an optimal implantable speech BCI, in particular focusing on the preferred gyrus, hemisphere, depth of recording, and optimal position along the ventral/dorsal axis. We observed no preference for a particular hemisphere or gyrus, a slight gyral compared to sulcal preference, and optimal classification within the ventral 50% of the SMC. Future research should replicate these findings for attempted speech in paralyzed patients.
Acknowledgments
Grant Number: Dutch Science Foundation SGW-406-18-GO-086.
Data availability statement
All data that support the findings of this study are included within the article (and any supplementary files).
Supplementary data (1.4 MB PDF)
Supplementary data (6.9 MB PDF)