Abstract
Objective. Code-modulated visual evoked potential (c-VEP) based brain–computer interfaces (BCIs) exhibit high encoding efficiency. Nevertheless, the majority of c-VEP based BCIs necessitate an initial training or calibration session, particularly when the number of targets expands, which impedes the practicality. To address this predicament, this study introduces a calibration-free c-VEP based BCI employing narrow-band random sequences. Approach. For the encoding method, a series of random sequences were generated within a specific frequency band. The c-VEP signals were subsequently elicited through the application of on-type grid flashes that were modulated by these sequences. For the calibration-free decoding algorithm, filter-bank canonical correlation analysis (FBCCA) was utilized with the reference templates generated from the original sequences. Thirty-five subjects participated into an online BCI experiment. The performances of c-VEP based BCIs utilizing narrow-band random sequences with frequency bands of 15–25 Hz (NBRS-15) and 8–16 Hz (NBRS-8) were compared with that of a steady-state visual evoked potential (SSVEP) based BCI within a frequency range of 8–15.8 Hz. Main results. The offline analysis results demonstrated a substantial correlation between the c-VEPs and the original narrow-band random sequences. After parameter optimization, the calibration-free system employing the NBRS-15 frequency band achieved an average information transfer rate (ITR) of 78.56 ± 37.03 bits/min, which exhibited no significant difference compared to the performance of the SSVEP based system when utilizing FBCCA. The proposed system achieved an average ITR of 102.1 ± 57.59 bits/min in a simulation of a 1000-target BCI system. Significance. This study introduces a novel calibration-free c-VEP based BCI system employing narrow-band random sequences and shows great potential of the proposed system in achieving a large number of targets and high ITR.
Export citation and abstract BibTeX RIS
1. Introduction
Brain–computer interfaces (BCIs) establish a direct communication channel between brains and external devices bypassing the involvement of muscles (Wolpaw et al 2002). In recent years, electroencephalography (EEG) based non-invasive BCIs are the most employed due to the performance, practicability and safety (Ramadan and Vasilakos 2017). Among all paradigms used in BCIs, the visual evoked potential (VEP) based BCIs have demonstrated the largest instruction set (Han et al 2023), and the highest information transfer rate (ITR) (Nicolas-Alonso and Gomez-Gil 2012, Nakanishi et al 2018). In a VEP based BCI system, each target can be encoded by a unique stimulus sequence. Depending on the encoding method, different VEPs can be elicited, including flash VEP, motion-onset VEP, code-modulated VEP (c-VEP), and steady-state VEP (SSVEP) (Gao et al 2014).
SSVEP based BCIs have gained widespread attention because of the high accuracy and ITR. In an SSVEP based BCI, stimulus sequences of targets can be encoded by a joint frequency-phase modulation (JFPM) method (Cheng et al 2002, Wittevrongel and Van Hulle 2016). Each target corresponds to a specific frequency and phase, eliciting phase-locked and frequency-tagged SSVEP responses. Using the JFPM method, Nakanishi et al implemented an SSVEP based BCI system with 40 targets and achieved the highest reported ITR of 325.33 bits/min (Nakanishi et al 2018). Nevertheless, some studies argued that c-VEP based BCIs are better suited for multiple-target encoding and can outperform SSVEP based BCIs (Bin et al 2009, Kapeller et al 2013, Volosyak et al 2020). In a c-VEP based BCI, targets can be encoded using either single or multiple random sequences (Martínez-Cagigal et al 2021). When using a single sequence, profiting from the auto-correlation property of pseudorandom sequences such as m-sequences and gold sequences, multiple targets can be encoded by cyclic shifting one pseudorandom sequence (Bin et al 2011). On the other hand, when using multiple sequences, targets can be encoded by different sequences with good cross-correlation characteristics (Thielen et al 2015, 2021, Nagel and Spüler 2019a). C-VEP based BCIs exhibit higher encoding efficiency, and the number of targets can be easily expanded by employing more sequences (Wei et al 2018, Nagel and Spüler 2019b). However, in an SSVEP based BCI, the number of targets is limited by factors such as frequency band, frequency resolution, and refresh rate. Among c-VEP based and SSVEP based BCIs with over 100 targets, c-VEP based BCI demonstrated a better performance. For instance, Chen at al presented an SSVEP based BCI with 120 targets utilizing the JFPM method and achieved the highest average ITR of 213.23 bits/min among SSVEP based BCIs with over 100 targets (Chen et al 2022). However, this encoding method encounters challenges when requiring more targets or less calibration time. The number of targets was increased by decreasing the frequency interval between targets, and subjects need to traverse all targets in the calibration session, which results in a lower accuracy and a longer calibration time. By contrast, Sun et al proposed a c-VEP based BCI with 120 targets encoded by four gold sequences utilizing cyclic shifting method, which achieved an average ITR of 265.74 bits/min (Sun et al 2022). This pseudorandom sequence based encoding method can increase the number of targets by introducing new sequences, and the calibration time does not increase significantly since subjects undertake the calibration session corresponding to one target from each sequence.
One of the most significant limitations for c-VEP based BCIs is the absence of calibration-free algorithms. In comparison to SSVEP, c-VEP encompasses a broader frequency band and more complex features, which makes it difficult to implement a calibration-free c-VEP based BCI using power spectral density analysis or canonical correlation analysis (CCA) (Lin et al 2006). In recent years, some researchers have proposed algorithms based on the relationship between the sequences and c-VEPs (Spüler et al 2013, Turi et al 2020). These algorithms aimed to reduce or eliminate the need for calibration time and achieved satisfactory performances. For systems employing a single sequence, the lags between targets can be utilized for calibration. For instance, Spüler et al employed only two targets with a specific lag for unsupervised calibration and achieved an average accuracy for 85.06% (Spüler et al 2013). By extracting the relative lags of c-VEPs evoked by successive trials and predicting the results by a dictionary, Turi et al proposed a word-prediction based calibration-free method and achieved an average ITR of 35.7 bits/min (Turi et al 2020). This lag-based calibration-free method required an accurate estimation of the relative lag of single-trial c-VEP, resulting in relatively long trial lengths that decreased the ITR. For systems using multiple sequences, classification results can be predicted based on the relationship between sequences and c-VEPs. For instance, Thielen et al proposed a calibration-free system and achieved an average ITR of 68.3 bits/min, which employed a reconvolution method and estimated c-VEP responses from sequences (Thielen et al 2021). Although the system required initialization with one long trial, the parameters of the algorithm were updated online, and the performance would be improved after several trials. This method achieved the highest reported ITR among the calibration-free c-VEP based BCIs, but it required a good performance of the first several trials, and selecting more sequences for encoding is challenging since the performance would deteriorate if the selected sequences were unsuitable for generalization using the reconvolution method (Thielen et al 2015).
In this study, a calibration-free c-VEP based BCI employing narrow-band random sequences is proposed. In the proposed system, the targets were modulated by narrow-band random sequences, whose energy was constrained within a fixed, narrow frequency band. According to the experimental results, the evoked c-VEP features exhibited a high relevance to the sequences, including fundamental and harmonic responses of the sequences, which made the system suitable for calibration-free applications. For the decoding algorithm, this system implemented filter-bank CCA (FBCCA) (Chen et al 2015a) with templates generated from the sequences. Considering the latency of the hardware and visual pathway, basic templates were generated by incorporating latencies into the original sequences. Besides, considering the potential interdependencies among c-VEP sources, the second order templates were derived from the Hadamard products of basic templates. The experimental results demonstrated that this method could achieve comparable performance to the SSVEP based system with a frequency band of 8–15.8 Hz using FBCCA. Furthermore, this method is more suitable for a large instruction set than the SSVEP based methods.
The remaining parts of the paper are organized as follows. The second section introduces the materials and methods of the proposed system, including the code generation method, the decoding algorithm, and the information of experiments. The third section presents the results of the experiments and parameter optimizations. The fourth section discusses implications and future directions of the proposed method. The last section gives out conclusions of the study.
2. Methods
2.1. Code generation
Narrow-band random sequences were employed in this study. As illustrated in figure 1, there were three steps to generate one narrow band random sequence with a specific frequency band energy distribution. In the initial step, a random sequence with a range of −1–1 was generated based on the stimulus duration and the refresh rate of the monitor, which was regarded as the original sequence. For instance, in this study, the stimulus duration of each sequence was one second, and the refresh rate of the monitor was 120 Hz. Consequently, the length of the random sequence was 120 digits. Second, the energy of the original sequence was filtered into a specific frequency band (15–25 Hz in figure 1). Considering the boundary effect, in the second step, the original sequence was repeated three times and concatenate together to construct a 360-digit length sequence before filtering, and the middle 120 digits were selected for the subsequent step. In the third step, the filtered sequence was element-wise divided by its envelope and normalized to a range of −1 to 1. This step aimed to enhance the strength of the stimulus and make all generated sequences have the same brightness range. The energy of the generated sequence remained concentrated at 15–25 Hz.
Figure 1. The sequence generation method, the waveforms, and the corresponding spectra. (a) The procedure to generate one narrow band random sequence. (b) Waveforms of three sequences corresponding to three steps. The top sequence is the original random sequence. The middle sequence is the filtered sequence (blue) and its envelope curve (red). The energy of the original sequence is filtered into 15–25 Hz. The bottom sequence is the proposed narrow band random sequence after element-wise division and normalization. The refresh rate of the monitor is 120 Hz, and the stimulus duration is one second, therefore the sequences has 120 points. (c) Spectra of three sequences.
Download figure:
Standard image High-resolution imageThe sequence generation program is written in MATLAB 2015b and ran in a Windows 10 environment. To generate a series of sequences, the cross-correlation coefficients were utilized as the evaluation metric. In this study, random search was used to find sequences with cross-correlation coefficients approaching zero, aiming to maximize orthogonality between sequences. First, one initial random sequence was generated. Second, a new random sequence was generated, and the Pearson correlation coefficient between the initial sequence and the second sequence was calculated. If the absolute value of the correlation coefficient was under the pre-defined threshold, then the second sequence was remained, otherwise the sequence was discarded and generated again. Third, one more sequence was generated, and the correlation coefficients between the existing sequences and this sequence were calculated. The new sequence was remained when all the correlation coefficients satisfied the threshold constraint. The threshold was set according to the consuming time. If the system could not find a new sequence in 60 min, then the threshold was increased by 0.05, and the generating process was restarted from the generation of the initial sequence. Finally, two sets of narrow-band random sequences consisting of 40 sequences with a sequence length of 120 digits were generated: sequences with a frequency band from 15 to 25 Hz (NBRS-15), and sequences with a frequency band from 8 to 16 Hz (NBRS-8). In addition, 40 sequences of SSVEP using the JFPM method with a frequency band from 8 to 15.8 Hz, a frequency interval of 0.2 Hz, and a phase interval of 0.5 π (JFPM-8) were employed for comparison. 8–15.8 Hz was a well-established frequency band in the previous SSVEP based BCI with multiple targets (Chen et al 2014b, 2015a, Nakanishi et al 2018), and NBRS-8 was generated to compare with JFPM-8. Considering the spectral characteristics of the narrow-band random sequences, the 8–13 Hz alpha band components might affect the c-VEP components in the same frequency band. Therefore, NBRS-15 was generated to investigate the system performance when the frequency band of the sequences avoids the overlap with the alpha band.
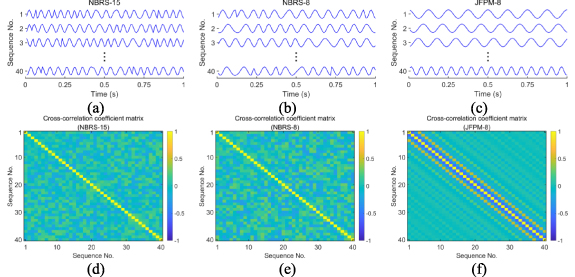
The sequences and the cross-correlation coefficients matrices are illustrated in figure 2. When the sequence length was 120 digits, the range of cross-correlation coefficients of NBRS-15, NBRS-8, and JFPM-8 are −0.2496–0.2489, −0.2988–0.3000, and −0.5657–0.4980, respectively. NBRS-8 has higher absolute values of cross-correlation coefficients compared to the NBRS-15 because of the narrower frequency band (8 Hz vs 10 Hz). For JFPM-8, the maximum absolute values of cross-correlation coefficients were the highest since one-second sequence did not have sufficient frequency resolution. The values of the sequences were provided in the supplementary files, named 'NBRS-15.mat', 'NBRS-8.mat', and 'JFPM-8.mat'. The sequences are saved in MATLAB MAT files with a dimension of 40 × 480 (40 sequences, 4 s, with a refresh rate of 120 Hz).
Figure 2. The sequences employed in this study and the cross-correlation coefficients matrixes of the sequences. Three kinds of sequences are employed in this study: (a) narrow-band random sequences with a frequency band from 15 to 25 Hz (NBRS-15), (b) narrow-band random sequences with a frequency band from 8 to 16 Hz (NBRS-8), and (c) sequences generated by joint frequency-phase modulation (JFPM) method with a frequency band from 8 to 15.8 Hz (JFPM-8). The corresponding cross-correlation coefficients matrices of (d) NBRS-15, (e) NBRS-8, and (f) JFPM-8 present the cross-correlation coefficients between different pairs of sequences.
Download figure:
Standard image High-resolution image2.2. Calibration-free decoding algorithm
2.2.1. Decoding algorithm.
In an SSVEP based BCI, one of the most commonly used calibration-free algorithms is CCA (Lin et al 2006). CCA can find the spatial filter that maximizes the correlation coefficient between SSVEP and the reference template. The correlation coefficient can be derived as follows:

where  is the maximum correlation coefficient,
  is the EEG data, and
  is the reference template.
  and
and  are the weight vectors for
  and
and  .
.
By utilizing the information of different sub-bands, filter bank can further enhance the decoding performance (Chen et al
2015a). The EEG data are filtered by multiple filters with different sub-bands. All filters have a common upper cutoff frequency in the pass-band, and the interval of lower cutoff frequencies corresponds to the bandwidth of the sequence (e.g. 15 Hz for NBRS-15, 8 Hz for NBRS-8 and JFPM-8). After filtering, standard CCA algorithm obtains one CCA score for each sub-band. The FBCCA score  can be computed by the weighted sum of these CCA scores:

where  is the CCA score of the
  sub-band and the
  type,
type,  is the weight of the
  sub-band.
  is defined as follows:

where  and
and  are the constant parameters of the weight
  , and
, and  is the number of sub-bands.
2.2.2. Template generation.
For SSVEP-based BCIs, the reference templates can be simply constructed by sinusoidal signals corresponding to the fundamental and harmonic frequencies of the stimuli:
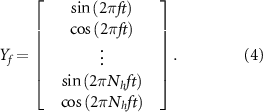
However, this is incompatible with the proposed method employing narrow-band random sequences. Therefore, this study proposed a template generation method for the proposed c-VEP based BCI system. To align the sequences and EEG data, the sequences were resampled to 250 Hz before template generation. A selected sequence was denoted as  , where
  was the length of
  . Assuming there was a correspondence between sequences and VEP and considering the latency of visual pathway, the basic template can be constructed as:

where  is the basic template, which is composed by sequence
  with
with  latencies and a latency interval of
  .
.  is the sequence
  with a latency of
  . To make all
  have the same length, zero paddings are added at the beginning of
  :
:

where  is derived from
  by discarding the last
  digits of
  . Aligning the sequences and c-VEPs could be challenging due to the uncertainty of visual pathway latency, and this basic template mitigates the influence of this issue. This delaying and padding method could be regarded as a template augmentation strategy, which was also applied in EEG augmentation (Liu et al
2021).
The basic templates only contain the fundamental information of c-VEPs, which is not suitable for FBCCA. Assuming there are non-linear interactions between the basic features of c-VEP, it becomes necessary to construct the high-order templates to utilize the non-linear features. In this study, the multiplicative relationship between fundamental components were considered, and the second order templates could be presented as follows:

where  is the element-wise multiplication, which could be called Hadamard product. The second order template
  is the Hadamard product of the basic templates
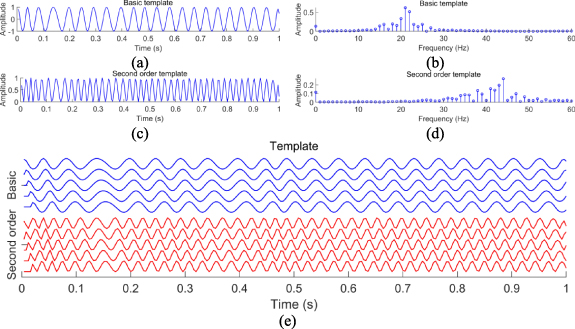
  with itself. For instance, figure 3 illustrates the reference template generated from NBRS-15. It can be observed that the frequency band energy of the second order template is concentrated in range of 30–50 Hz (figure 3(d)), which is the second harmonic of the sequence and can provide the information of the non-linear features when utilizing FBCCA algorithm.
Figure 3. The temporal and spectral characteristics of templates generated from one 15–25 Hz sequence. (a) One basic template with a latency of zero. (b) The spectrum of the basic template. (c) The second order sequence, which is the Hadamard product between the basic template and itself. (d) The spectrum of the second order template. (e) The reference template generated from the sequence when the number of latencies is 5 and interval is 1. The basic template is composed by sequence with 5 different latencies with an interval of 1 point, and the second order template is the Hadamard product between the basic template and itself.
Download figure:
Standard image High-resolution image2.3. Metrics
ITR is utilized to evaluate the performance of the BCI system (Wolpaw et al 2002):

where  (in seconds) is the target selection time including the data length and the gaze shift time,
  is the number of targets, and
  is the classification accuracy. The gaze shift time was estimated as 0.5 s in this study (Chen et al
2015b).
2.4. Subjects
Totally 35 subjects (20 males, 15 females, aged 21–52 years, average age 29 years) participated in the experiments. All subjects had normal or corrected to normal vision. All subjects were asked to read and sign an informed consent form before experiments. This study was approved by the Ethics Committee of Tsinghua University.
2.5. Data acquisition
EEG data were recorded by a 64-channel wireless EEG acquisition system (Neuracle, Ltd. Changzhou, China) with a sample rate of 1000 Hz using wet electrodes. 9-channel (Pz, POz, PO3, PO4, PO5, PO6, Oz, O1, O2) data were selected and down sampled to 250 Hz before data analysis. A notch filter at 50 Hz was applied to eliminate the power-line noise. The event triggers were marked at the beginning of stimuli using a parallel port. During data acquisition, electrode impedances were kept under 20 kΩ, and subjects were seated about 60 cm away from the monitor for stimulus presentation.
2.6. Online experiments
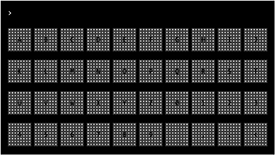
The online experiments were developed using Python and Psychopy package (Peirce 2007). The graphical user interface (GUI) of the system is presented in figure 4, which is a 40-target BCI speller (including A–Z, 0–9, space, comma, period and backspace). The on-type grid stimulus was used in the experiments (Ming et al 2023). Each target in figure 4 consists of stationary background areas (dark gray) with brightness of approximately 25 cd m−2 and stimulation areas (light gray grids) that presented flickers with brightness exceeding the brightness of background areas. Three paradigms with different sequences were implemented in the experiments, in which the targets were modulated by NBRS-15, NBRS-8, and JFPM-8. The refresh rate of the monitor was 120 Hz, and each narrow band random sequence had 120 frames (1 s). The stimulation areas of each target on the screen were modulated by the brightness according to the employed sequences (brightness range: 25–200 cd m−2). In each trial, the GUI presented a cue for 1 s to make subject focus on the highlighted target, then all targets flickered for 4 s (4 repetitions of the narrow band random sequence). After stimulation, the calculated result was highlighted on the GUI as a feedback for 1 s. One block contained 40 trials traversing all targets, and each kind of paradigm contained 3 blocks. Different subjects watched three kinds of sequences in a random order to minimize the influence of fatigue between different paradigms. In the online experiment, the latency of visual pathway, the parameters of the templates (i, p) and FBCCA algorithm (pass-band of the fundamental filter, N, a, b) were set to a default value (table 1). The sub-bands could be calculated by pass-band and N. For instance, for NBRS-15, the pass-band was 10–80 Hz, N was 2, and the interval between lower cutoff frequencies of sub-bands was 15 Hz. Therefore, the sub-bands for NBRS-15 were 10–80 Hz and 25–80 Hz. Visual pathway latencies of JFMP, NBRS-15 and NBRS-8 were estimated as 140, 120, and 120 ms. A latency of 140 ms was commonly applied in VEP based BCIs (Bin et al 2011), while for NBRS-15 and NBRS-8, the latency was estimated as 120 ms. The estimated latencies for NBRS-15 and NBRS-8 were shorter than that of JFPM-8 because there was already a delay in the reference templates when applying FBCCA to NBRS-15 and NBRS-8 (see equation (6)).
Figure 4. The graphical user interface (GUI) of the speller with 40 targets. The speller includes 26 English letters, 10 digits, space, comma, period and space. The on-type grid stimulus is used in the experiments. During the experiments, only the light gray grids present flickers.
Download figure:
Standard image High-resolution imageTable 1. Default parameters of the algorithm, including the parameters of the templates (i, p) and FBCCA algorithm (pass-band of the fundamental filter, N, a, b).
| Sequences |

|

| Pass-band (Hz) |

|

|

|
|---|---|---|---|---|---|---|
| NBRS-15 | 1 | 5 | 10–80 | 2 | 1.25 | 0.25 |
| NBRS-8 | 1 | 5 | 6–80 | 2 | 1.25 | 0.25 |
| JFPM-8 | / | / | 6–90 | 7 | 1.25 | 0.25 |
2.7. Statistical analysis
In this study, repeated-measures analysis of variance (RMANOVA) was utilized for the statistical analysis. Greenhouse-Geisser correction was applied in case the sphericity assumption was not satisfied. Paired t-test was performed for pairwise comparisons. All pairwise comparisons were corrected by Bonferroni correction. Significant level was set at 0.05.
3. Results
3.1. EEG characteristics
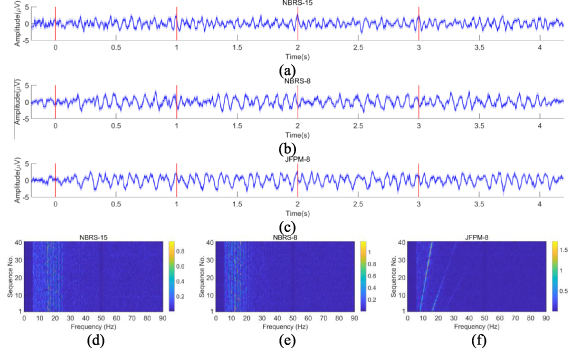
Figure 5 presents the EEG features at Oz channel corresponding to three paradigms. For EEG analysis, all EEG data were filtered using a 50 Hz notch filter and a 6–90 Hz band pass filter, and the latency of the visual pathway was estimated as 140 ms. The average EEG waveform of the first sequence (corresponding to 'A' in GUI) across all subjects (figures 5(a)–(c)) shows that strong c-VEP and SSVEP responses were evoked by narrow-band random sequences and JFPM sequences. The spectrum features corresponding to three paradigms (figures 5(d)–(f)) depicts that the evoked c-VEP and SSVEP had similar frequency band energy distribution to the corresponding sequences. It was difficult to observe harmonics of c-VEPs evoked by NBRS-15 and NBRS-8, while SSVEP evoked by JFPM-8 showed clear features of the second and third harmonics.
Figure 5. Average EEG waveforms and spectra corresponding to three kinds of sequences at Oz. The average EEG waveforms for (a) NBRS-15, (b) NBRS-8, and (c) JFPM-8 are the average EEG data of the first sequence (corresponding to 'A') across all trials. The vertical red bars marked the start points of each second after the stimulation onset. The blue shaded areas indicate the standard errors. Average spectra for (d) NBRS-15. (e) NBRS-8, and (f) JFPM-8 includes the spectra of all sequences. Each row presents the spectrum of average EEG data corresponding to one sequence.
Download figure:
Standard image High-resolution imageFigure 6 presents the cross-correlation matrix of the average EEG data corresponding to different sequences with a data length of 1 s. All EEG data were filtered using a 50 Hz notch filter and a band pass filter within the fundamental frequency band of the sequences (e.g. 15–25 Hz for NBRS-15, 8–16 Hz for NBRS-8 and JFPM-8). The cross-correlation coefficients of NBRS-15, NBRS-8, and JFPM-8 were ranged from −0.5666 to 0.5762, −0.5956 to 0.5976, and −0.8172 to 0.6031, respectively, which had the same magnitude relationship to the cross-correlation characteristics of the encoding sequences.
Figure 6. Cross-correlation coefficient matrices of the average EEG data corresponding to (a) NBRS-15, (b) NBRS-8, and (c) JFPM-8, which present the cross-correlation coefficients between different pairs of sequences.
Download figure:
Standard image High-resolution image3.2. Online experiment results
Accuracies and ITRs of the online experiment using the default parameters are shown in figure 7. One-way RMANOVA indicated that online accuracy (F(2, 68) = 3.627, p< 0.05) and ITR (F(2,68) = 4.649, p < 0.05) were significantly affected by encoding method. JFPM-8 paradigm achieved the best performance with an average accuracy of 89.36 ± 16.63% and an average ITR of 59.30 ± 15.39 bits/min. NBRS-15 achieved lower average accuracy of 87.48 ± 17.70% and an average ITR of 57.48 ± 16.54 bits/min, while there was no significant difference between NBRS-15 and JFPM-8 (pairwise comparison, p > 0.05). NBRS-8 performed the worst among three paradigms with an average accuracy of 81.93 ± 20.18% and an average ITR of 51.91 ± 18.25 bits/min, which were significantly lower than the accuracy and ITR performance of JFPM-8 (pairwise comparison, p < 0.01).
Figure 7. Online (a) accuracy and (b) ITR results of three paradigms. Results are calculated using FBCCA with a data length of 4 s. Error bars indicate the standard errors. The scatters mark the individual results of each subject.
Download figure:
Standard image High-resolution image3.3. Offline analysis with parameter optimization
For narrow-band random sequences, the templates were first optimized to find a better i and p. Then, the parameters of FBCCA were optimized to further enhance the accuracy. For JFPM-8, only the parameters of FBCCA were optimized. The pass-bands were optimized according to the harmonics of the sequences, and N, a, b were optimized using a grid search method. The optimized parameters were presented in table 2. The visual pathway latencies were the same to the default values.
Table 2. Optimized parameters of the algorithm, including the parameters of the templates (i, p) and FBCCA algorithm (pass band of the fundamental filter, N, a, b).
| Sequences |

|

| Pass-band (Hz) |

|

|

|
|---|---|---|---|---|---|---|
| NBRS-15 | 2 | 2 | 10–80 | 3 | 3 | 0.5 |
| NBRS-8 | 1 | 4 | 6–50 | 3 | 2.5 | 0.25 |
| JFPM-8 | / | / | 6–90 | 6 | 1.25 | 0.25 |
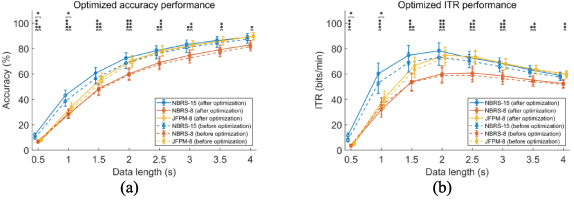
The results of offline analysis with optimized parameters were presented in figure 8. For both accuracy and ITR, Two-way ANOVA presented main effects of data length (accuracy: F(1.797, 61.109) = 442.929, p < 0.001; ITR: F(1.520, 51.685) = 87.969, p < 0.001) and paradigm (accuracy: F(1.553, 52.797) = 8.896, p < 0.005; ITR: F(1.494, 50.779) = 11.555, p < 0.001), and there were significant interactions of data length and paradigm (accuracy: F(3.426, 116.496) = 3.948, p < 0.01; ITR: F(3.524, 119.830) = 6.766, p < 0.001). After the optimization, all paradigms achieved better accuracy and ITR (pairwise comparison, p < 0.05). NBRS-15 achieved comparable accuracy and ITR performances as JFPM-8 (pairwise comparison, p > 0.05), and the accuracy and ITR were significantly higher than JFPM-8 when the data length was 0.5 or 1 s (pairwise comparison, p < 0.05). For NBRS-8, the accuracies and ITR were improved after optimization, but were still significantly lower than JFPM-8 (pairwise comparison, p < 0.005). When the data length was 2 s, NBRS-15 achieved the highest average ITR of 78.56 ± 37.03 bits/min and an average accuracy of 72.60 ± 24.22%. When the data length was 4 s, NBRS-15 could achieved an average ITR of 59.03 ± 15.52 bits/min and the highest average accuracy of 89.02 ± 16.78%.
Figure 8. The (a) accuracy and (b) ITR results of three paradigms under different data lengths. The dashed lines are the results before optimization of the algorithm parameters, and the solid lines are the results after optimization. Data lengths range from 0.5 to 5 s with an interval of 0.5 s. Error bars indicate the standard errors. Asterisks is longitudinally plotted on the figure to denote the significance between results before and after optimization (t-test, *: p < 0.05, **: p < 0.01, ***: p < 0.01).
Download figure:
Standard image High-resolution image4. Discussions
4.1. Encoding efficiency
According to the experiment results, the superior performance of NBRS-15 compared to NBRS-8 can be attributed to several factors. First, it is easier to find a set of sequences with good cross-correlation characteristics under a frequency band of 15–25 Hz than 8–16 Hz because of the bandwidth. The wider bandwidth provides more flexibility in designing sequences, resulting in a better cross-correlation characteristic. Second, the frequency band of 15–25 Hz does not overlap with the alpha band (8–13 Hz), which makes c-VEPs evoked by 15–25 Hz sequences less influenced by the spontaneous alpha rhythm. As shown in figure 5(d), the energy of alpha band was lower than the fundamental response of sequences, but was still at a relatively high value, which could affect the target detection of NBRS-8. As shown in figure 8, when the data length is under 2 s, the average accuracies and ITRs of NBRS-15 were higher than JFPM-8, which could be attributed to the factor that when the length of the sequences decrease, the encoding efficiency of JFPM sequences become worse since the frequency resolution decrease. According to figure 2, the cross-correlation characteristics of JFPM-8 is inferior to NBRS-15, which can also explain this phenomenon.
4.2. Template performance
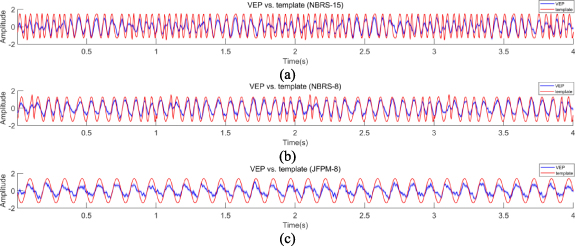
When using FBCCA, c-VEP based system employing NBRS-15 achieved a comparable performance as SSVEP based system employing JFPM-8. Figure 9 presents the spatial filtered average VEPs and the templates utilizing CCA with one sub-band for the three paradigms corresponding to the first sequence. The correlation coefficients between VEP and template of NBRS-15, NBRS-8 and JFPM-8 are 0.8237, 0.9170, and 0.8911, respectively, which indicates the strong relevance between evoked VEPs and the encoding sequences. To further investigate the separability of the VEPs, figure 10 presents the FBCCA scores matrix of the three paradigms. It is clear that the average FBCCA scores are higher when using the EEG data with the templates matching its corresponding sequences. Furthermore, figure 10 indicated that the FBCCA scores of NBRS-15 and NBRS-8 have a relatively balanced distribution, while the FBCCA scores of JFPM-8 were larger for higher stimulation frequencies. This phenomenon is probably attributed to the similar frequency band energy distribution across different narrow-band random sequences.
Figure 9. Spatial filtered average VEPs and the templates utilizing CCA with the fundamental sub-band for (a) NBRS-15 (b) NBRS-8 and (c) JFPM-8 of the first sequence (corresponding to 'A'). The waveforms are calculated using the average VEPs and optimized reference templates. The blue shaded areas indicate the standard errors.
Download figure:
Standard image High-resolution imageFigure 10. FBCCA score matrixes of (a) NBRS-15, (b) NBRS-8, and (c) JFPM-8. The FBCCA scores are calculated using the optimized parameters of the algorithm. Each point presents the average FBCCA score between VEPs corresponding to one target and reference templates corresponding to one sequence.
Download figure:
Standard image High-resolution imageAccording to the online results and the optimization results, both filter bank and second order templates contributed to the decoding of c-VEPs evoked by narrow-band random sequences. The optimized parameters indicated that FBCCA performed better when using 3 sub-bands, suggesting that the generated template might provide information of the harmonics. To confirm this hypothesis, accuracies were calculated under four conditions: using basic templates without a filter bank (T1), using basic templates with a filter bank (T1 + FB), using basic and second order templates without a filter bank (T1 + T2), and using basic and second order templates with a filter bank (T1 + T2 + FB). The results are presented in figure 11. Two-way ANOVA presented significant main effects of data length (NBRS-15: F(2.196, 74.668) = 279.496, p < 0.001; NBRS-8: F(1.706, 57.997) = 227.352, p < 0.001) and condition (NBRS-15: F(1.184, 40.268) = 13.576, p < 0.001; NBRS-8: F(1.658, 56.386) = 28.198, p < 0.001), and there were significant interactions (NBRS-15: F(6.387, 217.172) = 3.655, p < 0.005; NBRS-8: F(6.170, 209.766) = 11.353, p < 0.001). Pairwise comparison results showed that there were no significant differences under T1 condition and T1 + FB condition when employing both NBRS-15 and NBRS-8 (pairwise comparison, p > 0.05). Conversly, accuracies calculated under T1 + T2 + FB condition were significantly higher than accuracies calculated under T1 + T2 condition employing both NBRS-15 and NBRS-8 (pairwise comparison, p < 0.005). This observation proved the significance of the second order templates and revealed that filter bank could extract additional information together with the second order templates.
Figure 11. The accuracy performance under different data lengths of (a) NBRS-15 and (b) NBRS-8 under four conditions: using basic templates without filter bank (T1), using basic templates with filter bank (T1 + FB), using basic and second order templates without filter bank (T1 + T2), and using basic and second order templates with filter bank (T1 + T2 + FB). Data lengths range from 0.5 to 5 s with an interval of 0.5 s. Error bars indicate the standard errors.
Download figure:
Standard image High-resolution image4.3. Multiple target performance
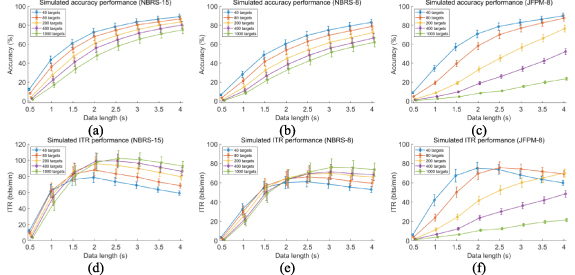
When the number of targets further increases, the performance of narrow-band random sequences is supposed to outperform JFPM sequences because of the high encoding efficiency. The performance of BCI systems with more targets was evaluated with an offline simulation. In the simulated BCI system, although EEG data corresponded to only 40 targets, the target identification was performed utilizing a classifier with more classes. When using FBCCA, more classes imply more sequences. Therefore, for the simulation of BCI systems with more targets, beginning with the existing 40 sequences, more sequences were further generated using the same method as the online experiments. The labels of the EEG data remained within the range of 1–40, corresponding to the existing 40 sequences. However, the classification results were calculated using all generated sequences to simulate the accuracy and ITR when implementing the BCI system with more targets. Figure 12 illustrates the performance of simulated multiple-target system including 40, 80, 200, 400, and 1000 targets for the three paradigms. For JFPM-8, the target number was increased by reducing the frequency interval. For narrow-band random sequences, more sequences were generated and the cross-correlation coefficients of NBRS-15 and NBRS-8 were −0.5–0.5 and −0.55–0.55, respectively. Although accuracies of narrow-band random sequences decrease, the highest ITRs gradually increased with the growing number of targets. When employing NBRS-15 sequences, the 1000-target system achieved an average simulated ITR of 102.1 ± 57.59 bits/min when the data length was 2.5 s. However, for JFPM sequences, the accuracies and ITR decrease sharply when the target number exceeded 80. More targets meant smaller frequency intervals for JFMP sequences since the frequency band of sequences is fixed, and the separability of SSVEPs with short sequences was reduced. Pairwise comparisons proved the performance difference between narrow-band random sequences and JFPM sequences. For all three paradigms, when the number of targets increased, accuracies significantly decreased (pairwise comparison, p < 0.001), and the ITR of JFPM-8 also significantly decreased with the increasing number of targets (pairwise comparison, p < 0.005). However, for NBRS-15, the ITR significantly increased as the target number increased until reaching 400 (pairwise comparison, p < 0.05), and there was no significant difference between 400 and 1000 targets (pairwise comparison, p > 0.05). Similarly, for NBRS-8, the ITR significantly increased as the number of targets increased to 80 (pairwise comparison, p < 0.005), and there was no significant differences when the number of targets further increased (pairwise comparison, p > 0.05). In summary, a c-VEP based BCI using NBRS-15 can achieve similar performances to an SSVEP based BCI with FBCCA algorithm when the target number is 40, and the performance of c-VEP based BCI employing NBRS-15 is better when the target number further increases, indicating the high encoding capacity of narrow-band random sequences.
Figure 12. Accuracy and ITR results of multiple target simulation using FBCCA under different data lengths. The simulated accuracy performances of (a) NBRS-15, (b) NBRS-8, and (c) JFPM-8 are calculated using VEPs corresponding to 40 targets and reference templates corresponding to 40 or more sequences. ITR performance of (d) NBRS-15, (e) NBRS-8, and (f) JFPM-8 are calculated using simulated accuracy results. Data lengths range from 0.5 to 5 s with an interval of 0.5 s. Error bars indicate the standard errors.
Download figure:
Standard image High-resolution imageTo further verify the simulation results, three subjects were recalled to participate in a multi-target experiment employing NBRS-15. In this experiment, subjects did a total of 6 blocks. In each block, the GUI was the same as figure 4, while the encoding sequences were different of all blocks, which was randomly selected from the generated 1000 NBRS-15 sequences, and the selected sequences did not include the initial 40 sequences used in the first online experiments. Subjects were asked to do the same tasks as the first online experiments. For the FBCCA algorithm, the parameters were the optimized value in table 2, and the algorithm executed 1000-target classification while the screen presented the 40-target GUI. Finally, the experiment results were presented in figure 13. The NBRS-15 achieved the highest average ITR of 193.4 ± 34.21 bits/min when the data length was 1.5 s, and the online performance could match the offline simulation results, which validated the feasibility of the 1000-target system using narrow-band random sequences. To our knowledge, the average ITR of 193.4 bits/min surpassed most of the existing calibration-free SSVEP based BCIs (Chen et al 2014a, 2015a, 2021).
Figure 13. (a) Accuracy and (b) ITR results of multiple target online experiment using 1000 NBRS-15 sequences under different data lengths. The thin lines present the individual results, and the bold lines present the average results. The individual results of three subjects are marked using circles, diamonds, and upward-pointing triangles, respectively. The solid lines are the online performance, and the dashed lines are the simulated results of the same subjects. Data lengths range from 0.5 to 5 s with an interval of 0.5 s. Error bars indicate the standard errors.
Download figure:
Standard image High-resolution image4.4. Future work
In the future, following issues could be considered to improve the proposed method. For the sequence selection, the suitable frequency band of the sequences could be more detailly investigated. In this study, NBRS-8 and NBRS-15 sequences were employed. Although NBRS-15 sequences achieved promising results in the online experiments, the performance could be further improved by optimization of sequence selection. Narrow-band random sequences with different frequency band energy distributions, or with different bandwidths could be further explored to enhance the system performance. For decoding algorithms, the experiment results have indicated that the proposed system is suitable for calibration-free implementation. To enhance the decoding efficiency, two directions could be considered. First, online learning could be used to reduce the startup time of the system with calibration. When utilizing an ensemble TRCA algorithm (with filter bank parameters were described in table 2), NBRS-15 sequences achieved an average ITR of 114.4 ± 69.31 bits/min when the data length was 1 s, which indicated that supervised algorithms could significantly enhance the system performance. By online adaptive learning algorithms such as online adaptive CCA (Wong et al 2021), the system can transform from a calibration-free system to a with-calibration system with higher performance. Second, EEG models such as EEG2Code model (Nagel and Spüler 2019a, 2019b) or reconvolution model (Thielen et al 2015, 2021) could be implemented in the proposed method. Since all sequences have the similar frequency band energy distribution, the c-VEP could probably be generated more accurately than employing pseudorandom sequences or other broadband sequences. For the purpose of control, the proposed method can be used for large instruction set systems with over 1000 targets, such as a map navigation system with multiple destination options, a simple drawing board with about 1000 pixels, or an alternative solution of eye trackers. Besides, the proposed method is supposed to be suitable for asynchronous control since c-VEP evoked by random sequences have demonstrated a good separability from the idle state (Nagel and Spüler 2019a, Zheng et al 2022).
5. Conclusions
This study proposed a novel c-VEP based paradigm with narrow-band random sequences for encoding and FBCCA for calibration-free decoding. The online BCI system achieved an average accuracy of 87.48 ± 17.70% and an average ITR of 57.48 ± 16.54 bits/min using NBRS-15, which were comparable to the SSVEP based system using FBCCA. In the simulated evaluation of a 1000-target BCI, the NBRS-15 based system achieved an average ITR of 102.1 ± 57.59 bits/min. These results indicated that narrow-band random sequences had a superior encoding efficiency, and achieved a better performance than SSVEP based system when encoding a large number of targets. The proposed method showed the potential for realizing high performance BCI towards practical applications.
Acknowledgments
This work was supported by the National Key R&D Program of China under Grant 2022YFF1202303, the National Natural Science Foundation of China under Grant 62071447, and the Project of Jiangsu Province Science and Technology Plan Special Fund in 2022 (Key research and development plan industry foresight and key core technologies) under Grant BE2022064-1.
Data availability statement
The data cannot be made publicly available upon publication because they are not available in a format that is sufficiently accessible or reusable by other researchers. The data that support the findings of this study are available upon reasonable request from the authors.


