
Abstract
Objective. During deep brain stimulation (DBS) the electrode–tissue interface (ETI) forms a critical path between device and brain tissue. Although changes in the electrical double layer (EDL) and glial scar can impact stimulation efficacy, the effects of chronic DBS on the ETI have not yet been established. Approach. In this study, we characterised the ETI surrounding chronically implanted DBS electrodes in rats and compared the impedance and histological properties at the electrode interface in animals that received daily stimulation and in those where no stimulation was applied, up to 8 weeks post-surgery. A computational model was developed based on the experimental data, which allowed the dispersive electrical properties of the surrounding encapsulation tissue to be estimated. The model was then used to study the effect of stimulation-induced changes in the ETI on the electric field and neural activation during voltage- and current-controlled stimulation. Main results. Incorporating the observed changes in simulations in silico, we estimated the frequency-dependent dielectric properties of the EDL and surrounding encapsulation tissue. Through simulations we show how stimulation-induced changes in the properties of the ETI influence the electric field and alter neural activation during voltage-controlled stimulation. A substantial increase in the number of stimulated collaterals, and their distance from the electrode, was observed during voltage-controlled stimulation with stimulated ETI properties. In vitro examination of stimulated electrodes confirmed that high frequency stimulation leads to desorption of proteins at the electrode interface, with a concomitant reduction in impedance. Significance. The demonstration of stimulation-induced changes in the ETI has important implications for future DBS systems including closed-loop systems where the applied stimulation may change over time. Understanding these changes is particularly important for systems incorporating simultaneous stimulation and sensing, which interact dynamically with brain networks.
Export citation and abstract BibTeX RIS

Original content from this work may be used under the terms of the Creative Commons Attribution 4.0 license. Any further distribution of this work must maintain attribution to the author(s) and the title of the work, journal citation and DOI.
1. Introduction
Deep brain stimulation (DBS) is a rapidly evolving, surgical treatment for several major neurological and psychiatric conditions, including Parkinson's disease, essential tremor, dystonia and obsessive compulsive disorder [1–5]. Recent advances in stimulation technology and a greater understanding of the underlying mechanisms of DBS are facilitating the development of more sophisticated stimulation paradigms which utilise closed-loop stimulation and complex electrode arrays to achieve better symptom control across a wider patient population [6–8]. The electrode–tissue interface (ETI) lies at the core of all neuromodulation systems, providing a critical connection between the device and neural tissue. The electrical double-layer (EDL) at the electrode–electrolyte interface and the tissue in the immediate vicinity together comprise the ETI and determine charge transfer into the brain parenchyma. Changes in the adjacent brain parenchyma including astrocytosis, neuroinflammation and neurodegeneration [9, 10] are well described for chronically implanted recording electrodes and can affect the impedance measured at the electrode. However, the influence of chronic high frequency stimulation on the ETI, due to a voltage or current continuously applied at the electrode, is not yet known. Specifically, it is not clear whether chronic DBS induces long-term changes at the electrode–electrolyte interface or in the encapsulation tissue formed during the foreign body response to electrode implantation, and, if so, what impact this has on the activation of neurons targeted during stimulation [11]. A comprehensive understanding of these factors is necessary to increase efficacy and longevity of DBS treatments and to facilitate the design of closed-loop DBS devices which can dynamically alter the stimulation delivered.
Implantation of the DBS electrode provokes the well-characterised foreign body response in the immediate vicinity of the electrode, which stabilises after approximately 4–8 weeks [9, 12]. Changes in electrode impedance and the glial response have been tracked using impedance spectroscopy and histological classification of the surrounding encapsulation tissue [13–17]. The histological formation of the glial scar including astrocytosis, microglial proliferation and mild neurodegeneration has been described for both passive recording and active stimulation electrodes, but it is unclear whether simulation induces changes in the intensity or structure of the glial response [11]. In addition, while the tissue composition of the glial scar, estimated to extend up to 122.5–162.5 μm from the electrode surface [16], has been described, its electrical or dielectric properties (conductivity and permittivity) are unclear and it is generally assumed to act as a passive, purely resistive barrier [18]. The measured electrode impedance decreases immediately after implantation due to oedema and bleeding, and then increases as the glial scar forms [11]. Impedance at active DBS electrode contacts has been shown to be lower than at unstimulated contacts [19, 20] and a reversible impedance drop is observed once stimulation commences [13, 19, 21]. However, the mechanisms behind these phenomena, in particular which components of the ETI are responsible for observed changes in impedance, and the resulting effect on the volume of neural tissue activated, are not yet known.
In this study, we used electrical impedance spectroscopy and histology to characterise the effect of chronic high frequency DBS on the impedance and brain parenchyma at the ETI in vivo in rats up to 8 weeks post implantation. Increased astrocytosis and reduced impedance were observed in the stimulation group. Mathematical modelling was used in combination with the in vivo data and in vitro measurements to identify the electrical properties of the double layer and the surrounding encapsulation tissue under stimulated and unstimulated conditions. Stimulation-induced changes in impedance were localised at the electrode–electrolyte tissue interface, and model-predicted changes in protein adsorption at the electrode interface due to chronic stimulation were confirmed in vitro. The functional significance of the observed stimulation-induced changes in ETI properties were examined in silico using computational modelling to simulate the electric field in the tissue surrounding the electrode, and DBS activation of subthalamic nucleus (STN) axon collaterals, with substantial changes in the region of neural tissue activated due to stimulation-induced changes in the ETI for voltage controlled stimulation.
2. Methods
An overview of the methodology is summarised in figure 1. And a detailed description of the methods is provided below. In brief, impedance spectroscopy and histology were used to characterise the effect of chronic stimulation on electrode impedance and histological properties of the encapsulation tissue in vivo. Mathematical modelling was used to characterise the electrical properties of the surrounding encapsulation tissue and of the EDL following stimulation, using the in vivo experimental data and impedance spectroscopy data measured in vitro in 0.9% saline solution. The electrical field distribution around the electrode and activation of STN axon collaterals were then simulated in silico, incorporating the experimentally observed stimulation-induced changes in the ETI and encapsulation tissue. Finally, hypothesised effects of stimulation on protein adsorption at the electrode–electrolyte interface were confirmed in vitro.

Figure 1. Methods overview. (a) Integration of in vitro, in vivo and in silico models. Electrode characterization via impedance spectroscopy in 0.9% saline solution was used to define the properties of the EDL. In vivo impedance spectroscopy and histology were used to characterise the effect of stimulation on electrode impedance and histological properties of the encapsulation tissue and identify encapsulation tissue electrical properties. Electrical field distribution and axon collateral activation were then simulated in silico. (b) Validation of model and stimulation-induced changes in protein adsorption. Impedance differences between stimulated and unstimulated electrodes are present in protein solution in vitro; visualization of protein adsorption at the electrode; pulse shape of the DBS pulse recorded in vivo.
Download figure:
Standard image High-resolution image2.1. In vivo rodent study
2.1.1. Animal study design
Stimulation electrodes were implanted into the left STN of 16 adult male naïve Wistar rats. Rat were chosen for their size and availability. Animals were operated in blocks with random group allocation within each block into either the stimulation group which received high frequency DBS starting 3 days after surgery (stimulation group, n= 9) or a control group in which the electrode remained inactive (no-stimulation group, n= 7). To provide histological controls, a stab incision or a craniotomy only was performed in the second hemisphere. Impedance measurements (described in section 2.1.5) were performed during surgery, daily for the first week and three times per week thereafter. After 8 weeks, rats were perfused with formalin and brains harvested for histological assessment. Analysis of the histological slides was fully or semi-automated. Blinding and assessment by two researchers was employed in operator dependent tasks. The sample size calculation with a power of 80% and α-level of 0.05 was based on a previously published impedance data by Williams et al [15] and the estimated effect of stimulation. In two additional rats, electrodes were implanted bilaterally to record the stimulation pulse and short-term changes in impedance during cessation and initiation of stimulation. All animal work was approved by the UCD Animal Research Ethics Committee (AREC 17–22) and licenced by the Health Product Regulatory Authority Ireland (AE18982-P122). The primary outcome measures were impedance, astrocyte density, microglial activation, neuronal loss and axonal damage. The animal comprised the experimental unit for impedance assessment and each hemisphere for histological assessment. Only animal completing the 8 weeks study period were included and welfare issues and technical failure resulted in exclusion.
2.1.2. Animal husbandry
Rats were housed in stable pairs with the following exceptions. After surgery rats were housed singly for up to 24 h to recover from the procedure and then reintroduced to their former cage-mate. Rats in the stimulation group had to be separated in the same cage, which facilitated visual, olfactory, auditory and limited tactile contact, during the lights-off period to prevent gnawing damage to the headstage. They were housed together during the lights-on period. These housing arrangements reflect a recent refinement in animal welfare for rats with cranial implants. The Rat Grimace Scale [22] and a facility specific health score system including weight checks were used for welfare assessments. These were carried out daily in the week following surgery and three times per week thereafter. Rats were assessed and treated in no set order.
General housing condition in a specific pathogen free facility included a 12/12 h light-dark cycle in a temperature (21.8 °C, SEM 0.02 °C, SD 0.21 °C) and humidity (49%, SEM 0.19%, SD 2.53%) controlled environment with access to water and standard rodent diet ad libitum. Cages contained wood chip bedding, paper shreds and enrichment (wooden balls or sticks). Rats were fed on the ground because metal food dispensers were incompatible with the inductive charging system. Cages were cleaned three times per week.
2.1.3. Electrode implantation
At the time of surgery rats weighted 430 g (mean, 51 g (SD), 13 g (SEM)), and were 9 weeks (2.5 weeks, 0.5 weeks) old. Stereotaxic surgery using non-rupture ear bars was performed under gaseous anaesthesia (induction with 4.5% Isoflurane in 4 l min−1 oxygen and maintenance with 1.2%–1.8% Isoflurane in 1 l min−1 oxygen). The depth of anaesthesia was monitored continuously using the pedal withdrawal reflex, corneal reflex and breathing. Surgical practice included temperature control, an aseptically prepared surgical field, subcutaneous (s.c.) antibiosis (pre- and 4 days post-op; Metronidazole (20 mg kg−1) and Gentamicin (6 mg kg−1) QD), tear replacement ointment (Vidisic, Chem.-pharm. Fabrik GmbH, Germany), local anaesthesia at the skin incision (maximum 0.05 ml 0.5% Lidocaine, diluted from Lidocaine 1%, Hameln Pharmaceuticals Ltd, UK), anaesthetic cream at the ear bars (Emla 5% cream, AstraZeneca, UK), fluid replacement and analgesia (Buprenorphine 1 h pre- and 4 days post-op (0.015–0.03 mg kg−1 s.c., BID)). The analgesic dose administered depended on the rat grimace score. Warmth was provided in part of the cage for 18 h post-surgery.
For implantation, a midline skin incision was made from between the eyes to between the ears which included some skin resection. The reference points Bregma and Lambda were exposed. Three bone screws (1.59 mm, Stoelting, Ireland) were inserted into drill holes. Due to instability of headstages in the first rats operated the number of holding cranial screws was increased to four. The left and right STN location was stereotaxically defined (location −3.6 mm craniocaudal and −2.5 mm mediolateral from Bregma and −7.6 mm dorsoventral from the dura). The actual size of the rat's skull was considered and if necessary controlled for. The following procedures were performed after random allocation:
- (a)Insertion of stimulation electrode for future DBS or insertion of electrode (SNEX-100, Microprobes for Life Science, Gaithersburg, USA).
- (b)Insertion and immediate removal of electrode (stab incision) or craniotomy only.
During electrode insertion, local field potentials (LFPs) were recorded to help localise the STN. LFPs were recorded through a pre-amplifier (NL844) and amplifier-filter system (Neurolog, both Digitimer Ltd, UK) between the two electrode contacts with the ground electrode located at the skin incision and recorded using Spike 2 (C.E.D.) after AD conversion (1401, C.E.D.). Once positioned, the electrode was fixed with cyanoacrylic glue (Loctite, Henkel, Germany) and the skull was covered with a cap of dental cement (Dentalon plus, Heraeus Kulzer GmbH, Germany), enveloping the connector for the headstage and forming a platform to secure the headstage. The skin was re-aligned cranially and caudally using an intra-dermal suture (Vicyl 4–0, Ethicon Inc., USA).
In four rats the headstage dislodged prematurely due to infection (n = 1; excluded from the study) or mechanical dislodgement (n = 3, at 4, 6 and 6 weeks; data presented but excluded from histology and analysis). In another rat technical failure of the headstage occurred at 6 weeks (excluded from analysis). Minor side effects noted included itchiness (n = 2), bites from a cage mate (n = 2) and need for re-attachment of the stimulator (n = 2).
Two rats were implanted bilaterally in order to record the extracellular DBS pulse waveform. The voltage at the right electrode during stimulation of the left electrode was recorded at 8 weeks with a sampling frequency of 50 kHz. In one rat (rat 25), stimulation was applied for 1 h at the 4 and 8 weeks time points.
2.1.4. Deep brain stimulation (DBS)
DBS was delivered using a wirelessly programmable and inductively powered headstage (S-series, Triangle BioSystems International, USA) with an inductive coil fitted around the rats' home cage to provide continuous charging of the headstage. The stimulation parameters were based on those used clinically for Parkinson's disease [23] and for therapeutic DBS in rats [24–26]. Bipolar constant current stimulation was delivered at a frequency of 130 Hz with anodic biphasic, rectangular, balanced pulses with a stimulating pulse of 60 µs duration and a charge balancing pulse of 120 µs duration with an amplitude half that of the stimulating pulse. The stimulation amplitude was set individually for each rat at the minimum of either 100 µA (six rats) or 80% of the amplitude that caused involuntary jerky forepaw movements (80 µA in two rats). The concentric electrodes were configured with an active PtIr contact (0.078 mm2) and stainless-steel reference contact (0.34 mm2) 0.5 mm apart throughout the study. The applied stimulation lies within the effective range reported for suppression of motor symptoms in 6-OHDA rats in the literature [24–26]. Pulse charge per phase and charge density were calculated for the maximal amplitude pulse. Continuous stimulation was delivered mean 6:57 h d−1 (SEM 0.01 h, SD 0.19 h). Continuous stimulation for 24 h d−1 was not possible due to technical limitations of the inductive charging system.
2.1.5. Impedance spectroscopy
Impedance of the electrode and surrounding tissue was measured using the two-electrode technique using a precision LCR Meter (E4980AL, Keysight, USA). Impedance was measured at >80 frequencies in the range from 20 Hz to 300 kHz at an amplitude of 20 µA. Impedance was measured daily in the morning for 1 week and three times a week, thereafter, in the home cage. Stimulation was discontinued during impedance recordings. To assess the reversibility of these changes, DBS was stopped in a rat receiving DBS at 6 weeks and was applied for 1 h in a rat that did not previously receive DBS at 4 and again at 8 weeks.
2.1.6. Perfusion and brain harvest
At the end of 8 weeks rats were anaesthetised (induction with 4.5% Isoflurane in 4 l min−1 oxygen; maintenance with 1.2%–1.8% Isoflurane in 1 l min−1 oxygen). A final impedance spectrum was recorded. Anaesthesia was deepened until the pedal withdrawal reflex was completely abolished and the animal was trans-cardially perfused with phosphate buffered saline (Sigma-Aldrich), followed by 10% formalin (Sigma-Aldrich), after administration of heparine (625 IU/rat, INNOHEP 2500 IU, LEO Pharma, Denmark). The headstage and electrode were removed after fixation. The brain was harvested, and each hemisphere cut to allow horizontal slicing of the electrode tract at the level of the two contacts.
2.1.7. Histology and immunocytochemistry
The brain tissue was paraffin embedded and 3.5 µm slices were cut for standard haematoxylin & eosin staining and immunocytochemistry for glial fibrillary acidic protein (GFAP) for astrocytes, Iba1 to for microglia, neuron specific enolase (NSE) for neurons and neurofilament (NF) for axons and dendrites. Slices were first dewaxed and rehydrated (Leica autostainer, Leica, Germany). Histological slides were examined by a veterinary pathologist (HJ). Five hemispheres with electrodes that were stimulated, seven hemispheres with electrodes that were not stimulated, four hemispheres with a stab incision and eight control hemispheres were available but some slides were lost due to technical problems.
Heat mediated antigen retrieval was required for Iba1 (heating for 20 min in pre-heated 0.01 M tri-sodium citrate at pH 6.0) and NSE (heating for 10 min in pre-heated 0.01 M tri-sodium citrate at pH 6.0). An endogenous peroxidase block was performed using 3% H2O2 in ethanol. For GFAP a Proteinase K step was included (Digest-All, Invitrogen). Blocking was performed with normal horse serum for 30 min at room temperature (ImmPRESSTM Kit, Vectorlabs, USA). Then the slides were incubated with the primary and following secondary antibody. For astrocytes anti-GFAP (polyclonal rabbit anti-GFAP, Z033401, DAKO, Denmark) was used at 1:400 dilution for 60 in at 37 °C with an ImmPRESSTM VR Reagent Kit anti-rabbit IgG (MP-6401, Vectorlabs) as secondary antibody and detection system. For microglia anit-Iba1 (goat anti-human plyclonal AIF1/Iba1, LS-B2402 LSBio, USA) was used at 1:500 for 60 min at room temperature with an ImmPRESSTM HRP Reagent Kit anti-goat IgG (MP-7405, Vectorlabs). For neurons anti-NSE (anti-rabbit polyclonal NSE, ab53025, Abcam, UK) was used at 1:100 for 24 h at 4 °C with an ImmPRESSTM VR Reagent Kit anti-rabbit IgG (MP-6401, Vectorlabs). For neural processes NF (monoclonal mouse anti-NF, M0762, DAKO) was used at 1:125 for 60 min at room temperature with an ImmPRESSTM VR Reagent Kit anti-mouse IgG (MP-6402, Vectorlabs). The secondary antibody was applied for 30 min at room temperature. Fast acting 3,3'-diaminobenzidine (Sigma-Aldrich) was used for detection. Slides were counterstained with haematoxylin before dehydration and cover slipping. Slices were then scanned at 40× magnification (ScanScope XT, Aperio Technologies, USA).
Scanned images of immunocytochemistry slides were computationally analysed using custom developed code in MATLAB (Mathworks, USA). For GFAP, the density of stained pixels as a function of distance from the electrode edge was quantified as the percentage difference in the number of stained pixels per unit area compared with a control area in the same slide. For Iba1, individual cells were identified using a custom developed machine learning model to differentiate full microglia from partial cells and noise. All cells in the area of interest (600 µm from electrode centre) were automatically identified based on their shapes and colour for a subset of images. A graphical user interface presented the segmented cells in a random and blinded fashion and cells were then classified by two operators (JE and HJ) into activated (bushy or amoeboid) and inactive (ramified) microglia to create a training set. The training set was then used to automatically segment the cells in the rest of the images into the activated and inactive categories. Total microglia profiles, activated and inactive microglia were compared for each group. For NSE, the location of NSE positive cells was marked computer assisted and the number of neuron profiles in relation to distance from the electrode edge counted. For NF, the density of stained pixel as a function of distance from the electrode edge was quantified as the percentage difference in the number of stained pixels compared with a control area in the same slide. For all the segmentation methods mentioned above, image contrast was first enhanced using a quaternion based approach before using the red, green and blue (RGB) channels of the image to find the stained areas.
2.1.8. Statistical analysis
In vivo impedance data were analysed using a three-way repeated-measures analysis of variance (ANOVA) with the factors stimulation group (between subjects), time and frequency (within subjects) including ten frequencies (20 Hz, 50 Hz, 100 Hz, 500 Hz, 1 kHz, 5 kHz, 10 kHz, 50 kHz, 100 kHz and 300 kHz) and 12 time points (baseline, mean of day 2 and 3, day 3 and 5, day 6 and 7, day 8 and 9, day 10 and 12, week 3, week 4, week 5, week 6, week 7 and week 8) (MATLAB, Mathworks). Post-test used the Tukey–Kramer correction. In vitro impedance recordings at 14 days and immunohistochemistry results were similarly analysed using a two-way repeated-measures ANOVA with the factors frequency and group or distance and group, respectively (MATLAB, Mathworks). A power of 80% and criterion for statistical significance of p < 0.05 were used.
2.2. In vitro electrode characterisation
2.2.1. Impedance spectroscopy
The EDL of the concentric bipolar electrodes (SNEX-100, Microprobes for Life Science) was characterised in saline solution. Electrode impedance was measured using electrochemical impedance spectroscopy with the electrode in 0.9% saline solution, following immersion for 24 h, using a precision LCR Meter (E4980AL, Keysight). Impedance measurements were performed using the two-electrode technique in the range from 20 Hz to 300 kHz with an applied current amplitude of 20 µA in five electrodes. Impedance was also recorded in 0.2 mg ml−1 albumin bovine serum albumin (BSA, Sigma-Aldrich) in 0.9% saline solution over 14 days with (n= 6) and without (n= 10) the application 130 Hz stimulation using the same balanced pulse as in vivo (rectangular biphasic, 100 µA, 60 µs, balancing pulse of half the amplitude).
2.2.2. Silver stain
SNEX-100 electrodes immersed in protein solution for 14 days with (n= 4) or without (n= 3) stimulation with a rectangular balanced pulse of 130 Hz frequency, 60 µs pulse duration and 100 µA amplitude were stained with a universal protein stain. A Pierce Silver Stain Kit (2612, ThermoScientific, Dublin, Ireland) was used for the stain. Staining was performed as per instructions. After washes with 10% ethanol and ultrapure water, 1 min incubation in the Sensitizer Working solution was performed, followed by 30 min incubation in the Stain working solution (silver nitrate) and development for 2 min which was stopped with 5% acetic acid. Electrodes were imaged with a stereomicroscope (SZR-180, Opticamicroscopes Italy, Italy). Semi-quantitative analysis of the electrode area covered in protein was performed (MATLAB). Two images were taken for each electrode contact, one of each side. In each image, half of the electrode was assumed to be visible (covered or not), the outline of the contact was semi-manually segmented by an operator blinded to group allocation and the ratio of pixels covered to pixels not covered in the segmented area was computed and converted to mm2 using the known surface of the contacts.
2.3. Finite element model (FEM) of DBS in the rat brain
2.3.1. Overview
A 3D-piecewise heterogeneous FEM of the rat brain was used in combination with the in vitro and in vivo impedance data to estimate the electrical properties of the ETI in the stimulated and unstimulated conditions. The EDL equivalent circuit parameters were calculated using the impedance spectrometry data for the active electrode in saline solution. Equivalent double layer properties were then applied using a thin layer approximation in the FEM and a parametric sweep method was applied to estimate the dispersive (frequency-dependent) properties of the encapsulation tissue surrounding the chronically implanted electrode under stimulated conditions. Assuming that the electrical conductivity and permittivity of the encapsulation tissue did not change with stimulation, the properties of the EDL during unstimulated conditions were then estimated by iteratively solving for the impedance at the electrode using FEM to converge on the experimentally recorded impedance values for the unstimulated condition. Finally, the FEM was coupled to a population of multicompartment neuron axon models representing branching axon collaterals within the STN [27, 28], to estimate the influence of stimulation-induced changes in the ETI on the extent of neural activation under stimulated and unstimulated conditions.
2.3.2. EDL equivalent circuit parameter identification
To estimate the equivalent EDL parameters in vitro, the impedance spectrum of the electrode in physiological solution was fit to a circuit model similar to that proposed by McAdams et al [29]. The equivalent impedance of a 10 nm thick EDL was represented as a parallel combination of a constant phase angle element,  , and the overpotential independent form of the charge transfer resistance,
  ,
,
where  and
and  are constants denoting the magnitude of the impedance of the EDL and inhomogeneities at the surface of the electrode, respectively;
  is the universal gas constant,
  Faraday's constant,
  temperature,
  the number of electrons per molecule, and
  the exchange current density. In this case, the electrode was considered as a partially polarizable electrode where the electrode behaves as a pseudocapacitor and the faradic component was assumed to be zero due to electrode reaction being infinitely slow.
2.3.3. FEM of rat DBS
A heterogeneous rat model with geometrical structures comprising a cerebrospinal fluid (CSF), STN, grey and white matter of the brain was created using image segmentation of Waxholm Space atlas of the Sprague Dawley rat Brain (WSSD) atlas [30]. The segmented masks of the different brain tissues were converted to a geometric model using Simpleware ScanIP software (Synopsys, USA). The microelectrode was positioned within the STN with the aid of WSSD atlas as shown in figure 1(b). Finally, a surrounding layer of tissue of 100 μm and 200 μm thickness as indicated by the extent of the glial scar in the histological analysis was created in the geometry to represent the encapsulation layer for chronic conditions under unstimulated and stimulated conditions, respectively, see figure 3.
2.3.4. Mathematical framework
The potential within the FEM was calculated using the time harmonic electric-quasi static Laplace equation, where magnetic and wave propagation effects were neglected [31–33]:

 and
and  are the electrical conductivity and relative permittivity,
  is angular frequency,
  permittivity of free space, and ϕ scalar potential. Maxwell's equation in this form considers the frequency dependent conductivity and permittivity, where both conductivity and permittivity were described using the Cole–Cole equation representation.
2.3.5. Material properties
Dispersive electrical properties of the rat brain grey matter, white matter and encapsulation tissue were incorporated in the FEM using the four pole Cole–Cole model with parameters described by Gabriel et al [34]:
where,  is difference between the static relative permittivity and high frequency relative permittivity for pole n,
  is the high frequency relative permittivity,
  is the angular frequency,
  is a distribution parameter for pole n,
  is ionic conductivity, and
  is the relaxation time of pole n. The Pt/Ir active contact, stainless steel ground contact and polyimide insulation were purely conductive with electrical conductivity
  ,
,  and
and  S m−1 [35], respectively.
2.3.6. Boundary conditions
During bipolar stimulation in the computational model, the platinum–iridium contact of the microelectrode was assigned as the active terminal to which a constant voltage or current was applied, the stainless-steel contact was assigned as ground. Neumann boundary conditions were applied to the insulating parts of the electrode and outer surface of the skull [32].
The ETI was implemented using the thin layer approximation for both voltage-controlled stimulation and current controlled stimulation [36]. With thin layer approximation, it was assumed that total current density passing through the ETI layer is equal to the normal component of finite thickness layer:
where,  is the normal current density at electrode surface,
  is the voltage across a layer of thickness
  . The intrinsic properties and thickness of ETI were replaced with total admittance calculated from equivalent circuit parameters:

where,  is the inverse of the estimated impedance,
  .
.
2.3.7. Estimation of encapsulation tissue properties
A parametric sweep method was used to estimate the electrical properties of the encapsulation tissue where the Cole–Cole parameters of the encapsulation tissue were swept between the established values for white matter and 175% of the white matter properties [34]. Solving the finite element model for each set of parameters, the parameters for which the deviation between the experimentally recorded and simulated impedance data, across the frequency range from 20 Hz to 300 kHz, was minimised were identified. Assuming linearity at the EDL interface [37], the impedance at the electrode,  , can be calculated using Ohm's law:
where V is the electric potential calculated using the Laplace equation over active surface area, and  is the normal current density around active electrode and ds the electrode surface area.
2.3.8. Solver and postprocessing
The piecewise heterogeneous rat brain model with DBS electrode was meshed using Simpleware Simpleware ScanIP (Synopsys). The model consisted of 5 million tetrahedral elements. A quadratic interpolation function was used on each tetrahedral element to approximate the scalar potential. Finally, the discretised FEM was solved using COMSOL Multiphysics (COMSOL, USA) using the BiCGStab iterative solver with a geometric multigrid preconditioner.
To incorporate the influence of dispersive tissue properties on the stimulation waveform in the surrounding tissue, the electrical potential was estimated for 800 harmonics of the fundamental stimulation frequency (130 Hz), equation (1), to obtain the transfer function of the tissue at these frequencies. The square wave stimulus pulse train, with pulse duration 60 μs and stimulation frequency of 130 Hz, was transformed to the frequency domain using the fast Fourier transformation (FFT). The FFT of the stimulus pulse train was then multiplied by the transfer function estimated at a given point within the surrounding tissue to obtain a frequency domain estimate of the potential at that point before taking the inverse FFT of the resulting signal to obtain the time domain voltage at the point of interest:


where,  is the Fourier transform of extracellular potential at a point
  in the STN,
  is the potential at point
  due to a unit source at the electrode calculated using the finite element model,
  is the applied DBS pulse train and
  is the extracellular potential at point
  due to the DBS pulse train.
2.3.9. Simulation of effect of DBS on axon collaterals within the STN
To determine the extent of activation by STN DBS of afferent collaterals within the STN, 1000 idealised multi-compartment cable models of an axon and branching collateral were positioned inside the STN. Axon collaterals were positioned within the STN, parallel to one another, and orientated to project in the direction. The axon and collateral model was based on that used previously by Lowery and Kang [27, 38] with membrane parameters based on an experimental study in mice developed by Foust et al [39]. This model captures the threshold of activation of the axon and collateral by considering the properties of the model neuron along with the electrode geometry, the ETI, and the heterogeneity and electrical properties of brain tissue incorporated in the rat DBS FEM model. Multi-compartment axon collaterals were simulated to be 500 µm long with a diameter of 0.5 µm and were comprised of 11 segments with ten nodes. Each collateral was connected to a myelinated axon comprised of ten nodes each of length of 2 μm and diameter of 0.5 μm separated by ten internodes of length 500 μm and diameter 1.2 μm [39]. At each instant in time, the time dependent extracellular potential computed from the FEM model was applied to each node of each collateral segment in NEURON using the extracellular mechanism. The activation threshold of each collateral was defined as the minimum current or voltage at which action potential propagation was observed. The neuron models were simulated in the NEURON simulation environment [40] and implemented in Python using the PyNN API package [41]. The model was numerically integrated using the Crank–Nicholson method with a 0.01 ms timestep.
3. Results
3.1. Impedance of implanted electrodes under stimulated and unstimulated condition
Impedance decreased in the first 2 days following surgery from a baseline value of 24.5 kΩ (±11.1 kΩ) at 1 kHz and then increased within the first 3 weeks (figure 2(c)). After 3 weeks impedance was stable in both groups (figure 2(c)). The transient reduction in impedance in the 2 days post-surgery is consistent with the accumulation of blood and CSF at the implantation site, while the following increase in impedance marks the development of the glial scar which is fully formed during the plateau state [9]. The impedance of stimulated electrodes followed the same initial pattern as the unstimulated electrodes, but remained lower from the start of stimulation at day 3 throughout the experimental period. Comparing complete 8 weeks data sets (n= 4/9 in stimulation and n= 7/7 in no-stimulation group), impedance was significantly lower in the stimulation group than in the non-stimulation group. A three way repeated-measures ANOVA showed a significant effect on electrode impedance of all main effects (stimulation group (F(1,9) = [6.47], p = 0.032)), time (F(11,99) = [3.75], p < 0.001), frequency (F(9,81) = [72.67], p < 0.001) and interaction group × time × frequency (F(99,891) = [1.32], p = 0.024). Post-hoc testing confirmed that impedance was different between groups from week 5 onwards, at 20 Hz, 500 Hz, 1 kHz, 5 kHz and 10 kHz. Differences between the stimulated and unstimulated groups were more pronounced in the lower frequency range (figures 2(d) and (e)). Group data illustrating differences in the Nyquist plots over time are presented in figures 2(f)–(h). The characteristic semicircular arc at low frequencies was evident in four out of seven animals for the unstimulated electrodes and was not evident with the stimulated electrodes [15, 42].
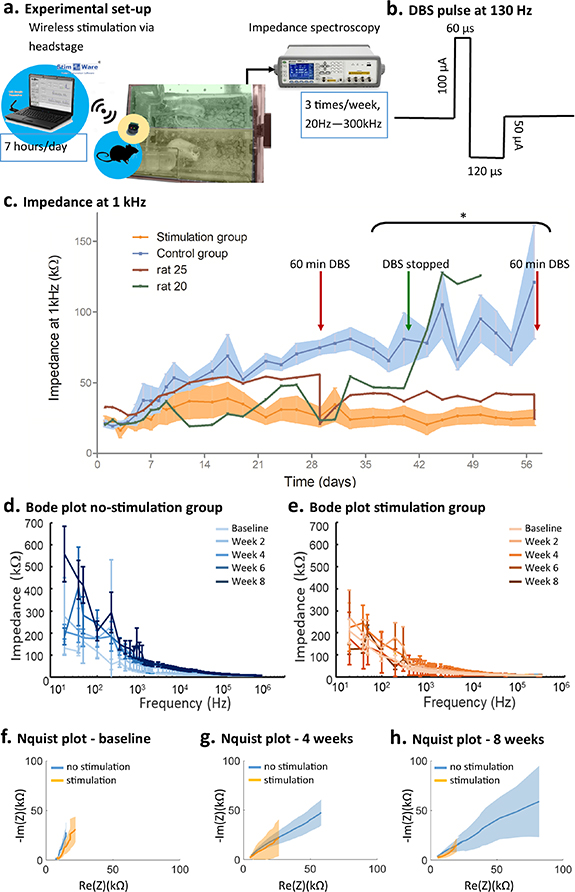
Figure 2. Stimulation-induced changes in impedance spectra. (a) Experimental set-up including wireless stimulation and impedance spectroscopy. (b) DBS pulse. (c) Impedance group data at 1 kHz over 8 weeks for stimulation (N = 9) and no-stimulation (N = 7) groups. Shaded areas indicate SEM, *significant difference between the two groups (p < 0.05, analysis based complete data sets N = 4 for stimulation and N = 7 for no-stimulation group). Impedance at 1 kHz in two additional rats that received 60 min stimulation at two time points (rat 25, red trace) or where continuous stimulation was stopped (rat 20, green trace) is also shown. (d) and (e) Group mean and SEM of Bode plot (20 Hz–300 kHz) for no-stimulation (d) and stimulation (e) group at baseline, and 2, 4, 6 and 8 weeks. (f)–(h) Group mean and SEM of Nyquist plots at baseline (f), 4 weeks (g) and 8 weeks (h), for the no-stimulation (blue) and stimulation (orange) group.
Download figure:
Standard image High-resolution imageThe reduction in impedance with stimulation was largely reversible, with cessation or resumption of stimulation resulting in an increase or decrease in impedance, respectively (figure 2(c)). When stimulation was stopped, impedance doubled over the next 2 days and remained high until the end of the experiment (figure 2(c)—green trace). Delivering 1 h of DBS when stimulation had not previously been applied, decreased the impedance to approximately half its value on both instances (figure 2(c)—red trace).
The delivered DBS with a 100 µA amplitude and 60 µs pulse duration had a pulse charge of 6nC/phase and a charge density of 7.64 µC cm−2. These lie comfortable within the maximum allowable current amplitude, charge and charge density proposed by Shannon [43].
3.2. Histological examination of the encapsulation tissue
Anti-GFAP, a common astrocyte marker, was used to assess the extent of glial scarring around the implanted electrode. Horizontal sections through the contact area of the stimulated (n= 5) and unstimulated (n= 6) electrodes and equivalent sections from the other hemisphere with normal brain tissue (n= 7) or stab incision (n= 3) were stained (figure 3(a)). GFAP density as a function of distance from the electrode was quantified as the percentage difference in the number of stained pixels compared with a control area in the same slide. Compared to the normal brain tissue, astrocytosis was denser out to 100 µm for unstimulated electrodes and 200 µm for stimulated electrodes (two-way repeated-measures ANOVA: stimulation group (F(3,17) = [3.83], p = 0.03), distance (F(133,17) = [15.38], p < 0.0001), interaction (F(399,17) = [5.96], p < 0.0001)). Brain parenchyma formerly subjected to a stab incision did not show significantly denser astrocyte population than control tissue after 8 weeks. When astrocytosis around stimulated and unstimulated electrodes was compared, a significant difference in density was observed between 50 and 175 µm from the electrode (figures 3(c)–(e)).
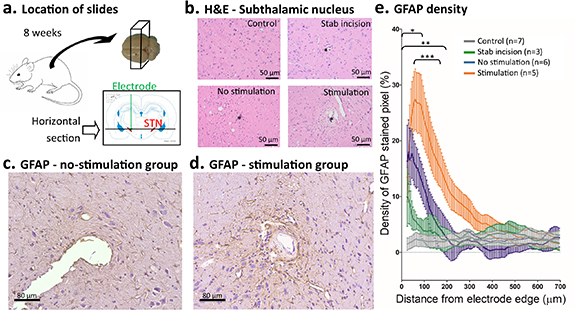
Figure 3. Astrocyte reaction surrounding the electrode. (a) Horizontal 5 µm sections (black line) cut at the level of the STN (red) after 8 weeks. (b) Representative photomicrographs of the STN for each of the four groups (control, stab incision, no-stimulation and simulation) with H&E stain (* denotes electrode position). (c) and (d) Representative photomicrographs of the area surrounding the electrode location in the STN for the no-stimulation group (c) and the stimulation group (d). Immunocytochemistry for GFAP. (e) Density of GFAP stained pixels relative to distance from electrode (mean and SEM). Significant differences were observed between no-stimulation and control groups (*), between stimulation and control groups (**) and between no-stimulation and stimulation group (***).
Download figure:
Standard image High-resolution imageTo examine the extent of persistent neuroinflammation, coronal sections were stained for anti-Iba1 and positively identified microglia classified as inactive (ramified) or activated (bushy or amoeboid) (figures 4(a) and (b)). Activated, inactive and total microglia were denser within 200 µm of the electrode two-way repeated measures ANOVA distance factor: activated microglia (F(6,18) = [2.44], p = 0.03), inactive microglia (F(6,18) = [2.41], p = 0.02), total microglia (F(6,18) = [2.63], p = 0.02). No increase in microglia density was observed in control slides. A modest increase in all other groups (stimulated, n= 5; unstimulated, n= 6; normal brain tissue, n= 7; stab incision, n= 4) was not statistically significant when compared to the control group (figures 4(d)–(f)), (group factor: activated microglia (F(3,18) = [1.16], p = 0.35), inactive microglia (F(3,18) = [0.45], p = 0.72), total microglia (F(3,18) = [0.50], p = 0.69)). The relation between activated and inactivated microglia was 3.4 ± 8.0% and did not significantly change for either group (F(3,18) = [1.91], p = 0.16) or distance (F(6,18), p = 0.06).
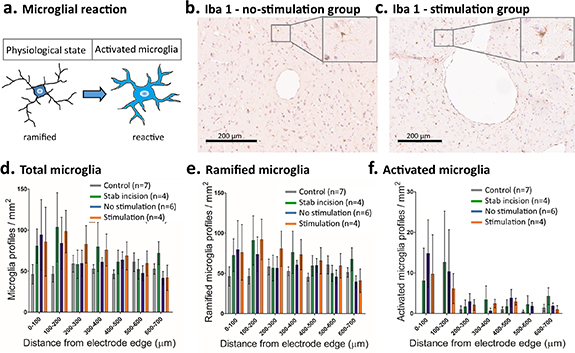
Figure 4. Microglial reaction surrounding electrode: ramified and reactive microglia (a) around the electrode in the STN. (b) and (c) Representative photomicrographs of the area surrounding the electrode location in the STN for the no-stimulation group (b) and the stimulation group (c) with examples of ramified (inset b) and activated microglia (inset c). Immunocytochemistry for microglia (Iba1). (d)–(f) No significant differences were observed in either the total number, or number of ramified or activated, microglia up to 700 µm away from the electrode location between the four groups (mean and SEM are shown).
Download figure:
Standard image High-resolution imageThe presence and structure of neurons and axons in the vicinity of the electrode were studied to assess the level of neurodegeneration around the electrode (figure 5). Neuronal cell bodies were stained by anti-NSE, an enzyme present in neurons, and axons by anti-NF, a structural filament. There was no difference in neuron density between stimulated electrodes (n= 5), unstimulated electrodes (n= 5), normal brain tissue (n= 8) and stab incision (n= 4) two-way repeated-measures ANOVA: group (F(3,18) = [0.56], p = 0.65), distance (F(6,18) = [0.45], p = 0.84), interaction (F(18,18) = [0.91], p = 0.56)). No signs of neurodegeneration were observed in the stained neurons (figures 5(a)–(c)). Neuronal processes were uniformly thick with no signs of degeneration. The density of NF stained neural processes was not significantly different between stimulated electrodes (n= 5), unstimulated electrodes (n= 6), normal brain tissue (n= 7) and stab incision (n= 4) two-way repeated-measures ANOVA: group (F(3,17) = [0.36], p = 0.78), distance (F(134,17) = [0.45], p = 1.00), interaction (F(402,17) = [1.13], p = 0.05), (figures 5(d)–(f)).
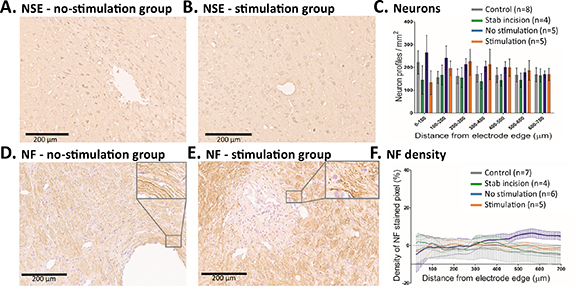
Figure 5. Evaluation of possible neuronal loss (a)–(c) and axonal changes (d)–(f). (a) and (b), (d) and (e) Representative photomicrographs of the area surrounding the electrode location in the STN for the no-stimulation group (a), (c) and the stimulation group (b), (e). Immunocytochemistry for neurons (NSE) (a), (b) and immunocytochemistry for NF highlighting the axons (d) and (e). (c) The number of neurons surrounding the electrode was similar in all four groups. (f) No significant differences in the density of NF-stained pixel in relation to distance from electrode were observed between the four groups (mean and SEM are shown).
Download figure:
Standard image High-resolution image3.3. ETI properties, including EDL and dispersive encapsulation tissue properties, identified using computational modelling
The in vivo impedance data were used in combination with a 3D-piecewise heterogeneous FEM of the rat brain to estimate changes in the electrical properties of the ETI due to stimulation (figure 6(a)). The properties of the pseudocapacitive constant phase angle impedance representing the EDL at the electrode were first estimated using the in vitro impedance data recorded at room temperature in 0.9% saline. The estimated parameter values for the constant phase element were K =  and β = 0.85 (equation (1)). The estimated charge transfer resistance was 1.6 MΩ. Using the FEM, the conductivity and relative permittivity of the encapsulation tissue were then estimated based on the experimental impedance data for the stimulated electrodes at 8 weeks (figure 2(e)).
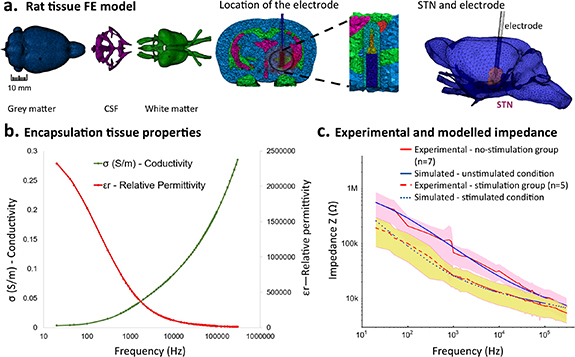
Figure 6. FEM and estimated encapsulation tissue and ETI properties. (a) FEM of rat brain. Horizontal view showing the location of the electrode and STN, and 3D view of the STN and electrode location. (b) Estimated dispersive (frequency dependent) encapsulation tissue properties. Conductivity and relative permittivity of the encapsulation tissue at 8 weeks. (c) Comparison of impedance spectra measured in vivo and estimated using model simulation in silico for the stimulation and no-stimulation groups. Mean and SD of the experimental data are shown.
Download figure:
Standard image High-resolution imageThe estimated conductivity and permittivity of the encapsulation tissue were found to be dispersive, i.e. frequency-dependent, with conductivity increasing exponentially with frequency (encapsulation tissue conductivity was 0.019 S m−1 at 20 Hz, 0.05 S m−1 at 1 KHz, and 0.28 S m−1 at 300 kHz) (figure 6(b)). The relative permittivity of the encapsulation tissue similarly decreased exponentially with frequency (relative permittivity was 2.5 × 10⁶ at 20 Hz, 5 × 10⁵ at 1 kHz, and 12 × 103 at 300 kHz).
The properties of the EDL of the ETI were then estimated for the unstimulated condition, under the assumption that the conductivity and relatively permittivity of the encapsulation tissue remained approximately constant under stimulated and unstimulated conditions, and only the thickness of the encapsulation tissue varied. The estimated constant phase element parameters representing EDL for the unstimulated electrode were K = 2.14 Ω m2 s−β and β = 0.67. The estimated charge transfer resistance remained high, at 3 MΩ. The electrode impedance in the final model showed close agreement with in vivo recorded values under both stimulated and unstimulated conditions, (figure 6(c)).
3.4. Differences in the electric potential field and extent of neural activation due to stimulation-induced changes in the ETI
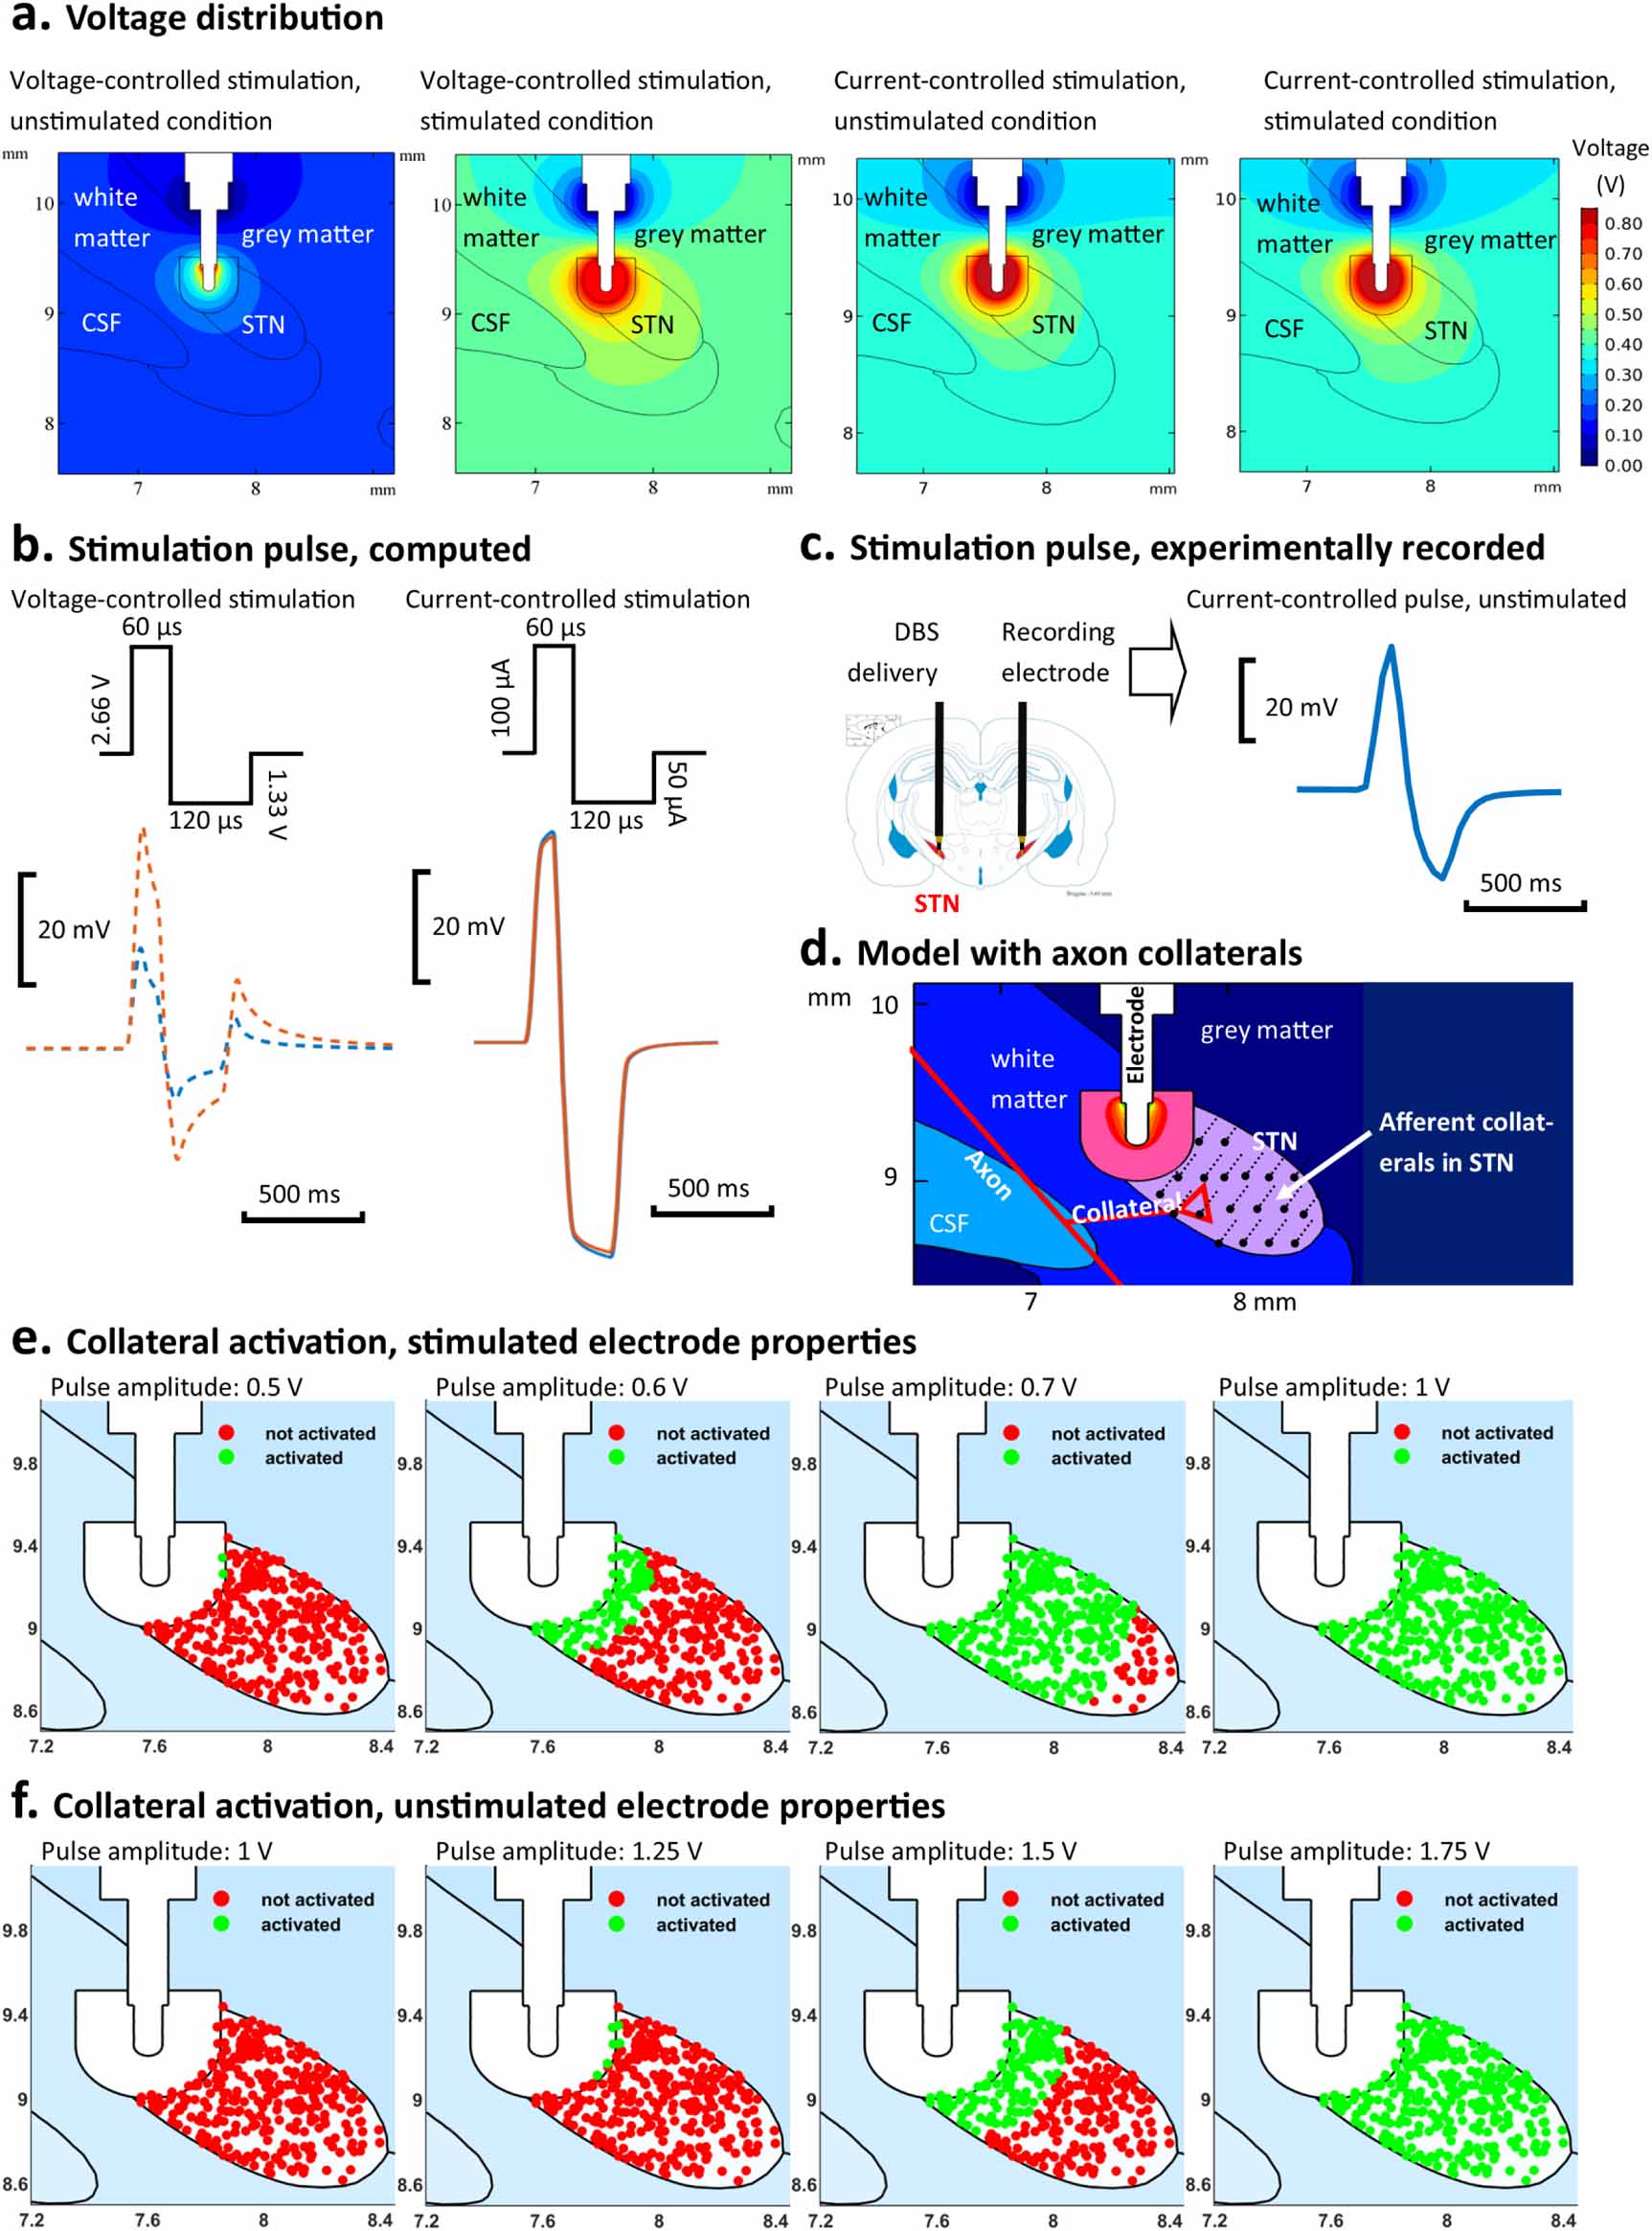
The distribution of the electric potential in the vicinity of the DBS electrode in the finite element model of the rat brain is presented for both current-controlled and voltage-controlled stimulation in figure 7(a). During voltage-controlled stimulation, the voltage distribution was substantially constrained for the unstimulated condition when compared to the stimulated ETI (figure 7(a)). In contrast, during current-controlled stimulation, the voltage distribution in the surrounding brain tissue was effectively independent of the ETI for both stimulated and unstimulated conditions. This is evident in both the distribution of the potential in the region surrounding the electrode and in the extracellular voltage waveforms detected at a given point (figure 7(b)). During current-controlled stimulation, the amplitude and shape of the extracellular waveform remained constant with changes in the EDL properties, exhibiting the characteristic low-pass filtered and dispersive shape arising from the electrical properties of the surrounding bulk grey and white matter tissues, (figures 7(b) and (c)). In contrast, substantial differences in the amplitude and shape of the extracellular waveform are observed when the EDL properties are changed between stimulated and unstimulated conditions, with the high pass filtering effect of the EDL dominating the waveform shape (figure 7(b)). The voltage at the electrode required to generate an electric field equivalent to that generated by a 100 μA current stimulus current, as used in the in vivo study, was 2.6 V when simulating an ETI using parameters estimated for stimulated conditions and 6.2 V for ETI parameters estimated for unstimulated conditions.

Figure 7. Comparison of voltage distribution and axon collateral activation simulated for stimulated and unstimulated ETI properties. (a) Simulated voltage distribution in the tissue surrounding the electrode for voltage-controlled and current-controlled stimulation, at 2.66 V and 100 µA, respectively. Results are presented for stimulated and unstimulated ETI properties. (b) Simulated extracellular potential at a point inside the STN, 1 mm from the electrode, for stimulated (orange) and unstimulated (blue) electrodes under biphasic voltage- and current-controlled stimulation. (c) Experimentally recorded stimulation pulse under current-controlled stimulation. The stimulation pulse was recorded 5 mm from the stimulation electrode in the opposite hemisphere in rat 26 during stimulation at 100 µA. (d) Schematic diagram of model illustrating STN afferent collaterals. (e) Comparison of stimulated (green) and unstimulated (red) STN afferent collaterals for voltage-controlled stimulation of different amplitudes (0.5–1 V) simulated with ETI properties for stimulated electrodes. (f) Comparison of stimulated (green) and unstimulated (red) STN afferent collaterals for voltage-controlled stimulation of different amplitudes (1–1.75 V) simulated with ETI properties for unstimulated electrodes.
Download figure:
Standard image High-resolution imageUsing the model, a 100 μA stimulus pulse, of duration 60 μs, was found to activate 100% of afferent collaterals projecting to the STN, figure 7(e). The number and distribution of activated axon collaterals remained unchanged when the ETI properties were changed from stimulated to unstimulated conditions, for current-controlled stimulation. Consistent with the observed differences in the electrical potential surrounding the electrode, the spatial reach of the stimulation and number of activated collaterals changed substantially when ETI properties were varied between stimulated and unstimulated conditions for voltage-controlled stimulation. Collaterals in the STN were progressively activated with increasing pulse amplitude but at different rates for both conditions, with higher stimulation amplitudes required to achieve a similar activation pattern in the unstimulated condition than in the stimulated condition (figures 7(e) and (f)). The minimum voltage required to activate all collaterals in the STN, with a 60 μs pulse duration, was identified as 1 V and 1.75 V, with stimulated and unstimulated EDL properties, respectively. Stimulation pulse amplitudes of 0.5 V, 0.6 V, 0.7 V and 1 V resulted in 0%, 21%, 89% and 100% activation of collateral afferents for stimulated condition, compared with activation of 0%, 2.0%, 41.5% and 100% of collateral afferents with pulse amplitudes of 1 V, 1.25 V, 1.5 V and 1.75 V for the unstimulated condition (figures 7(e) and (f)).
3.5. The effect of stimulation on protein adsorption at the electrode
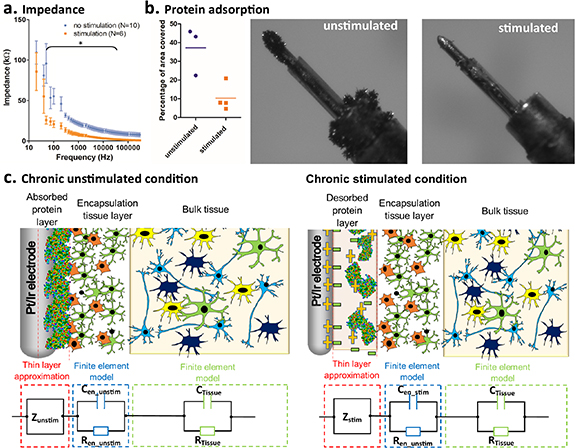
Impedance of electrodes in bovine serum albumin was significantly lower for the stimulated electrodes than for the unstimulated electrodes at 2 weeks (two-way repeated-measures ANOVA: group (F(1,14) = [12.56], p = 0.0032), frequency (F(79,1106) = [23.67], p< 0.001) and group × frequency (F(79,1106) = [2.00], p < 0.001); figure 8(a)). The level of protein adsorption on the stimulated electrode, quantified using the amount of silver stain evident in the images of the stained electrodes, was found to be approximately 25% of that of the unstimulated electrodes with 37.2 ± 12.9% of the surface area exhibiting staining in the unstimulated electrode compared with 10.3 ± 7.2% in the stimulated electrodes (figure 8(b)). The results confirm that high-frequency stimulation, at the frequency and current density applied in vivo, results in a reduction in protein adsorption at the electrode interface with a concurrent reduction in impedance.
Figure 8. Stimulation induced changes in protein adsorption in vitro. (a) In vitro impedance spectra for electrodes in 0.2 mg ml−1 bovine serum albumin after 14 days submersion with and without stimulation. (b) Percentage of visible electrode surface area covered by protein visualised using silver nitrate stain. Example image of stained SNEX-100 electrode without and with stimulation applied. (c) Schematic diagram of model of the effect of stimulation on the ETI illustrating differences in EDL properties, due to protein adsorption and desorption, and encapsulation tissue thickness. The full FEM is represented as a simplified equivalent circuit model for illustrative purposes only. In the chronic un-stimulated condition, the EDL is assumed to be dominated by protein absorption onto the electrode surface while in the chronic stimulated condition uniform desorption of protein is assumed.
Download figure:
Standard image High-resolution image
4. Discussion
In this study, we quantified electrode impedance in chronically stimulated and unstimulated DBS electrodes and examined histological properties of the surrounding encapsulation tissue up to 8 weeks post-surgery. The results represent the first longitudinal study to directly compare electrode-tissue impedance in chronically implanted stimulated and unstimulated electrodes and demonstrate a causal link between stimulation and electrode impedance, with lower impedance observed for the stimulated electrodes (figure 2). We also found that astrocytosis was denser and more extensive around stimulated electrodes, while inflammation and neurodegeneration were similarly mild for both. Combining the experimental results with computational modelling revealed a frequency dependent conductivity and permittivity of the encapsulation layer that surrounds the electrode. The model predicted substantial differences in the spatial extent of neural activation for voltage-controlled stimulation when the electrode had been previously stimulated, when compared with previously unstimulated electrodes. These differences were driven by changes at the EDL which could be accounted for by changed in protein adsorption due to stimulation.
The reduction in impedance with stimulation was largely reversible, whereby cessation or resumption of stimulation resulted in an increase or decrease, respectively, in impedance (figure 2). This is consistent with a reduction in impedance in the period following activation of an electrode which has been observed in both basic science [13, 44] and retrospective patient studies [19, 21], and with lower impedance values observed at stimulated electrodes at discrete time points in patients [19–21, 45]. In the present study, impedance was examined following 60 min of stimulation, similar to the time period used by Lempka et al [13]. A 60% reduction in impedance has been observed following just 10 min of 110 Hz stimulation using cortical microelectrodes and a charge density of 36 µC cm−2, with recovery taking up to 4 days [46, 47]. The slower rate of recovery of impedance following cessation of stimulation, noted here also (figure 2(c)), may be due to the time course of protein absorption which has been noted to take approximately 7–14 days to stabilise in vitro.
The current study consolidates findings for DBS electrodes providing information on the electrode impedance in the period from implantation through to stabilization of the ETI during chronic stimulation. In addition to the change in electrode impedance, histological analysis revealed an increase in astrocyte density and the extent of astrocytosis around the stimulated electrodes (figure 3). The literature to-date has been inconclusive on the influence of electrical stimulation on glial scar formation [11]. Changes in astrocyte density were not observed in previous studies of long term STN DBS in Goettingen minipigs [48] or stimulation in the cat midbrain [49]. Stronger astrocytosis has been observed around stimulated iridium microelectrode arrays in the cat sensorimotor cortex [17], in line with our findings. There are two hypotheses regarding astrocyte proliferation under electrical stimulation. Firstly, denser and more extensive astrocytosis may represent a stronger foreign body reaction [10]. However, this mechanism is not supported by the lack of increased activation of other components of the foreign body response, in particular microglia, observed here. Alternatively, astrocyte proliferation may result from increased neuronal activation. As part of the tripartite synapse, astrocytes react to neuronal depolarisation [50] and neurotransmitter release which is induced by high frequency stimulation [51, 52]. In vivo and in vitro experiments in mice showed that high frequency stimulation affects astrocytes directly, causing elevation in intracellular calcium and glia transmitter release [52]. Release of astrocytic adenosine triphosphate from which the active molecule adenosine is split has been shown to be part of the mechanism by which DBS reduces tremor [52]. Additional work on ferret astrocytes and thalamic slides showed astrocytic glutamate release in addition to adenosine release [53]. Our results lend further support to these and other recent findings of a direct effect of DBS on astrocytes [54].
While electrode implantation was accompanied by mild neuroinflammation, no effect of stimulation on neuroinflammation was observed. Reduced neuroinflammation in response to 2 weeks of DBS for 1 h d−1 was previously reported [16]. The difference in results with respect to the present study could be due to transient effects or differences in electrode material. In addition, no sign of neurodegeneration was evident in either the stimulated or unstimulated group, indicating no neurodegenerative effect of DBS at the stimulation intensity used. No detectable change in neuronal density in the tissue surrounding chronically implanted microelectrodes with continuous stimulation of the cat sensorimotor cortex was found at a charge density of 100 μC cm−2, however, stimulation at a higher charge density of 100 μC cm−2, resulted in neuronal loss in a 150 µm radius around the electrode [17].
To investigate the consequences of the observed changes on the efficacy of neural stimulation, we examined the electrical field distribution and activation of axon collaterals, shown to be preferentially activated during DBS, using computational models [55, 56]. For modelling purposed, the electrode has been assumed to be an ideal, partially polarizable electrode, which behaves as a leaky capacitor in line with the stimulation parameters applied within the limits of linearity. The results presented thus apply to conditions of non-faradaic charge transfer only. The dispersive conductivity and permittivity of the encapsulation tissue were estimated revealing frequency dependent permittivity and conductivity of the tissue (figure 6(b)). GFAP staining also revealed a denser and thicker layer of glial scar surrounding chronically stimulated electrodes (figure 3). The results provide new data on the dielectric properties of the encapsulation tissue surrounding DBS electrodes, which can be incorporated into computational models of the ETI [32, 35, 57]. Models to-date have assumed the glial scar to behave as a passive barrier, represented as a layer of purely resistive tissue [58–60], which does not fully capture the effect of the encapsulation tissue on the electric field and stimulation of the surrounding tissue.
The axon model incorporated in this study, while representing a good approximation to the anatomical and physiological properties of the neurons targeted by stimulation, is a simplification. While the addition of complex branching and collateral orientation when compared to a single collateral model has been found to have little effect on the threshold activation [56], differences in the fibre orientation, diameter, ionic properties, and electrical tissue properties would all impact on the stimulation threshold of individual neurons. Nevertheless, the main finding of a substantial difference, approximately 100%, in the threshold for stimulation for stimulated and unstimulated electrodes with voltage-controlled stimulation would still be expected, with quantitative results of the simulations providing insight into the scale of the differences observed and the mechanisms involved.
The change in electrode impedance due to stimulation was not attributable to differences in the encapsulation tissue. In contrast with the observed increase or reduction in impedance with cessation or initiation of stimulation, structural changes are not readily reversible. Furthermore, the observed denser and more extensive astrocytosis with stimulation would tend to increase rather than decrease impedance. In addition, varying the electrical properties and thickness of the encapsulation tissue within the physiological range in the model could not account for the impedance changes observed with stimulation.
The results point instead to the ETI as the site of the stimulation-induced impedance changes. Electrode impedance is increased in environments containing protein [61–67]. Related changes at the ETI include decreased charge storage capacity and increased capacitance. A monolayer of adsorbed protein has been shown on a range of electrode types [61–64, 66–69], reducing the surface area for charge transfer [64, 70, 71]. Harris et al estimated a 57% cover of the electrode surface following submersion in protein-containing solution [72]. Further changes in the ETI occur when stimulation is applied at the electrode; a rapid, substantial drop in impedance after stimulation onset and a reduction in cell cover has been observed in cell cultures [73]. Combined with these previous reports, our modelling and experimental results support the hypothesis that protein adsorption and desorption with stimulation is responsible for changes in the functional electrode surface area and subsequent impedance changes due to stimulation. We investigated this hypothesis further by visualising protein at stimulated and unstimulated electrodes in vitro. Imaging revealed observed protein adsorption at the electrodes and markedly reduced adsorption following stimulation (figure 8). Coating of the electrodes with materials that prevent or reduce protein adsorption, such as poly(3,4-ethylenedioxythiophene) (PEDOT) [74] or similar, may provide a means to stabilise the ETI for recording and voltage-controlled stimulation if stimulation varies over time, though the long-term stability of these coating is yet to be established.
Finally, it is well-established that electrode impedance has a substantial effect on the volume of neural tissue activated during voltage-controlled stimulation. The simulation results confirmed activation of a larger volume of tissue for previously stimulated electrodes than for unstimulated electrodes due to changes in the EDL, during voltage-controlled stimulation (figure 7). In contrast, current-controlled stimulation was insensitive to temporary or permanent changes in the electrode-tissue impedance due to gliosis or alterations in protein adsorption (figure 7). The results highlight additional challenges in programming DBS devices for voltage-controlled stimulation as the impedance will change over time as stimulation is switched on and off, or applied at different electrodes. The history of stimulation at a given electrode may also influence the magnitude of LFPs recorded at the electrode in devices for simultaneous sensing and stimulation. These considerations have important implications for the design and implementation of adaptive DBS paradigms using a new generation of devices with both sensing and stimulation capabilities [75]. While current-controlled stimulation mitigates the effect of stimulation-induced changes in impedance on the resulting electric field and neurons stimulated, changes in impedance could still affect electrophysiological signals such as LFPs detected at the electrodes.
5. Conclusion
Reduced electrode impedance and increased astrocytosis was demonstrated in chronically implanted DBS electrodes stimulated for a period of up to 8 weeks post implantation, when compared with and unstimulated electrodes. The reduction in impedance with stimulation was largely reversible, with cessation or resumption of stimulation resulting in an increase or decrease in impedance, respectively. Combining in vitro and in vivo results with in silico modelling, the ETI, in particular protein absorption and desorption at the electrode, was identified as the source of observed impedance differences between stimulated and unstimulated electrodes. The identified stimulation-induced changes in impedance are a potential confounding factor for DBS programming with voltage-controlled stimulation, as the spatial reach of the applied stimulation will increases as impedance drops. The results also have important implications in the design of algorithms for closed-loop stimulation systems if selected stimulation electrodes vary over time. While these effects are mitigated by current-controlled stimulation, care should be taken in the design of systems where electrodes are used for sensing following periods of stimulation of where occlusion of the electrode contact due to protein adsorption results in increases in charge density.
Acknowledgments
We would like to thank Dr John Fleming for input on the axon collateral model and Susan Peters for her work in histopathology. We also like to acknowledge Professor David Brayden for his assistance and introduction to our collaborators in pathohistology. Finally, we thank Professor John O'Connor for sharing his expertise in the animal experimentation techniques.
This project was supported by Science Foundation Ireland and the European Regional Development Fund (Grant No. 13/RC/2073) and the European Research Council (Grant No. ERC-2014-CoG-646923).
Data availability statement
The data that support the findings of this study are available upon reasonable request from the authors.